

Genome Informatics and Machine Learning-Based Identification of Antimicrobial Resistance-Encoding Features and Virulence Attributes in Escherichia coli Genomes Representing Globally Prevalent Lineages, Including High-Risk Clonal Complexes
- PMID: 35164570
- PMCID: PMC8844930
- DOI: 10.1128/mbio.03796-21
Genome Informatics and Machine Learning-Based Identification of Antimicrobial Resistance-Encoding Features and Virulence Attributes in Escherichia coli Genomes Representing Globally Prevalent Lineages, Including High-Risk Clonal Complexes
Abstract
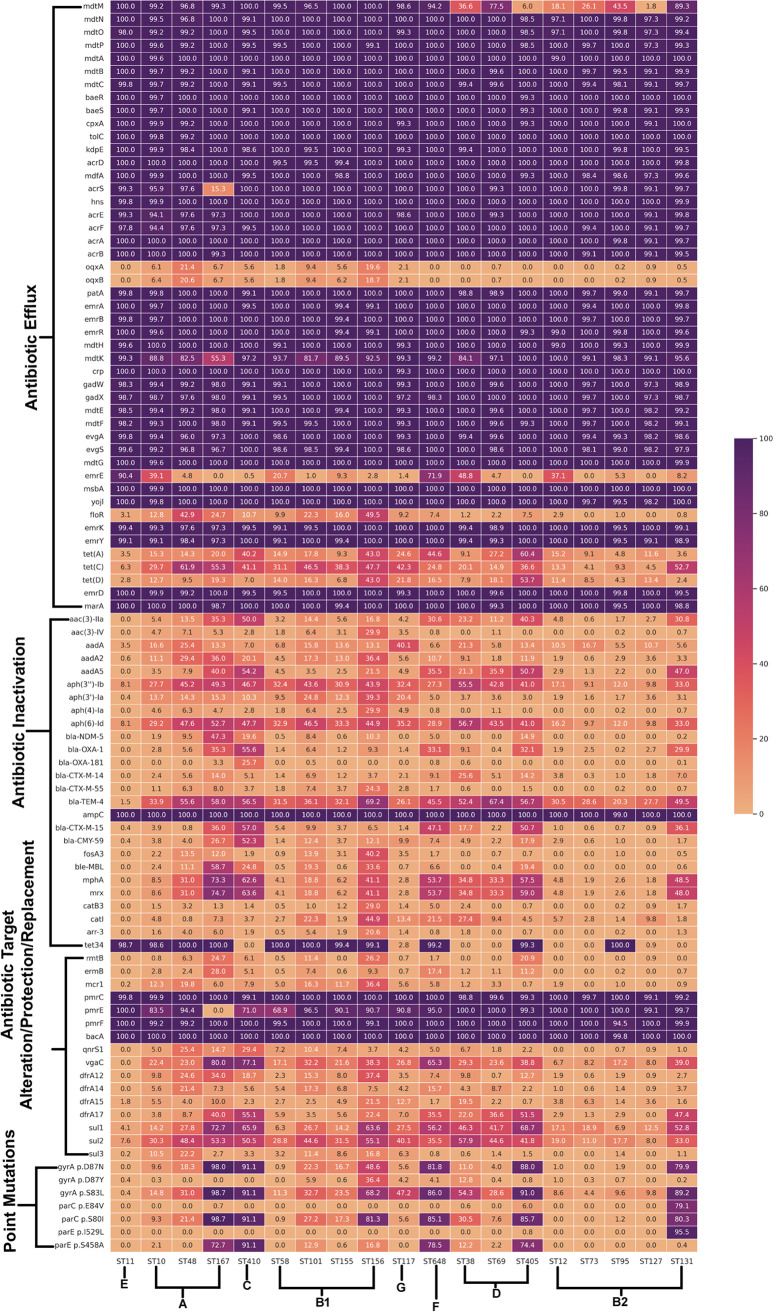
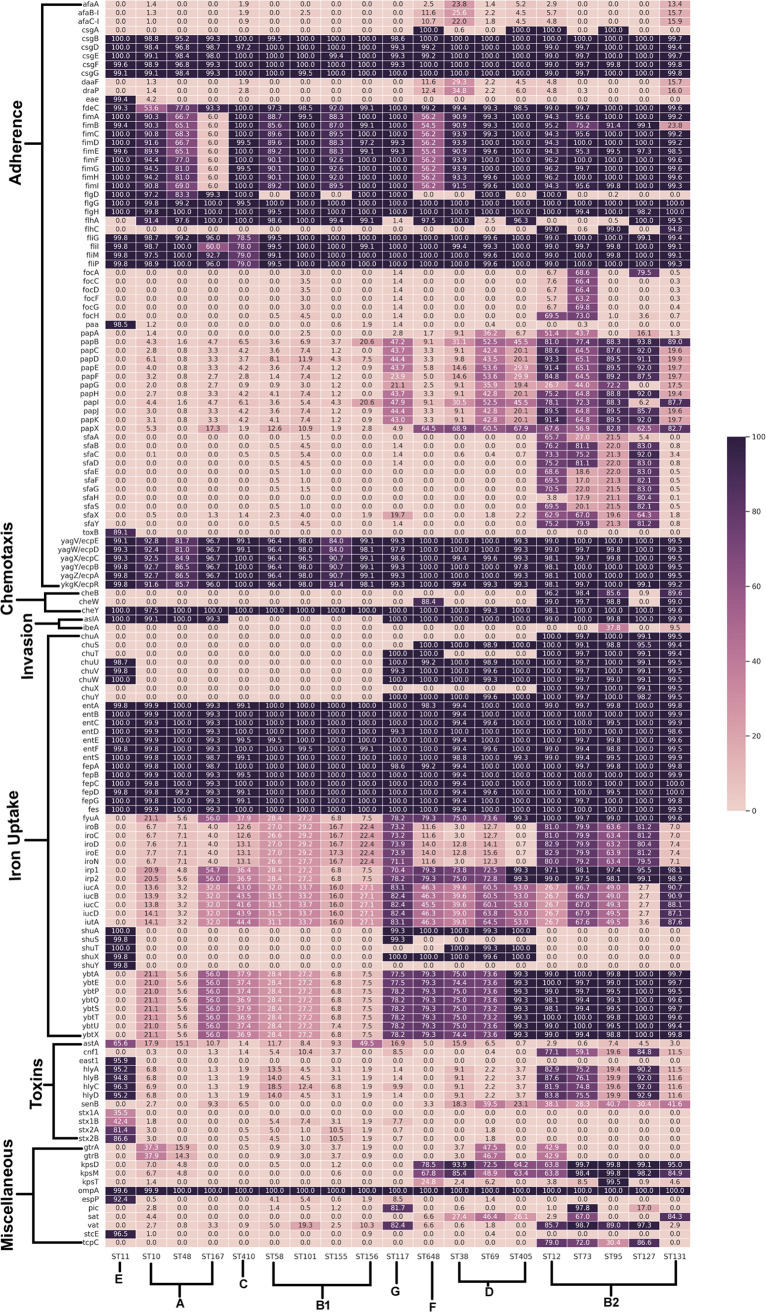
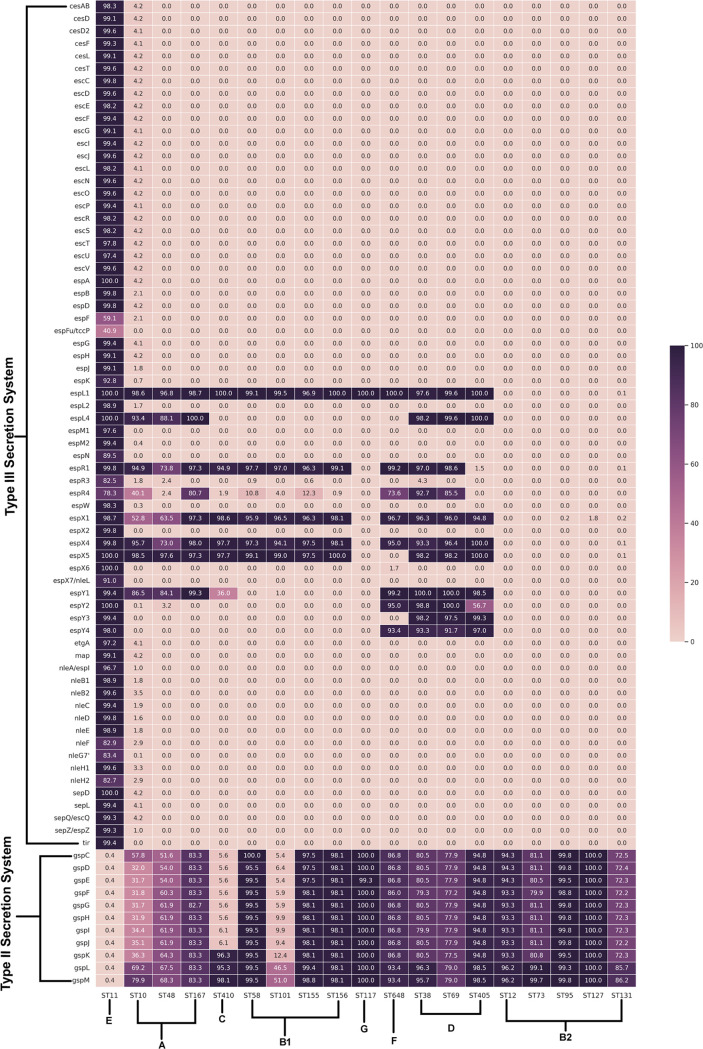
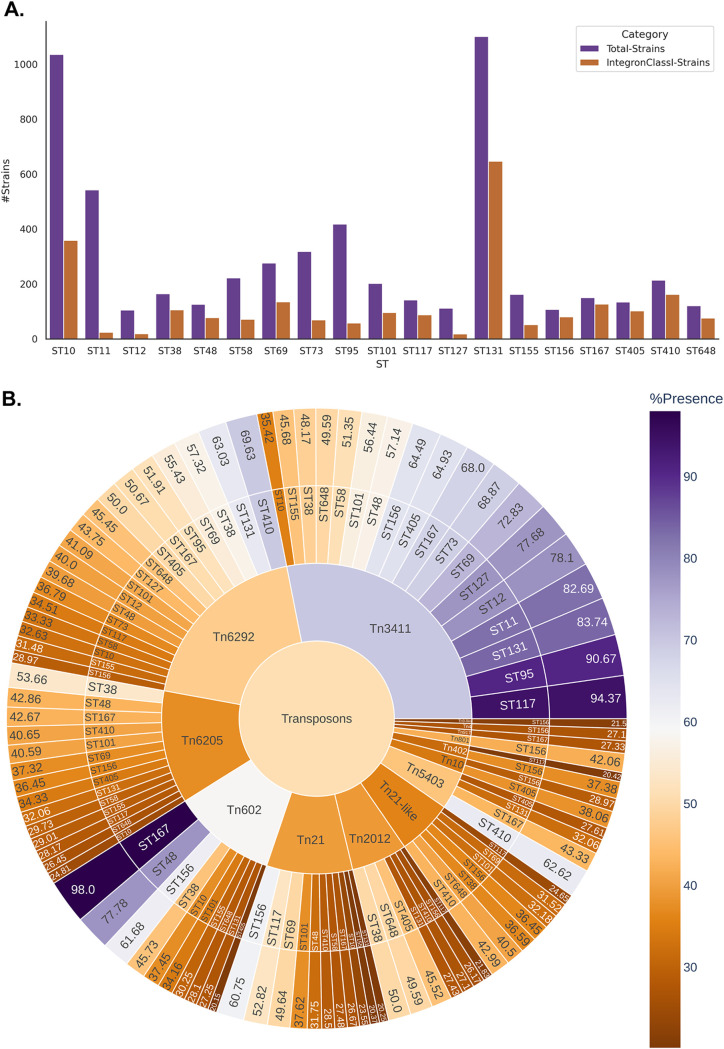
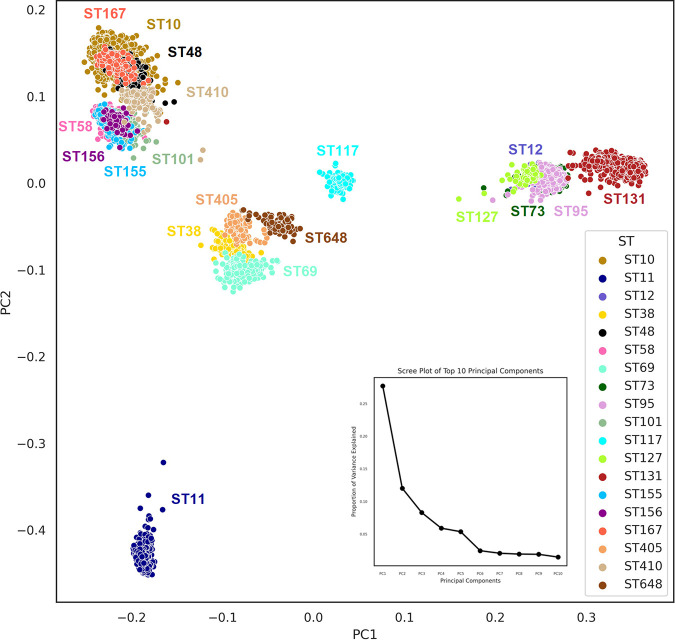
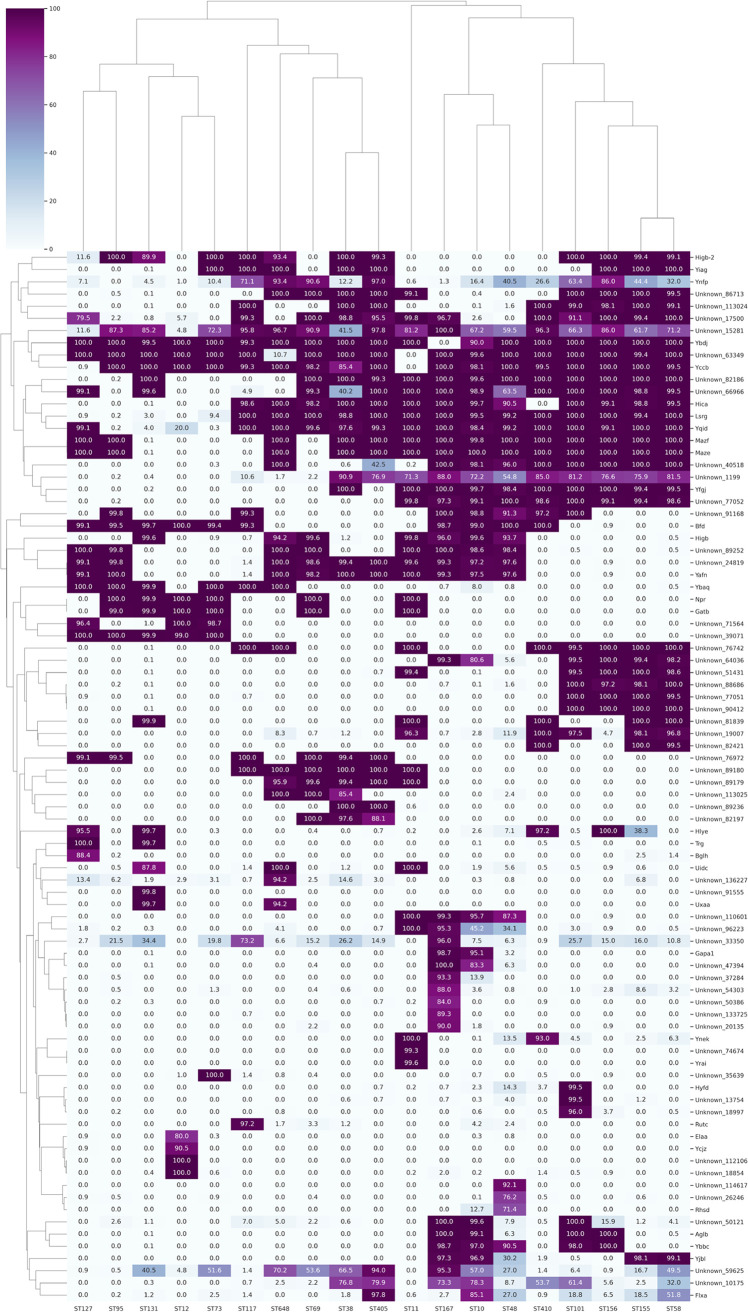
Escherichia coli, a ubiquitous commensal/pathogenic member from the Enterobacteriaceae family, accounts for high infection burden, morbidity, and mortality throughout the world. With emerging multidrug resistance (MDR) on a massive scale, E. coli has been listed as one of the Global Antimicrobial Resistance and Use Surveillance System (GLASS) priority pathogens. Understanding the resistance mechanisms and underlying genomic features appears to be of utmost importance to tackle further spread of these multidrug-resistant superbugs. While a few of the globally prevalent sequence types (STs) of E. coli, such as ST131, ST69, ST405, and ST648, have been previously reported to be highly virulent and harboring MDR, there is no clarity if certain ST lineages have a greater propensity to acquire MDR. In this study, large-scale comparative genomics of a total of 5,653 E. coli genomes from 19 ST lineages revealed ST-wide prevalence patterns of genomic features, such as antimicrobial resistance (AMR)-encoding genes/mutations, virulence genes, integrons, and transposons. Interpretation of the importance of these features using a Random Forest Classifier trained with 11,988 genomic features from whole-genome sequence data identified ST-specific or phylogroup-specific signature proteins mostly belonging to different protein superfamilies, including the toxin-antitoxin systems. Our study provides a comprehensive understanding of a myriad of genomic features, ST-specific proteins, and resistance mechanisms entailing different lineages of E. coli at the level of genomes; this could be of significant downstream importance in understanding the mechanisms of AMR, in clinical discovery, in epidemiology, and in devising control strategies. IMPORTANCE With the leap in whole-genome data being generated, the application of relevant methods to mine biologically significant information from microbial genomes is of utmost importance to public health genomics. Machine-learning methods have been used not only to mine, curate, or classify the data but also to identify the relevant features that could be linked to a particular class/target. This is perhaps one of the pioneering studies that has attempted to classify a large repertoire of E. coli genome data sets (5,653 genomes) belonging to 19 different STs (including well-studied as well as understudied STs) using machine learning approaches. Important features identified by these approaches have revealed ST-specific signature proteins, which could be further studied to predict possible associations with the phenotypic profiles, thereby providing a better understanding of virulence and the resistance mechanisms among different clonal lineages of E. coli.
Keywords: AMR surveillance; Escherichia coli; bacterial evolution; bioinformatics; genomics; machine learning; molecular epidemiology; sequence types; virulence.
Conflict of interest statement
The authors declare no conflict of interest.
Figures
References
MeSH terms
Substances
LinkOut - more resources
Full Text Sources
Medical
