. 2022 Feb 14;23(1):71.
doi: 10.1186/s12859-022-04601-5.

Degeneracy measures in biologically plausible random Boolean networks

Affiliations

Degeneracy measures in biologically plausible random Boolean networks

Basak Kocaoglu et al. BMC Bioinformatics. .

Abstract

Background: Degeneracy-the ability of structurally different elements to perform similar functions-is a property of many biological systems. Highly degenerate systems show resilience to perturbations and damage because the system can compensate for compromised function due to reconfiguration of the underlying network dynamics. Degeneracy thus suggests how biological systems can thrive despite changes to internal and external demands. Although degeneracy is a feature of network topologies and seems to be implicated in a wide variety of biological processes, research on degeneracy in biological networks is mostly limited to weighted networks. In this study, we test an information theoretic definition of degeneracy on random Boolean networks, frequently used to model gene regulatory networks. Random Boolean networks are discrete dynamical systems with binary connectivity and thus, these networks are well-suited for tracing information flow and the causal effects. By generating networks with random binary wiring diagrams, we test the effects of systematic lesioning of connections and perturbations of the network nodes on the degeneracy measure.

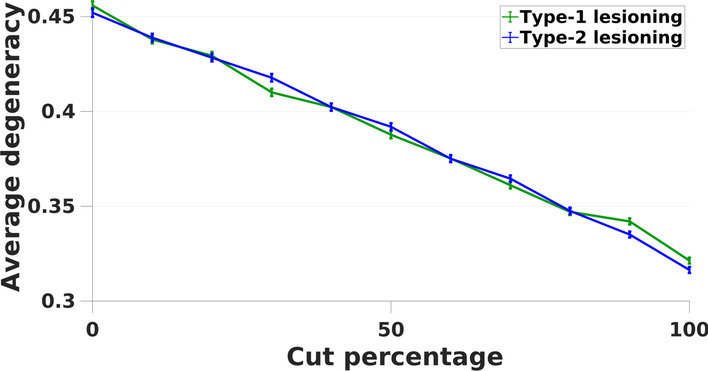
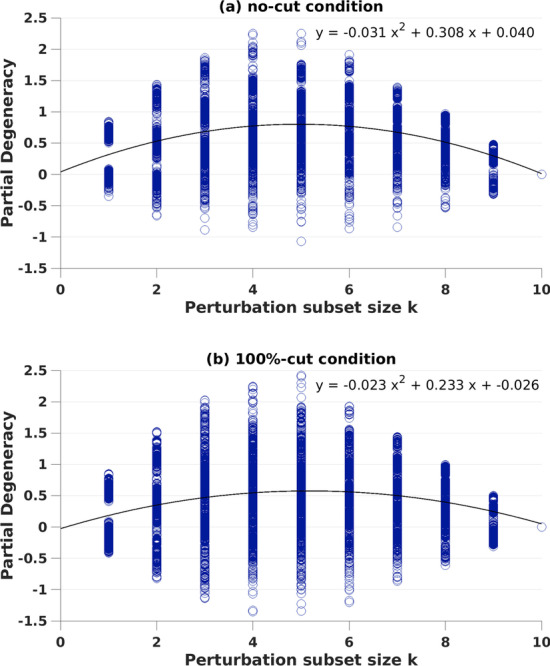
Results: Our analysis shows that degeneracy, on average, is the highest in networks in which ~ 20% of the connections are lesioned while 50% of the nodes are perturbed. Moreover, our results for the networks with no lesions and the fully-lesioned networks are comparable to the degeneracy measures from weighted networks, thus we show that the degeneracy measure is applicable to different networks.

Conclusions: Such a generalized applicability implies that degeneracy measures may be a useful tool for investigating a wide range of biological networks and, therefore, can be used to make predictions about the variety of systems' ability to recover function.


Conflict of interest statement

The authors declare no competing interests.

Figures

Fig. 1
Fig. 1
Average degeneracy for type-1 (green line) and type-2 (blue line) lesioning in classical RBNs (a). Degeneracy, (grey area) is computed as the average MI between subsets of X and O under perturbation over increasing perturbed subset size k, in networks with b no lesions and with c 100%-cut condition. In panel a, on the x axis, the cut percentage represents the affected number of nodes (in total of 10 nodes) whose edges are lesioned given the networks. As cuts becomes larger, degeneracy increases. In panels b and c, degeneracy is calculated according to definition given in “Methods” Eq. 3
Fig. 2
Fig. 2
Average degeneracy values compared between type-1 (green line) and type-2 (blue line) lesioning in RBNs with varying unit activity. On the x axis, the cut percentage represents the affected number of nodes (in total of 10 nodes) whose edges are lesioned given the networks. For both lesioning types, degeneracy was lowest in the 100% cut condition where edges of all nodes (10) were cut
Fig. 3
Fig. 3
Degeneracy, (grey area) is computed (see Eq. 3 in “Methods”) as the average MI between subsets of X and O under perturbation over increasing perturbed subset size k, in networks with a, c no lesions and with b, d 100%-cut condition
Fig. 4
Fig. 4
Partial degeneracy values from individual networks for each perturbed subset size k. Data from 10 (k) × 1000 simulations of networks with a no-cut condition and b 100%-cut condition
Fig. 5
Fig. 5
Average degeneracy computed as a function of perturbation subset size k in type-1 lesioning (a) and type-2 lesioning (b). Each line represents the cut condition for lesioned edges given the percentage of number of nodes in networks
Fig. 6
Fig. 6
Panel for cBNs with type-1 and type-2 lesioning (b). In a, average degeneracy values compared between type-1 (green line) and type-2 (blue line) lesioning. Degeneracy, (grey area) is computed (see Eq. 3 in “Methods”) as the average MI between subsets of X and O under perturbation over increasing perturbed subset size k, in networks with b, d no lesions and with c, e 100%-cut condition. Panels f, g show partial degeneracy values from individual networks for each perturbed subset size k. The distribution of partial degeneracy values for g shows clear modes in the data where there is an overlap of the perturbed subset and output sheet. Average degeneracy computed as a function of perturbation subset size k in type-1 lesioning (h) and type-2 lesioning (i)
Fig. 7
Fig. 7
Illustration of RBNs under perturbation. A network of X, composed of nodes (light and dark blue circles, n = 10) that are interconnected. Arrows represent the edges for incoming and outgoing. Light blue circles represent randomly chosen perturbation subsets of nodes for k = 2 (a) and k = 7 (b). Perturbation (represented as syringes) of the nodes in boxes with k notation, is injected as a variance (uncorrelated noise). The box with O notation represents output sheet that is also consisted of randomly chosen set of (n/2 = 5) nodes (dark blue circles). For each network, MI is calculated for perturbed set size k and the output sheet O, for all subset sizes of perturbed set noted as j

References

    1. Forman-Kay JD, Mittag T. From sequence and forces to structure, function, and evolution of intrinsically disordered proteins. Structure. 2013;21(9):1492–1499. - PMC - PubMed
    1. Sadowski MI, Jones DT. The sequence–structure relationship and protein function prediction. Curr Opin Struct Biol. 2009;19(3):357–362. - PubMed
    1. Pal D, Eisenberg D. Inference of protein function from protein structure. Structure. 2005;13(1):121–130. - PubMed
    1. Hvidsten TR, Lægreid A, Kryshtafovych A, Andersson G, Fidelis K, Komorowski J. A comprehensive analysis of the structure-function relationship in proteins based on local structure similarity. PLoS ONE. 2009;4(7):e6266. - PMC - PubMed
    1. Hartwell LH, Hopfield JJ, Leibler S, Murray AW. From molecular to modular cell biology. Nature. 1999;402(6761):C47–52. - PubMed

MeSH terms

LinkOut - more resources