. 2022 Feb 14;20(1):79.
doi: 10.1186/s12951-022-01280-5.

Extracellular microparticles derived from hepatic progenitor cells deliver a death signal to hepatoma-initiating cells

Affiliations

Extracellular microparticles derived from hepatic progenitor cells deliver a death signal to hepatoma-initiating cells

Xiaojuan Hou et al. J Nanobiotechnology. .

Abstract

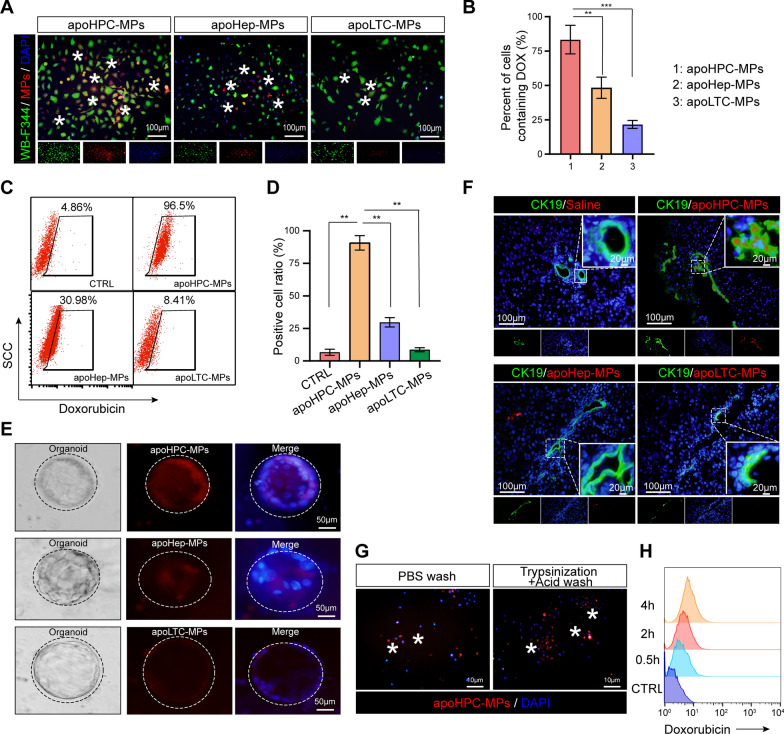
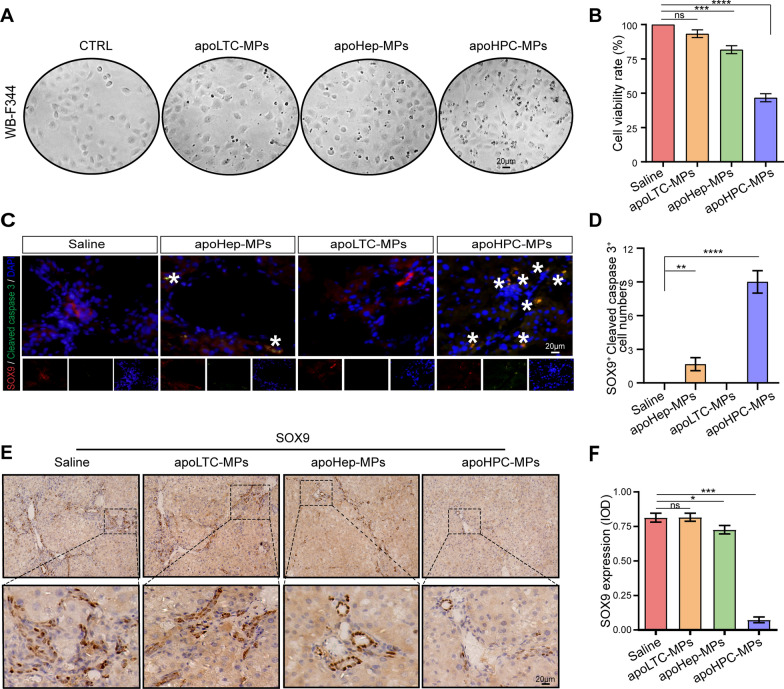
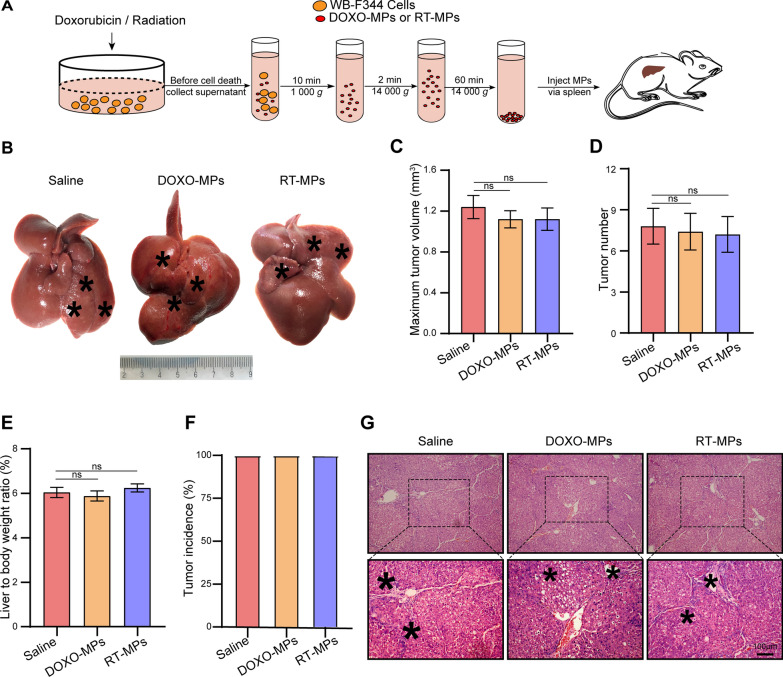
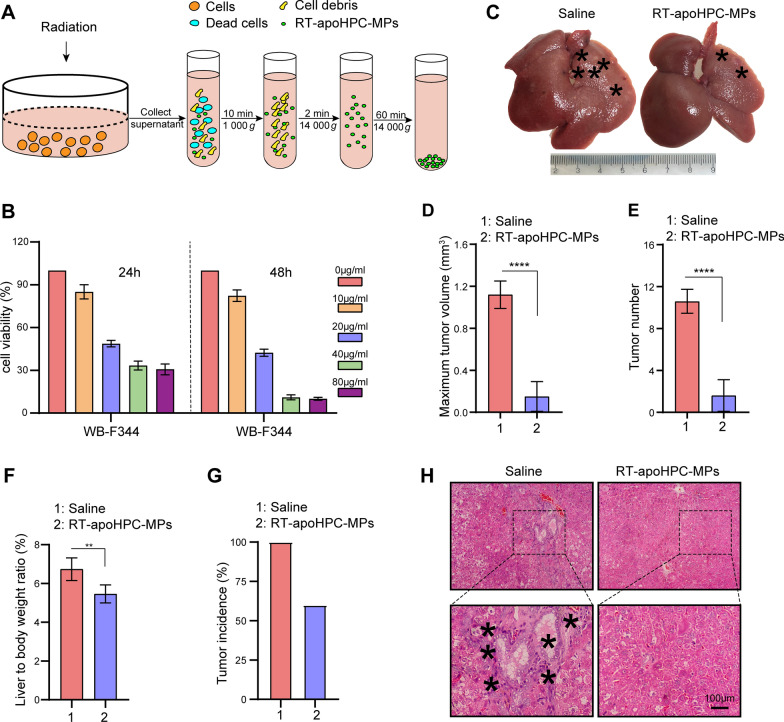
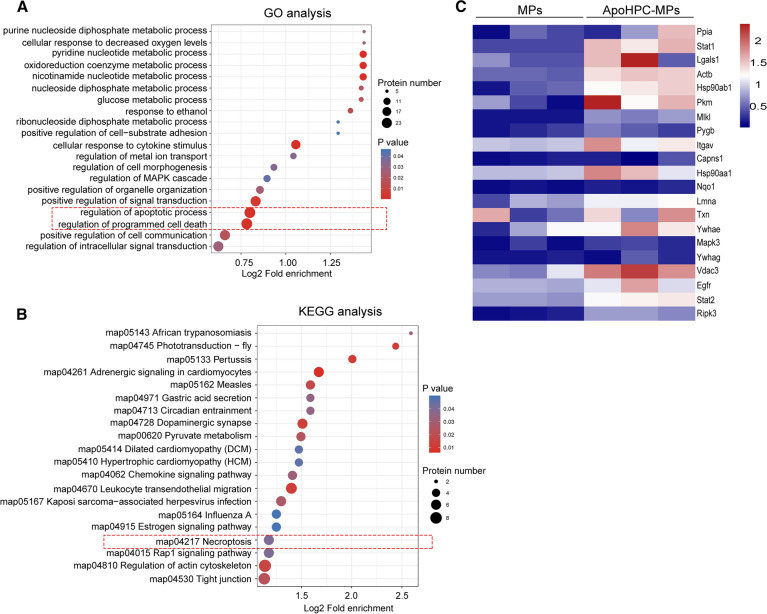
The malignant transformation of normal resident hepatic stem/progenitor cells has a critical role in hepatocarcinogenesis and the recurrence of hepatocellular carcinoma (HCC). We defined such hepatic progenitor cells as hepatoma-initiating cells. An efficient strategy is required to target and kill the hepatoma-initiating cells. We isolated extracellular microparticles (MPs) derived from apoptotic hepatic progenitor cells (HPCs) and tested their ability to inhibit hepatocarcinogenesis. Extracellular MPs were isolated from HPCs, hepatocytes and liver tumor cells. Their effects on tumor growth were investigated in rat primary HCC models, in which hepatocarcinogenesis is induced by diethylnitrosamine (DEN). The extracellular MPs derived from apoptotic HPCs, apoptotic hepatocytes and apoptotic liver tumor cells were similar in morphology, diameter and zeta potential. However, they had different antitumor effects. In DEN-exposed rats, only the MPs derived from apoptotic HPCs effectively inhibit hepatocarcinogenesis. In vitro and in vivo analyses confirmed that HPCs preferentially take up MPs derived from apoptotic HPCs compared to MPs from other liver cell types. Proteomic analysis of MPs from apoptotic HPCs showed enrichment of proteins involved in cell death pathways. Thus, HPC-derived MPs contain a death signal to induce the killing of hepatoma-initiating cells. Our findings provide evidence that a death signal encapsulated in HPC-derived extracellular microparticles can efficiently clear hepatoma-initiating cells and prevent hepatocarcinogenesis.

Keywords: Death signal; Extracellular microparticles; Hepatic progenitor cells; Hepatocarcinogenesis; Hepatoma-initiating cells.


Conflict of interest statement

The authors declare that they have no competing interests.

Figures

Fig. 1
Fig. 1
MPS derived from apoptotic HPCs prevent hepatocarcinogenesis in a primary rat HCC model. Diagram of the treatment schedule in the rat HCC model. After 6 weeks of oral treatment with diethylnitrosamine (DEN), Sprague Dawley rats were intrasplenically injected with 40 µg of apoHPC-MPs, apoLTC-MPs or apoHep-MPs in 200 µl saline or 200 µl of blank saline. Injections were administered twice every week for 7 weeks. Oral DEN treatment was also continued during this time. After 13 weeks, the rats were sacrificed to observe the development of hepatocellular carcinoma (HCC). B Representative images of rat livers from the indicated groups. Typical tumor nodes are marked by the asterisks. C The maximum tumor volume per liver in the different groups. ****p < 0.0001. D The liver-to-body weight ratio in the different treatment groups. **p < 0.01. E The number of HCC nodules per liver in each group. *p < 0.05, ****p < 0.0001. F The tumor incidence in each group. G Images of H&E-stained liver sections showing the histological structure and inflammatory response in the indicated groups. Black asterisks represent accumulation of inflammatory cells. (H) Body weight curves. The rats were weighed every other week (n = 5 per group). ****p < 0.0001 compared to saline group. (I) Serological analysis of creatine kinase (CK) was performed after the rats were sacrificed. Data are presented as mean ± SD. ns, not statistically significant
Fig. 2
Fig. 2
MPs derived from apoptotic primary HPCs prevent hepatocarcinogenesis. A Experimental outline for producing organoid-apoMPs. Rats were treated with DEN for 6 weeks. Livers were removed, cut into small pieces, and digested with 0.1% collagenase IV. Primary HPCs were then isolated and cultured to form organoids. 100 µg/ml of doxorubicin was used to treat the organoids and organoid-apoMPs were then isolated. B After 6 weeks of DEN treatment, Sprague Dawley rats were intrasplenically injected with 40 µg of organoid-apoMPs in 200 µl saline or 200 µl of blank saline. Injections were given twice every week for 7 weeks. DEN treatment was also continued during this time. After 13 weeks, the rats were sacrificed to observe the development of HCC. Representative images of livers are shown. Typical tumor nodes are indicated by the asterisks. C The maximum tumor volume per liver in the two groups. Data are presented as mean ± SD. ****p < 0.0001. D The number of HCC nodules per liver. Data are presented as mean ± SD. ****p < 0.0001. E The liver-to-body weight ratio. Data are presented as mean ± SD. ****p < 0.0001. F The tumor incidence in the two groups. G Images of H&E-stained liver sections, showing the histological structure and inflammatory response of the liver in the indicated groups. Black asterisks represent accumulation of inflammatory cells
Fig. 3
Fig. 3
HPCs take up more apoHPC-MPs than apoLTC-MPs or apoHep-MPs. A, B WB-F344 cell (5 × 103) were labeled with GFP (green fluorescence), incubated for 30 min with 1 × 105 apoHPC-MPs, apoLTC-MPs or apoHep-MPs containing DOX (red fluorescence). The uptake of MPs into WB-F344 cells was observed by fluorescence microscopy. Representative images are shown in A. The percentage of WB-F344 cells with red fluorescence (indicating uptake of MPs) was calculated in each group. The combined data from three experiments are shown in B. Data are presented as mean ± SD. **p < 0.01, ***p < 0.001. C, D 1 × 106 ApoHPC-MPs, apoLTC-MPs and apoHep-MPs containing doxorubicin (red fluorescence) were incubated with WB-F344 cells (3 × 105) for 30 min. The percentage of WB-F344 cells containing red fluorescence was measured by flow cytometry. Representative flow cytometry data are shown in C. The combined data from three experiments are shown in (D). Data are presented as mean ± SD. **p < 0.01. E Liver organoids were cultured in vitro. 1 × 104 apoHPC-MPs, apoLTC-MPs or apoHep-MPs were incubated with liver organoids for 30 min. The uptake of MPs into organoids was observed by fluorescence microscopy. Representative images are shown. Nuclei were stained with DAPI (blue). F 1 × 107 apoHPC-MPs, apoHep-MPs or apoLTC-MPs were intrasplenically injected into DEN-treated rats. 30 min after injection, liver slices were acquired for fluorescence detection. HPCs were recognized by antibodies against CK19 (green). Nuclei were stained with DAPI (blue). HPCs efficiently took up red fluorescent apoHPC-MPs. G WB-F344 cells (3 × 105) were incubated with apoHPC-MPs (1 × 105) for 30 min. Then WB-F344 cells were treated with 0.2 × trypsin/EDTA buffer for 1 min and then washed with citric acid buffer several times to remove all non-internalized apoHPC-MPs bound to the surface of WB-F344 cells. Nuclei were stained with DAPI (blue). H 3 × 105 WB-F344 cells were incubated with 2 × 105 apoHPC-MPs for 0.5, 2, and 4 h. After washing, the samples were subjected to flow cytometric analysis. A representative image is shown here
Fig. 4
Fig. 4
ApoHPC-MPs are cytotoxic to HPCs. A The same amount (20 µg) of apoLTC-MPs, apoHep-MPs or apoHPC-MPs was incubated with cultured WB-F344 cells (5 × 103) for 24 h. The killing of WB-F344 cells was observed by microscopy. B WB-F344 cells were treated with 20 µg of apoHPC-MPs, apoHep-MPs or apoLTC-MPs for 1 h. The cells were washed and cultured in fresh medium for 24 h. Cell proliferation was detected by CCK8 assay. Data were collected from three independent experiments. Data are presented as mean ± SD. ***p < 0.001, ****p < 0.0001. C 40 µg of apoHPC-MPs, apoHep-MPs or apoLTC-MPs were intrasplenically injected into rats, which were treated with DEN for the previous 6 weeks. 24 h after injection, liver slices were acquired for fluorescence detection. HPCs were stained with antibodies against SOX9 (red) and cleaved caspase 3 (green) for fluorescence microscopy analysis. Nuclei were stained with DAPI (blue). Representative pictures of staining are shown. White asterisks show the SOX9-positive HPCs which are also positive for cleaved caspase 3. D Cells positive for both SOX9 and cleaved caspase 3 were counted in each field of view in C; the combined data from three experiments are shown. **p < 0.01, ****p < 0.0001 E 40 µg of apoHPC-MPs, apoHep-MPs or apoLTC-MPs were intrasplenically injected into rats, which were treated with DEN for the previous 6 weeks. Injections were administered twice every week for 4 weeks. Rats were then sacrificed, and liver tissue sections were acquired for IHC assay. The HPCs were stained with an antibody against SOX9. Representative photographs are shown. In the apoHPC-MP-treated liver, SOX9 staining is faint and very scarce. The apoHep-MP-treated liver shows a moderate level of SOX9 staining. The other livers show strong and diffuse staining. F Computer-assisted IOD evaluation of SOX9 staining in E. Data were collected from three independent experiments. Data are presented as mean ± SD. *p < 0.05, ***p < 0.001
Fig. 5
Fig. 5
HPC-derived MPs without death signals have no effect on hepatocarcinogenesis. A Experimental outline for producing MPs without apoptotic signals (DOXO-MPs and RT-MPs). WB-F344 cells were treated with 100 µg/ml doxorubicin or 20 Gy radiation. DOXO-MPs and RT-MPs were isolated before the cells underwent apoptosis. BF Sprague Dawley rats, which were treated with DEN for 6 weeks, were intrasplenically injected with 40 µg of DOXO-MPs and RT-MPs. Injections were administered twice every week for 7 weeks. DEN treatment was also continued during this time. After 13 weeks, the rats were sacrificed to observe the development of hepatocellular carcinoma (HCC). Representative images of rat livers are shown. Typical tumor nodes are marked by the asterisks (B). The maximum tumor volume per liver in the indicated groups (C). The number of HCC nodules per liver (D). The liver-to-body weight ratio (E). The tumor incidence in the different treatment groups (F). G Images of H&E-stained liver sections showing the histological structure and inflammatory response after the indicated treatments. Black asterisks indicate accumulation of inflammatory cells
Fig. 6
Fig. 6
HPC-derived MPs carrying the death signal inhibit hepatocarcinogenesis in the absence of doxorubicin. A Experimental outline for producing RT-apoHPC-MPs. WB-F344 cells were treated with 20 Gy of radiation and RT-apoHPC-MPs were isolated after apoptosis of the cells. B WB-F344 cells were treated with various concentrations of RT-apoHPC-MPs for 24 or 48 h, and cell viability was detected using the CCK-8 assay. CG Rats were treated with DEN for 6 weeks, then intrasplenically injected with RT-apoHPC-MPs (40 µg). Injections were administered twice every week for 7 weeks. DEN was administered orally in parallel. After 13 weeks, the rats were sacrificed to observe the development of HCC. Representative images of rat livers are shown. Typical tumor nodes are marked by the asterisks (C). The maximum tumor volume per liver in the two groups (D). The number of HCC nodules per liver (E). The liver-to-body weight ratio in the two groups (F). The tumor incidence in the two groups (G). Data are presented as mean ± SD. **p  < 0.01, ****p < 0.0001. H Images of H&E-stained liver sections showing the histological structure and inflammatory response of liver in the two groups. Black asterisks indicate accumulation of inflammatory cells
Fig. 7
Fig. 7
Quantitative proteomic analysis of extracellular microparticles reveals enrichment of death related proteins in apoHPC-MPs. A Differentially expressed (up-regulated) proteins between apoHPC-MPs and MPs were classified by GO annotation based on the following category: biological process. The bubble chart shows the top 20 categories with the most significant enrichment. The vertical axis shows the function classification. The x-axis indicates Log2 of the ratio of the number of differential proteins in the corresponding function classification to the number of total proteins identified. The colors of the points represent the P values of enrichment significance. The sizes of the dots represent the numbers of differential proteins in the corresponding function classification. B Annotation of differentially expressed (up-regulated) proteins between apoHPC-MPs and MPs based on the KEGG pathway database. The bubble chart shows the top 20 categories with the most significant enrichment. The vertical axis shows the functional pathway. The x-axis indicates Log2 of the ratio of the number of differential proteins in the corresponding pathway to the number of total proteins identified. The colors of the points represent the P values of enrichment significance. The sizes of the dots represent the numbers of differential proteins in the corresponding pathway. C Based on the MS results, heat map of the up-regulated gene encoding death-related proteins in apoHPC-MPs compared to MPs

Similar articles

References

    1. Nio K, Yamashita T, Kaneko S. The evolving concept of liver cancer stem cells. Mol Cancer. 2017;16(1):4. - PMC - PubMed
    1. Yang JD, Hainaut P, Gores GJ, Amadou A, Plymoth A, Roberts LR. A global view of hepatocellular carcinoma: trends, risk, prevention and management. Nat Rev Gastroenterol Hepatol. 2019;16(10):589–604. - PMC - PubMed
    1. Refolo MG, Messa C, Guerra V, Carr BI, D’Alessandro R. Inflammatory mechanisms of HCC development. Cancers. 2020;12(3):641. - PMC - PubMed
    1. Sun Q, Zhang Z, Lu Y, Liu Q, Xu X, Xu J, et al. Loss of xanthine oxidoreductase potentiates propagation of hepatocellular carcinoma stem cells. Hepatology. 2020;71(6):2033–49. - PubMed
    1. Forner A, Llovet JM, Bruix J. Hepatocellular carcinoma. Lancet. 2012;379(9822):1245–55. - PubMed