

doi: 10.1186/s12943-022-01523-x.
Targeted next-generation sequencing of circulating free DNA enables non-invasive tumor detection in myxoid liposarcomas
Affiliations
- PMID: 35164780
- PMCID: PMC8842903
- DOI: 10.1186/s12943-022-01523-x
Item in Clipboard
Targeted next-generation sequencing of circulating free DNA enables non-invasive tumor detection in myxoid liposarcomas
Mol Cancer.
.
No abstract available
Keywords: Circulating tumor DNA; Diagnostic biomarker, Intratumor heterogeneity; Liquid biopsy; Myxoid liposarcoma; Next-generation sequencing; Soft tissue sarcoma; Targeted sequencing; ctDNA.
Conflict of interest statement
The authors declare that they have no competing interests.
Figures
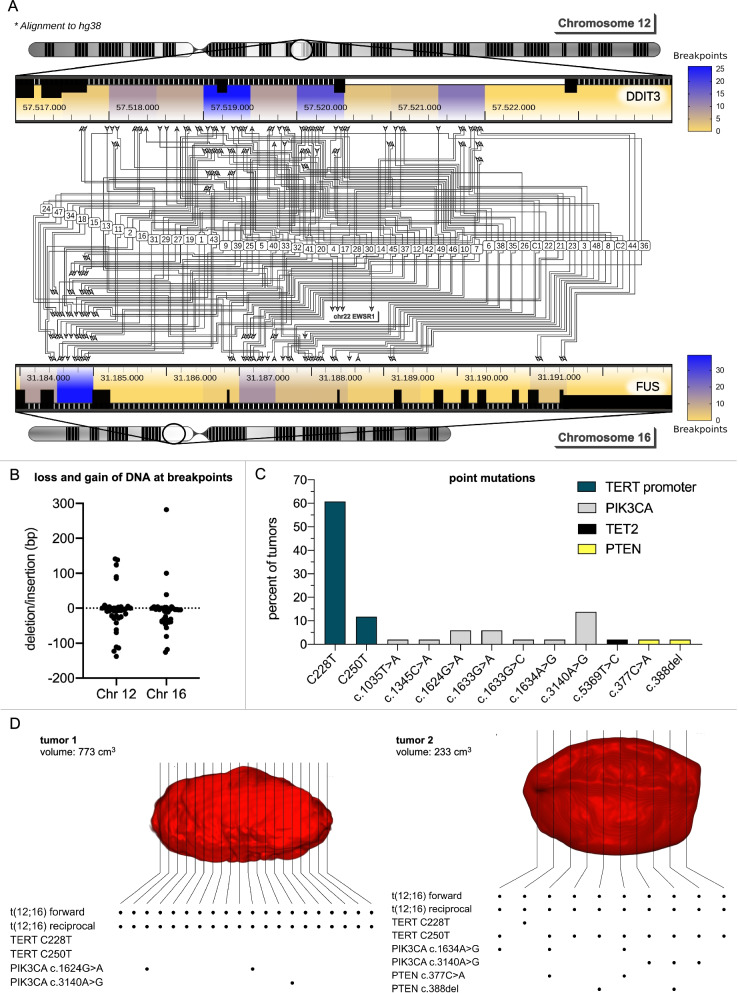
Mutational profiling of myxoid liposarcomas. A 51 MLS tumors and two MLS cell lines (402-91 and 1765-92) were sequenced with an MLS specific lockdown panel. Chromosomal translocations could be detected in 49/51 tumors (1 - 49) and both cell lines (C1, C2) and occurred between DDIT3 and FUS in 87.7% and between DDIT3 and EWSR1 in 8.3%. Breakpoints clustered to several distinct regions within DDIT3 and FUS but were not restricted to a single site. For 36 tumors, both breakpoints of the reciprocal translocation could be determined. Arrows depict the sites where the chromosomal breaks occurred. Areas with an increased likelihood of chromosomal breaks are colored in blue. Breakpoints were annotated to homo sapiens (human) genome assembly GRCh38 (hg38). B For 36 tumors, where both breakpoints could be sequenced, loss or gain of DNA during the translocation event could be determined and specifically mapped to either DDIT3 or FUS. A mean loss of 7 bp (SD 64 bp) occurred on chromosome 12 (DDIT3) and of 11 bp (SD 73 bp) on chromosome 16 (FUS). There was considerable intertumor variability. Each symbol of the graph represents one tumor, with the largest gain of 282 bp on chromosome 16 and the biggest deletion of 138 bp on chromosome 12. C Point mutations occurred most commonly in the TERT promoter region (73%) and PIK3CA (33%). Only one tumor showed an additional point mutation in TET2 and one tumor analyzed for intratumor heterogeneity (tumor 2 in Fig. 1 D) displayed two mutations in PTEN. TERT promoter mutations were all detected at the well-known hotspot locations C228T and C250T, with a prevalence of 61% and 12% of all analyzed tumors respectively. PIK3CA mutations occurred at well-known hotspot mutations in exon 9 (c.1624G > A, c.1633G > A, c.1633G > C, c1634A > G) and exon 20 (c.3140A > G) but also at less commonly annotated positions in exon 5 (c.1035 T > A) and exon 8 (c. 1345C > A). D To determine intratumor heterogeneity of MLS, 20 individual samples of tumor 1 were taken at uniform distances and 10 samples were taken from tumor 2. Each sample was analyzed separately with the standard panel. The individual tumor-specific breakpoints identified before (Fig. 1 A) were detectable in all samples. There were no TERT promoter mutations in tumor 1, however PIK3CA mutations were present in 3/20 samples. Two showed a hotspot mutation in exon 9 (chr3:179,218,294; c.1624G > A) and one samples had a hotspot mutation in exon 20 (chr3:179,234,297; c.3140A > G). In tumor 2, TERT promoter mutations were present in all samples, however nine samples contained the C250T and one sample the C228T mutations. PIK3CA mutations were even more diverse. 6/10 samples contained a PIK3CA mutation. Of these samples three showed the well-known hotspot mutation in exon 9 (chr3:179,218,304; c.1634A > G) and the remaining three the hotspot mutation in exon 20 (chr3:179,234,297; c.3140A > G). A deletion (c.388del) and a point mutation in (c.377C > A) were identified in PTEN. The intratumor heterogeneity of PIK3CA, PTEN and the TERT promoter point towards multiple subclones which emerge from a tumor ancestor that initially acquired the characteristic t (12;16) driver translocation. Depicted is the tumor (red), which was reconstructed from the patients’ MRI scans. The black lines depict how the tumor was sectioned for histopathologic assessment. Although the samples were taken at uniform distances throughout the tumor, the exact location of each sample within the tumor cannot be determined due to the retrospective nature of the study
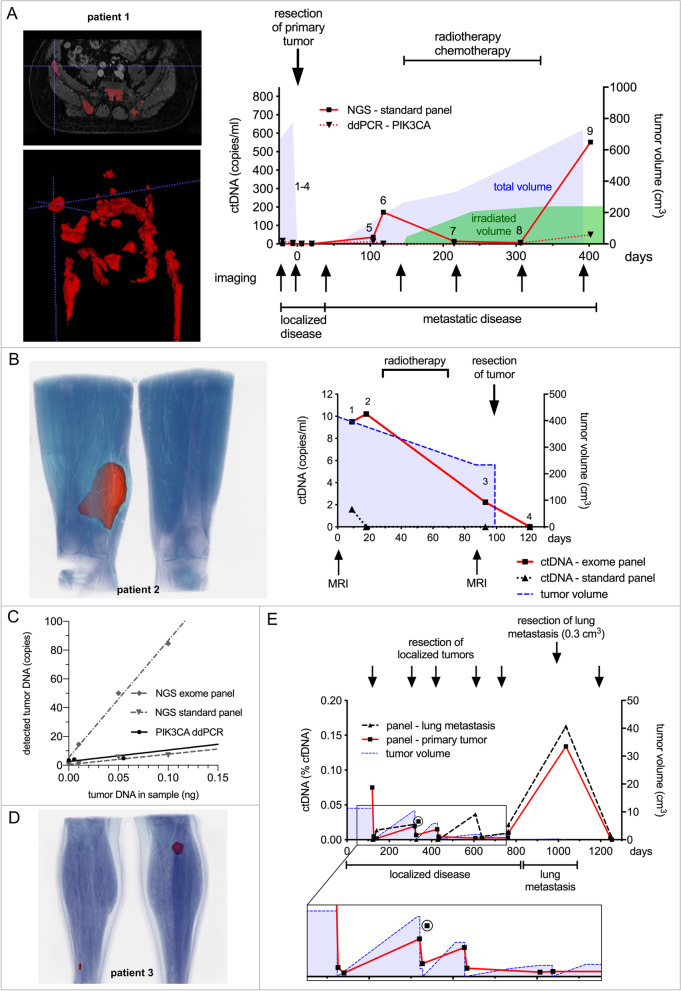
Quantification of ctDNA in patients’ plasma samples. A Quantification of ctDNA in 9 plasma samples of patient 1 collected during 2 years of treatment. ctDNA was determined by NGS (standard panel) and PIK3CA mutations (c.1624G > A and c.3140A > G) were additionally quantified by ddPCR. He initially presented with a localized MLS of the thigh which was completely resected. Soon after, he developed metastatic disease with predominantly osseous lesions. He then received radiotherapy of bone metastasis and several courses of chemotherapy. Repeated imaging during follow-up showed numerous new skeletal lesions and the patient again received radiotherapy to selected metastasis. He succumbed to his disease 1.5 years after removal of the primary tumor. ctDNA increased to 172 copies/ml (sample 6) when metastatic disease was detected and decreased during radio/chemotherapy to 14 copies/ml (sample 7) and 7 copies/ml (sample 8). There was a rapid incline in ctDNA when multiple new metastases were detected (sample 9: 552 copies/ml). Standard imaging, which reflects the total mass of viable and necrotic tumor cells, showed a steady increase (blue area). The irradiated tumor volume is depicted as a surrogate marker for the necrotic tumor mass (green area). t (12;16) ctDNA levels were higher than PIK3CA ctDNA concentrations. This most likely reflect intertumor heterogeneity with only a fraction of metastases carrying PIK3CA mutations (Fig. 1 D and Supplementary Fig. 4). B Additional target mutations from exome sequencing increase sensitivity of ctDNA detection. Tumor 2 was subjected to exome sequencing to identify additional target mutations. Together with breakpoints and mutations from the standard panel, a 7320 bp hybrid exome panel targeting 15 genomic regions was designed. ctDNA in plasma obtained during treatment was determined by the standard and exome panel. He initially received neo-adjuvant radiotherapy to an MLS of his right thigh and subsequently the tumor was completely resected. Two plasma samples were collected prior to commencement of radiotherapy, a third sample before surgery and a fourth sample after tumor resection. ctDNA quantified by the exome panel (red line) was present in similar amounts at the two time points before treatment, declined after radiotherapy and was not detectable after tumor resection. The standard panel (dashed black line) could detect ctDNA only in the first sample, showing reduced sensitivity compared to the exome panel. The blue area represents the tumor volume as calculated from the MRI scans. C Comparison of different assays in detecting MLS tumor-DNA. Dilution series of MLS tumor-DNA from two tumors (patient 2 and 3) in matched normal DNA were analyzed by ddPCR (PIK3CA mutations p.N345K, c.1035 T > A and p.E545G, c.1634A > G), the NGS standard panel and respective exome panels. Depicted are mean values and linear regression of n = 2 tumors for ddPCR, n = 2 for the standard panel and n = 2 for the exome panels. We observed a similar performance for ddPCR and the standard panel, whereas detection of tumor-DNA with exome panels was clearly superior. D Patient 3 presented with two small localized tumors of his legs (red) after numerous prior resections at another hospital. The tumors were completely resected, but he repeatedly developed local recurrences at both locations in the following years. E These recurrences were subsequently resected at four consecutive operations before a small lung metastasis (0.3 cm3) was detected and subsequently removed. Exome panels were obtained from sequencing one of the primary lesions and the lung metastasis. ctDNA was subsequently quantified with both panels in 15 plasma samples obtained during the course of his treatment. During multifocal localized disease, ctDNA values undulated at low concentrations depending on the presence of viable tumor tissue. The exome panel from the primary tumor best reflected the clinical course (enlarged image section). There was one outlier (circle). Despite complete tumor resections, ctDNA values never reached the baseline indicating MRD. In contrast the plasma sample obtained shortly before resection of the lung metastasis showed markedly increased ctDNA with a decline after its resection. The red line represents ctDNA values measured by the exome panel from the primary lesion and the dashed line ctDNA measured by the exome panel obtained from the lung metastasis. The blue area depicts the tumor volume
References
Publication types
MeSH terms
Substances
LinkOut - more resources
Full Text Sources
Medical
