. 2022 Feb 14;12(1):16.
doi: 10.1186/s13578-022-00751-4.

Role of ammonia for brain abnormal protein glycosylation during the development of hepatitis B virus-related liver diseases

Affiliations

Role of ammonia for brain abnormal protein glycosylation during the development of hepatitis B virus-related liver diseases

Jiajun Yang et al. Cell Biosci. .

Abstract

Background: Ammonia is the most typical neurotoxin in hepatic encephalopathy (HE), but the underlying pathophysiology between ammonia and aberrant glycosylation in HE remains unknown.

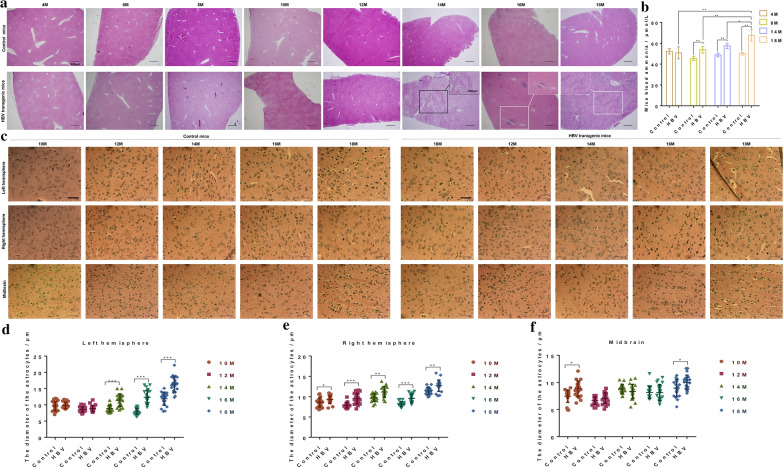
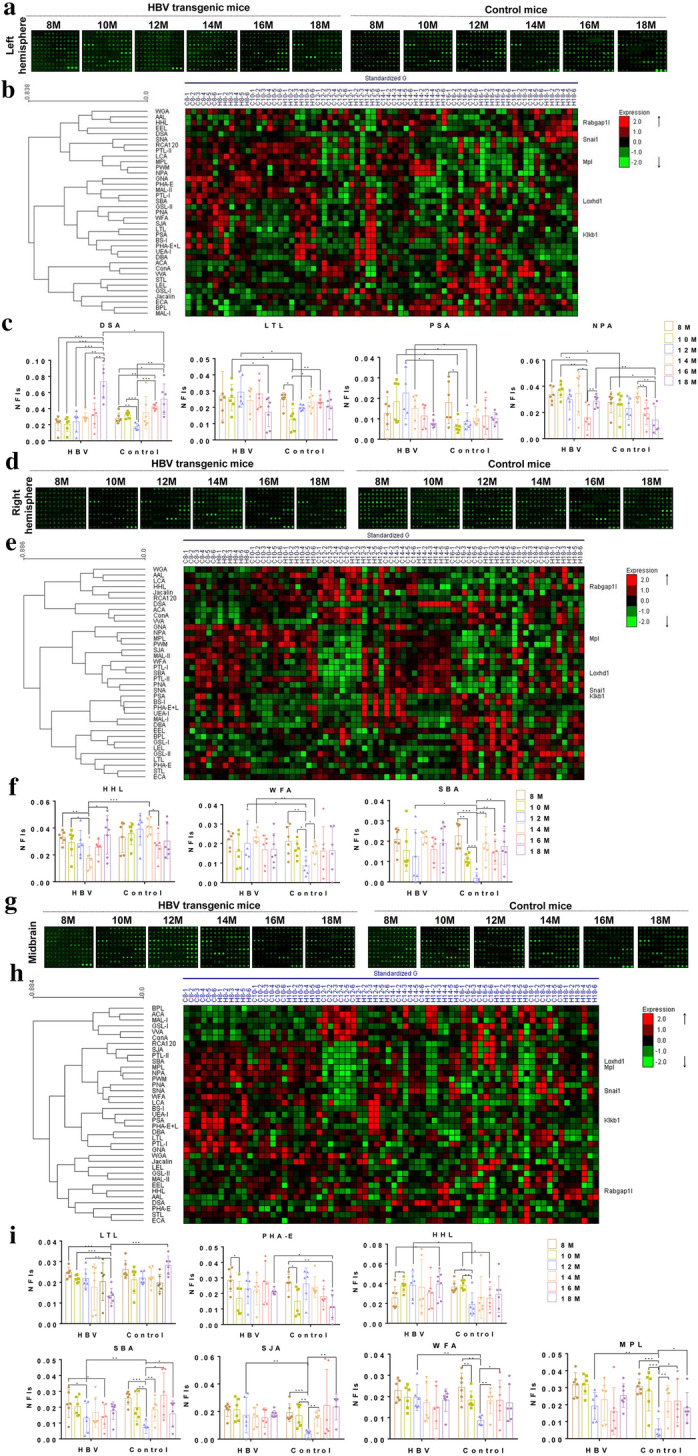
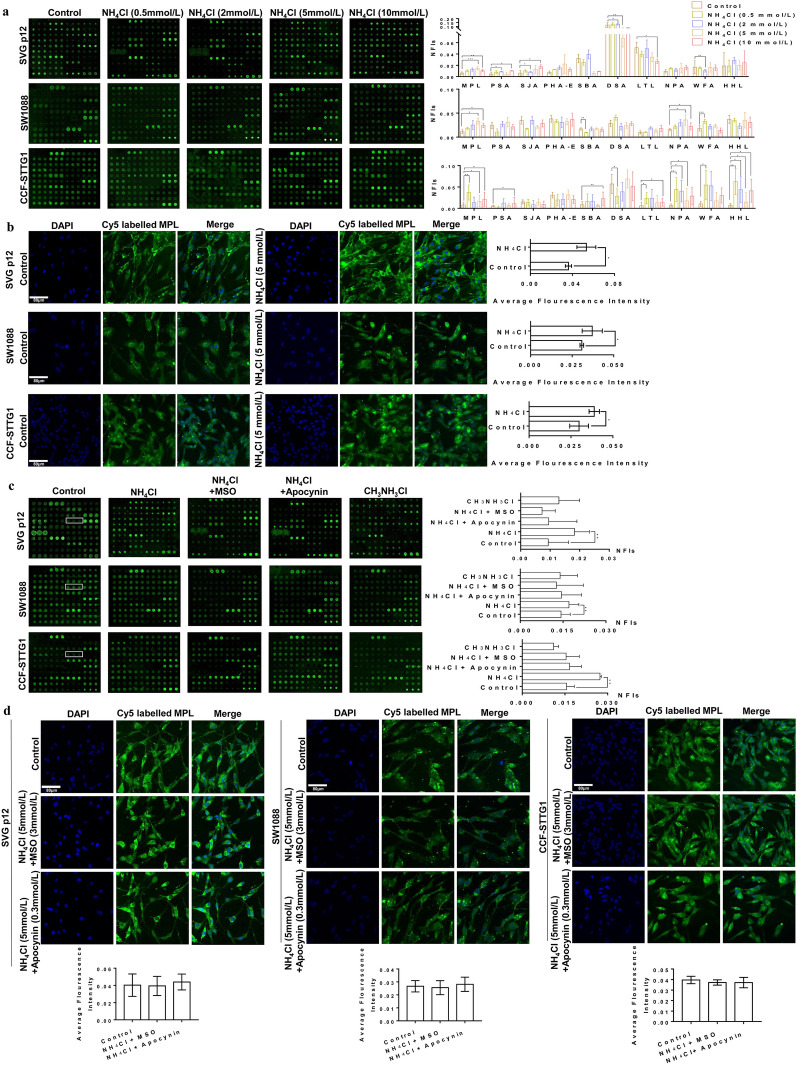
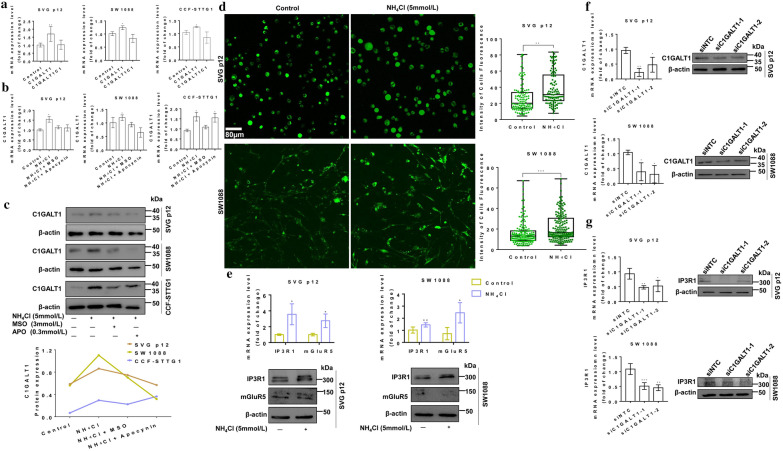
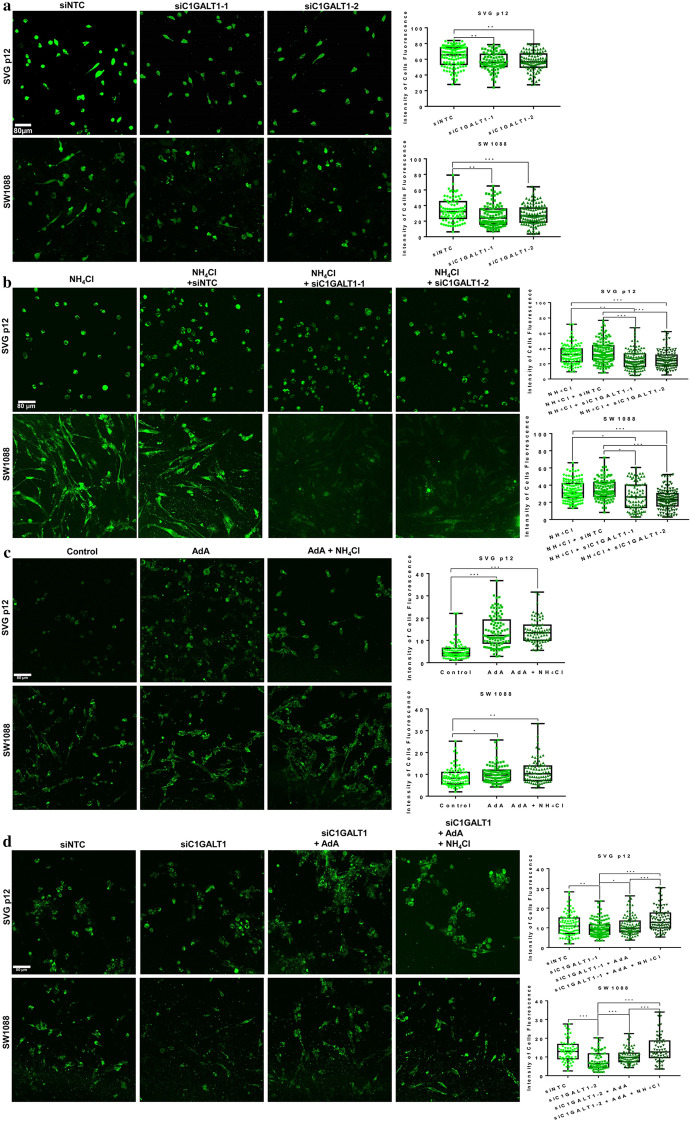
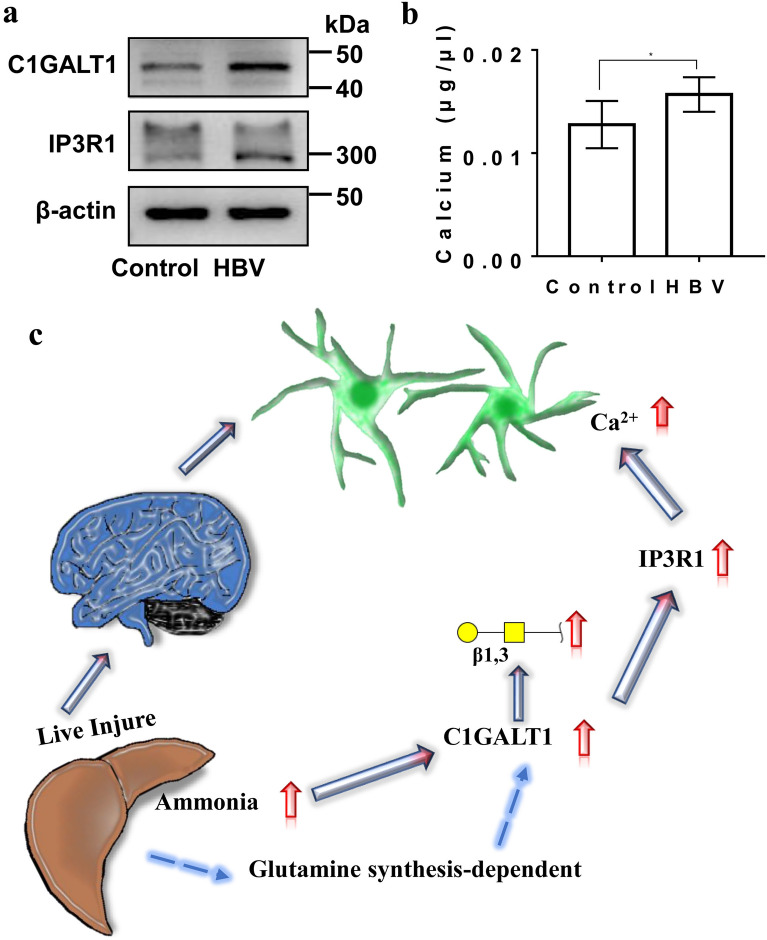
Results: Here, we used HBV transgenic mice and astrocytes to present a systems-based study of glycosylation changes and corresponding enzymes associated with the key factors of ammonia in HE. We surveyed protein glycosylation changes associated with the brain of HBV transgenic mice by lectin microarrays. Upregulation of Galβ1-3GalNAc mediated by core 1 β1,3-galactosyltransferase (C1GALT1) was identified as a result of ammonia stimulation. Using in vitro assays, we validated that upregulation of C1GALT1 is a driver of deregulates calcium (Ca2+) homeostasis by overexpression of inositol 1,4,5-trisphosphate receptor type 1 (IP3R1) in astrocytes.

Conclusions: We demonstrated that silencing C1GALT1 could depress the IP3R1 expression, an effective strategy to inhibit the ammonia-induced upregulation of Ca2+ activity, thereby C1GALT1 and IP3R1 may serve as therapeutic targets in hyperammonemia of HE.

Keywords: C1GALT1; Ca2+ homeostasis; Hepatic encephalopathy; Hyperammonemia; IP3R1.


Conflict of interest statement

The authors declare no competing interests.

Figures

Fig. 1
Fig. 1
Hepatic injury, blood ammonia concentration and astrocytes in HBV transgenic mice. a The H&E staining of mice liver tissues at 4 to 18 months old. Fatty liver was marked with a black box, and liver fibrosis was marked with white a box. Scale bar, 200/500 μm. b The serum ammonia concentration of HBV transgenic mice and control mice at 4 to 18 months old. Each group of serum came from a mixture of six mice, at least three replicates per condition. c The H&E staining of mice cerebral hemisphere and midbrain at 10 to 18 months old. Scale bar, 50 μm. df, The diameter (1000×) of astrocytes in the left hemispheres (d), right hemispheres (e) and midbrain (f)
Fig. 2
Fig. 2
The different tissue glycopatterns in HBV transgenic mice and control mice using lectin microarrays. a The glycopatterns of Cy3-labeled left hemisphere samples bound to the lectin microarrays. b Heat map and hierarchical clustering of the 37 lectins in glycopatterns of left hemisphere. c Four lectins revealed significant differences glycopatterns in left hemisphere between HBV transgenic mice and control mice. d The glycopatterns of Cy3-labeled right hemisphere samples bound to the lectin microarrays. e Heat map and hierarchical clustering of the 37 lectins in glycopatterns of right hemisphere. f Three lectins revealed significant differences glycopatterns in right hemisphere between HBV transgenic mice and control mice. g The glycopatterns of Cy3-labeled midbrain samples bound to the lectin microarrays. h Heat map and hierarchical clustering of the 37 lectins in glycopatterns of midbrain. i Seven lectins revealed significant differences glycopatterns in midbrain between HBV transgenic mice and control mice. In the heat map and hierarchical clustering, the samples were listed in columns and the lectins were listed in rows, and the color of each square represented the expression levels relative to the other data (Red, high; green, low; black, medium). Data shown are representative of six independent replicates
Fig. 3
Fig. 3
Ammonia-induced alternations of protein glycosylation in astrocytes. a The glycopatterns of Cy3-labeled protein of SVG p12, SW1088 and CCF-STTG1 cells bound to the lectin microarrays, and the NFIs of 10 lectins in the 0.5, 2, 5 or 10 mmol/L NH4Cl treated and untreated cells. b The fluorescence-based lectin cytochemical and average fluorescence intensity of Galβ1-3GalNAc binder MPL in 5 mmol/L NH4Cl treated compared with untreated SVG p12, SW1088 and CCF-STTG1 cells. c The glycopatterns of Cy3-labeled protein of SVG p12, SW1088 and CCF-STTG1 cells bound to the lectin microarrays and their NFIs, cells were treated with NH4Cl plus the glutamine synthetase inhibitor (L-Methionine sulfoximine, MSO), NADPH oxidase inhibitor (apocynin) or CH3NH3Cl. MPL was marked in the white boxes. d The fluorescence-based lectin cytochemical and average fluorescence intensity of Galβ1-3GalNAc binder MPL in SVG p12, SW1088 and CCF-STTG1 cells, which treated with NH4Cl plus the glutamine synthetase inhibitor (L-Methionine sulfoximine, MSO) or NADPH oxidase inhibitor (apocynin). The images were acquired using the same condition and shown on the same scale in the Cy5- and DAPI-merge channel, Scale Bar 80 μm
Fig. 4
Fig. 4
Ammonia stimulated C1GALTI expression and C1GALT1 silencing in astrocytes. a CIGALT1 and C1GALT1C1 mRNA levels in NH4Cl treated SVG p12, SW1088 and CCF-STTG1 cells were assessed by real-time PCR. b CIGALT1 mRNA levels in NH4Cl plus MSO or apocynin treated SVG p12, SW1088 and CCF-STTG1 cells were assessed by real-time PCR. c Western blotting of C1GALT1 protein levels in NH4Cl plus MSO or apocynin treated astrocytes compared with untreated astrocytes. d Ca2+ was loaded with Fluo-4 AM in NH4Cl treated and untreated SVG p12 and SW1088 cells and their fluorescence intensity of Ca2+. Fluorescent images were captured using the same condition, Scale Bar 80 μm. e Real-time PCR and western blotting of IP3R1 and mGluR5 levels in NH4Cl treated and untreated SVG p12 and SW1088 cells. f C1GALT1 levels in SVG p12 and SW1088 cells expressing siRNA targeting C1GALT1 (siC1GALT1-1 or siC1GALT1-2) or non-targeting control (siNTC) were determined by real-time PCR and western blotting. g IP3R1 levels of SVG p12 and SW1088 cells transduced with siC1GALT1-1, siC1GALT1-2 or siNTC were assessed by real-time PCR and western blotting. Real-time PCR graph shows average relative expression normalized to GAPDH, and data are from at three independent cultures performed in least three times
Fig. 5
Fig. 5
Ammonia regulated the expression of IP3R1 through C1GALT1 and affected calcium homeostasis. a Ca2+ was loaded with Fluo-4 AM in SVG p12 and SW1088 cells transduced with siC1GALT1-1, siC1GALT1-2 or siNTC and their fluorescence intensity of Ca2+. b Ca2+ in SVG p12 and SW1088 cells transduced with siC1GALT1-1, siC1GALT1-2 or siNTC plus NH4Cl and their fluorescence intensity of Ca2+. c Ca2+ in SVG p12 and SW1088 cells treated with AdA and NH4Cl, and their fluorescence intensity of Ca2+. d Ca2+ in SVG p12 and SW1088 cells transduced with siC1GALT1 plus AdA and NH4Cl, and their fluorescence intensity of Ca2+. Fluorescent images were captured using the same condition, Scale Bar 80 μm
Fig. 6
Fig. 6
Calcium activity in the brain of HBV transgenic mice and a molecular network. a The protein expression levels of C1GALT1 and IP3R1 in the brains of 18 months old HBV transgenic mice and control mice. b Ca2+ concentration in the brains of 18 months old HBV transgenic mice and control mice. c A proposed molecular network, using lectin microarrays approach to assess glycosylation in brains of HBV transgenic mice and human astrocytes, find increased Galβ1-3GalNAc mediated by C1GALT1 in hyperammonemia and C1GALT1 facilitates calcium concentration due to the overexpression of IP3R1

Similar articles

Cited by

References

    1. Butterworth RF, Norenberg MD, Felipo V, Ferenci P, Albrecht J, Blei AT. Members of the ISHEN Commission on Experimental Models of HE. Experimental models of hepatic encephalopathy: ISHEN guidelines. Liver Int. 2009;29(6):783–8. doi: 10.1111/j.1478-3231.2009.02034.x. - DOI - PubMed
    1. Ridola L, Faccioli J, Nardelli S, Gioia S, Riggio O. Hepatic encephalopathy: diagnosis and management. J Transl Int Med. 2020;8(4):210–219. doi: 10.2478/jtim-2020-0034. - DOI - PMC - PubMed
    1. Hadjihambi A, Arias N, Sheikh M, Jalan R. Hepatic encephalopathy: a critical current review. Hepatol Int. 2018;12(Suppl 1):135–147. doi: 10.1007/s12072-017-9812-3. - DOI - PMC - PubMed
    1. Liere V, Sandhu G, DeMorrow S. Recent advances in hepatic encephalopathy. F1000Res. 2017;6:1637. doi: 10.12688/f1000research.11938.1. - DOI - PMC - PubMed
    1. Agrawal P, Fontanals-Cirera B, Sokolova E, Jacob S, Vaiana CA, Argibay D, et al. Systems biology approach identifies FUT8 as a driver of melanoma metastasis. Cancer Cell. 2017;31(6):804–819. doi: 10.1016/j.ccell.2017.05.007. - DOI - PMC - PubMed

LinkOut - more resources