. 2022 Feb 15:11:e70714.
doi: 10.7554/eLife.70714.

Repression of hypoxia-inducible factor-1 contributes to increased mitochondrial reactive oxygen species production in diabetes

Affiliations

Repression of hypoxia-inducible factor-1 contributes to increased mitochondrial reactive oxygen species production in diabetes

Xiaowei Zheng et al. Elife. .

Abstract

Background: Excessive production of mitochondrial reactive oxygen species (ROS) is a central mechanism for the development of diabetes complications. Recently, hypoxia has been identified to play an additional pathogenic role in diabetes. In this study, we hypothesized that ROS overproduction was secondary to the impaired responses to hypoxia due to the inhibition of hypoxia-inducible factor-1 (HIF-1) by hyperglycemia.

Methods: The ROS levels were analyzed in the blood of healthy subjects and individuals with type 1 diabetes after exposure to hypoxia. The relation between HIF-1, glucose levels, ROS production and its functional consequences were analyzed in renal mIMCD-3 cells and in kidneys of mouse models of diabetes.

Results: Exposure to hypoxia increased circulating ROS in subjects with diabetes, but not in subjects without diabetes. High glucose concentrations repressed HIF-1 both in hypoxic cells and in kidneys of animals with diabetes, through a HIF prolyl-hydroxylase (PHD)-dependent mechanism. The impaired HIF-1 signaling contributed to excess production of mitochondrial ROS through increased mitochondrial respiration that was mediated by Pyruvate dehydrogenase kinase 1 (PDK1). The restoration of HIF-1 function attenuated ROS overproduction despite persistent hyperglycemia, and conferred protection against apoptosis and renal injury in diabetes.

Conclusions: We conclude that the repression of HIF-1 plays a central role in mitochondrial ROS overproduction in diabetes and is a potential therapeutic target for diabetic complications. These findings are timely since the first PHD inhibitor that can activate HIF-1 has been newly approved for clinical use.

Funding: This work was supported by grants from the Swedish Research Council, Stockholm County Research Council, Stockholm Regional Research Foundation, Bert von Kantzows Foundation, Swedish Society of Medicine, Kung Gustaf V:s och Drottning Victorias Frimurarestifelse, Karolinska Institute's Research Foundations, Strategic Research Programme in Diabetes, and Erling-Persson Family Foundation for S-B.C.; grants from the Swedish Research Council and Swedish Heart and Lung Foundation for T.A.S.; and ERC consolidator grant for M.M.

Keywords: cell biology; diabetes; diabetic complications; human; hypoxia; hypoxia-inducible factor-1; medicine; mitochondria; mouse; reactive oxygen species.


Conflict of interest statement

XZ, SN, CX, SE, JG, AZ, AD, LB, MM, PC, MD, GS, EF, AZ, KB, TS, NR, IB, FP, SC No competing interests declared

Figures

Figure 1.
Figure 1.. Hypoxia increases circulating ROS in patients with diabetes but not in control subjects without diabetes.
Healthy controls (A) and subjects with type 1 diabetes (B) were exposed to intermittent hypoxia for 1 hr. Peripheral blood was taken before (0h) and after (1h) hypoxia exposure. ROS levels were analyzed using Electron Paramagnetic Resonance (EPR) Spectroscopy with CPH spin probes (n = 10–13). Data are represented as mean ± SEM. *, p < 0.05 analysed using unpaired two-sided Student’s t-test. This figure has one figure supplement. Source data are shown in Figure 1—source data 1.
Figure 1—figure supplement 1.
Figure 1—figure supplement 1.. Schematic demonstration of hypoxia exposure protocol in the clinical study.
The study participants were exposed to intermittent hypoxia for 1 hr, consisting of five hypoxic episodes (H, 13% O2, 6 min) that alternate with normoxic episodes (N, 20.9% O2, 6 min).
Figure 2.
Figure 2.. High glucose levels inhibit HIF-1 signaling and induce apoptosis, which can be rescued by PHD inhibitor DMOG.
(A) mIMCD-3 cells were cultured in normal (5.5 mM) or high (30 mM) glucose media in the presence of DMOG or vehicle for 24 hr, and were exposed to hypoxia (H) or normoxia (N) for 6 hr before harvest. The nuclear expression of HIF-1α and Histone H3 was measured using western blotting. (B–F) mIMCD-3 cells were exposed to 5.5 or 30 mM glucose levels in normoxia (N) or hypoxia (H) in the presence or absence of DMOG or vehicle for 24 hr. The relative HRE-driven luciferase activity (B and D, n = 6), apoptosis (C and E, n = 4), and the caspase 3/7 activity (F, n = 3–4) were assessed. (G) Caspase 3/7 activity was evaluated in mIMCD-3 cells that were pre-treated with 1 mM NAC or vehicle for 1 hr before exposure to 5.5 or 30 mM glucose levels in normoxia (N) or hypoxia (H) for 24 hr (n = 4). The data under control conditions were considered as 1.0. Data are shown as mean ± SEM. *, p < 0.05; **, p < 0.01; ***, p < 0.001; ****, p < 0.0001 using one-way ANOVA followed by Bonferroni’s post hoc test (B–C, F–G), and unpaired two-sided Student t-test (D–E). This figure has one figure supplement. Source data are shown in Figure 2—source data 1.
Figure 2—figure supplement 1.
Figure 2—figure supplement 1.. Flow cytometry gating strategy for the evaluation of cellular apoptosis.
Compensation controls were performed prior to flow analysis. (A) Cell population was defined based on FSC / SSC. (B) Single cells were gated based on FSC-H / FSC-A. (C) The Annexin V – positive and 7-AAD – negative apoptotic cell population is shown in Quadrant 3 (Q3) of the bivariate histogram based on the compensated intensity of Annexin V – FITC and 7-AAD – PE Texas Red.
Figure 3.
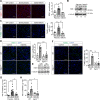
Figure 3.. High glucose levels induce mitochondrial ROS overproduction in hypoxia, which can be rescued by promoting HIF-1 function.
(A) Mitochondrial ROS levels were measured as mitosox intensity in mIMCD-3 cells cultured in normal (5.5 mM) or high (30 mM) glucose media in normoxia (N) or hypoxia (H) for 24 hr in the presence of DMOG or vehicle (n = 5). (B–D) mIMCD-3 cells were transfected with von Hippel–Lindau tumour suppressor (VHL) or control (Ctrl) siRNA, and exposed to hypoxia (H) and 30 mM glucose for 24 hr. VHL gene expression (B, n = 3), endogenous HIF-1α expression (red) and DAPI staining (blue) (C) and mitochondrial ROS levels (D, n = 5) were assessed using quantitative RT-PCR, fluorescent immunocytochemistry and flow cytometry, respectively. (E and F) mIMCD-3 cells were transfected with plasmids encoding GFP or GFP-HIF-1α,and exposed to hypoxia and 30 mM glucose for 24 hr. (E) Expression of GFP and GFP-HIF-1α (green) were detected using confocal microscopy. The nuclear HIF-1α expression was confirmed by immucytochemistry using anti-HIF-1α antibody (red). Nuclei were stained blue with DAPI. (F) Mitochondrial ROS levels are shown (n = 6). The mitosox intensity of cells cultured under control conditions were considered as 100%. Data are shown as mean ± SEM. *, p < 0.05; ***, p < 0.001; ****, p < 0.0001 using one-way ANOVA followed by Bonferroni’s post hoc test (A), and unpaired two-sided Student t-test (B, D and F). This figure has two figure supplements. Source data are shown in Figure 3—source data 1. Scale bar: 50 μm.
Figure 3—figure supplement 1.
Figure 3—figure supplement 1.. Flow cytometry gating strategy for the evaluation of mitosox intensity.
(A) Cell population was defined based on FSC / SSC. (B) Single cells were gated based on FSC-H / FSC-A. (C) Mitosox-PE-Texas red intensity was evaluated among single cells.
Figure 3—figure supplement 2.
Figure 3—figure supplement 2.. Flow cytometry gating strategy for the evaluation of mitosox intensity in mIMCD3 cells transfected with plasmids encoding GFP or GFP-fused protein.
Compensation controls were performed prior to flow analysis. (A) Cell population was defined based on FSC/SSC. (B) Single cells were gated based on FSC-H/FSC-A. (C) GFP-expressing (compensated (comp) FITC-positive) cells were gated among single cells. (D) Mitosox-PE-Texas red (compensated) intensity was evaluated among GFP-expressing (FITC-positive) cells.
Figure 4.
Figure 4.. Promoting HIF-1 function attenuates renal ROS excess and mitochondrial respiration in mouse models of diabetes.
Kidneys were harvested from wild-type (WT) and Leprdb/db diabetic mice (db/db) that were treated with placebo (vehicle) or DMOG (A–B, E, G), and from non-diabetic control (Ctrl) or diabetic (Db) wild-type (WT) and Egln1+/- mice (C–D, F, H). (A and C) HIF-1α (green), pimonidazole (red, hypoxia marker) and DAPI (blue, nuclear staining) signals were detected by fluorescent immunohistochemistry, and relative HIF-1α expression levels were quantified (A, n = 4–5; C, n = 4–6). Scale bar: 100 μm. (B and D) Renal ROS levels were detected using the OxiSelect HNE adduct competitive ELISA kit (B, n = 7–10; D, n = 5–8). (E and F) Mitochondrial respiratory function was evaluated using high resolution respirometry (E, n = 4–9; F, n = 11–17). (G and H) PDK1 gene expression in kidneys (G, n = 4–9; H, n = 4–6). (I and J) mIMCD-3 cells were transfected with plasmids encoding GFP or GFP-PDK1,and exposed to hypoxia and 30 mM glucose (H30) for 24 hr. (I) Expression of GFP and GFP-HIF-1α (green) and nuclear DAPI staining (blue) were detected using confocal microscopy. Scale bar: 50 μm. (J) Mitochondrial ROS levels are shown (n = 4). Data are shown as mean ± SEM. *, p < 0.05; **, p < 0.01; ***, p < 0.001; ****, p < 0.0001 using one-way ANOVA (A, B, E, G) and two-way ANOVA (C, D, F, H) followed by multi-comparison post hoc tests, and unpaired two-sided Student t-test (J). This figure has three figure supplements. Source data are shown in Figure 4—source data 1.
Figure 4—figure supplement 1.
Figure 4—figure supplement 1.. Kidney in diabetes is more hypoxic.
Pimonidazole (60 mg/kg body weight) was i.p. administered to mice 90 min prior to tissue harvest from wild-type (WT) and Leprdb/db diabetic mice (db/db) that were treated with placebo (vehicle) or DMOG (A), and from non-diabetic control (Ctrl) or diabetic (Db) wild-type (WT) and Egln1+/- mice (B). Pimonidazole adducts were detected on kidney sections using fluorescent immunohistochemistry and fold induction of pimonidazole signal is shown. *, p < 0.05 using one-way ANOVA (A) and two-way ANOVA (B) followed by multi-comparison post hoc tests. Source data are shown in Figure 4—figure supplement 1—source data 1.
Figure 4—figure supplement 2.
Figure 4—figure supplement 2.. DMOG increases HIF-1 target gene expression in Leprdb/db mice without affecting blood glucose levels.
Leprdb/db diabetic mice (db/db) were treated with placebo (vehicle) or DMOG (50 mg / kg) for 4 weeks. (A) There was no difference in blood glucose in Leprdb/db mice treated with placebo or DMOG (n = 7). (B) QPCR results demonstrate that DMOG increased the gene expression of HIF-1 target genes (n = 4–5). Data are shown as mean ± SEM. ns = not significant. **, p < 0.01; ****, p < 0.0001 analysed using unpaired two-sided Student’s t-test. Source data are shown in Figure 4—figure supplement 2—source data 1.
Figure 4—figure supplement 3.
Figure 4—figure supplement 3.. Egln1 haplodeficiency increases HIF-1 target gene expression in diabetic mice without affecting blood glucose levels.
Egln1 haplodeficient (Egln1+/-, HZ) and corresponding Wild-type (WT) mice were induced diabetes using STZ. HbA1c (A) and gene expression (B) of Egln1 and HIF-1 target gene GLUT3 were assessed in non-diabetic control and diabetic WT and Egln1+/- mice (n = 4–8). Data are shown as mean ± SEM, and were analyzed using unpaired two-sided Student’s t-test (A) and two-way ANOVA followed by Bonferroni’s post hoc test (B). ns = not significant; *, p < 0.05; ****, p < 0.0001. Source data are shown in Figure 4—figure supplement 3—source data 1.
Figure 5.
Figure 5.. Promoting HIF-1 function reduces renal injury and ameliorates renal dysfunction in mouse models of diabetes.
Kidneys were harvested from wild-type (WT) and Leprdb/db diabetic mice (db/db) that were treated with placebo (vehicle) or DMOG (A–C, G), and from non-diabetic control (Ctrl) or diabetic (Db) wild-type (WT) and Egln1+/- (+/-) mice (D–F, H). (A and D) Representative images of KIM-1 (red or green) and DAPI (blue) in kidney that were analysed using fluorescent immunohistochemistry. Quantifications of KIM-1 fluoresent signal are shown in corresponding histogram (A, n = 3–4; D, n = 3–6). (B and E) Representative images of KIM-1 and α-tubulin analyzed by western blotting. (C and F) Apoptotic cells were detected using TUNEL staining, and the percentage of TUNEL-positive cells were quantified (C, n = 4; F: n = 3–5). (G and H) Albuminuria is presented as the ratio of albumin (Alb) to creatinine in mouse urine (G, n = 7–13; H, n = 4–6). Data are shown as mean ± SEM. *, p < 0.05; **, p < 0.01; ***, p < 0.001 analysed using one-way ANOVA (A, C), Brown-Forsythe and Welch ANOVA (G) and two-way ANOVA (D, F, H) followed by multi-comparison test. Source data are shown in Figure 5—source data 1. Scale bar: 100 μm.
Figure 6.
Figure 6.. Repression of HIF-1 contributes to increased mitochondrial ROS production in diabetes.
Under non-diabetic conditions (left panel), HIF-1 is induced by hypoxia and activates PDK1 expression which inhibits excess mitochondrial ROS production through inhibition of mitochondrial respiration. However, under diabetic conditions (right panel), HIF-1 is inhibited by high glucose levels through a PHD-dependent mechanism despite hypoxia. This results in decreased expression of PDK1, leading to increased mitochondrial respiration and excessive mitochondrial ROS production which causes tissue damage.

Similar articles

Cited by

References

    1. Allen DA, Harwood S, Varagunam M, Raftery MJ, Yaqoob MM. High glucose-induced oxidative stress causes apoptosis in proximal tubular epithelial cells and is mediated by multiple caspases. FASEB Journal. 2003;17:908–910. doi: 10.1096/fj.02-0130fje. - DOI - PubMed
    1. Bento CF, Pereira P. Regulation of hypoxia-inducible factor 1 and the loss of the cellular response to hypoxia in diabetes. Diabetologia. 2011;54:1946–1956. doi: 10.1007/s00125-011-2191-8. - DOI - PubMed
    1. Bernardi L, Rosengård-Bärlund M, Sandelin A, Mäkinen VP, Forsblom C, Groop P-H, FinnDiane Study Group Short-term oxygen administration restores blunted baroreflex sensitivity in patients with type 1 diabetes. Diabetologia. 2011;54:2164–2173. doi: 10.1007/s00125-011-2195-4. - DOI - PubMed
    1. Bernardi L, Gordin D, Bordino M, Rosengård-Bärlund M, Sandelin A, Forsblom C, Groop PH. Oxygen-induced impairment in arterial function is corrected by slow breathing in patients with type 1 diabetes. Scientific Reports. 2017;7:6001. doi: 10.1038/s41598-017-04947-4. - DOI - PMC - PubMed
    1. Brunelle JK, Bell EL, Quesada NM, Vercauteren K, Tiranti V, Zeviani M, Scarpulla RC, Chandel NS. Oxygen sensing requires mitochondrial ROS but not oxidative phosphorylation. Cell Metabolism. 2005;1:409–414. doi: 10.1016/j.cmet.2005.05.002. - DOI - PubMed

Publication types

Substances