. 2022 May 2;28(9):1966-1978.
doi: 10.1158/1078-0432.CCR-21-0344.

Targeting the Ubiquitin-Proteasome System Using the UBA1 Inhibitor TAK-243 is a Potential Therapeutic Strategy for Small-Cell Lung Cancer

Affiliations

Targeting the Ubiquitin-Proteasome System Using the UBA1 Inhibitor TAK-243 is a Potential Therapeutic Strategy for Small-Cell Lung Cancer

Safa Majeed et al. Clin Cancer Res. .

Abstract

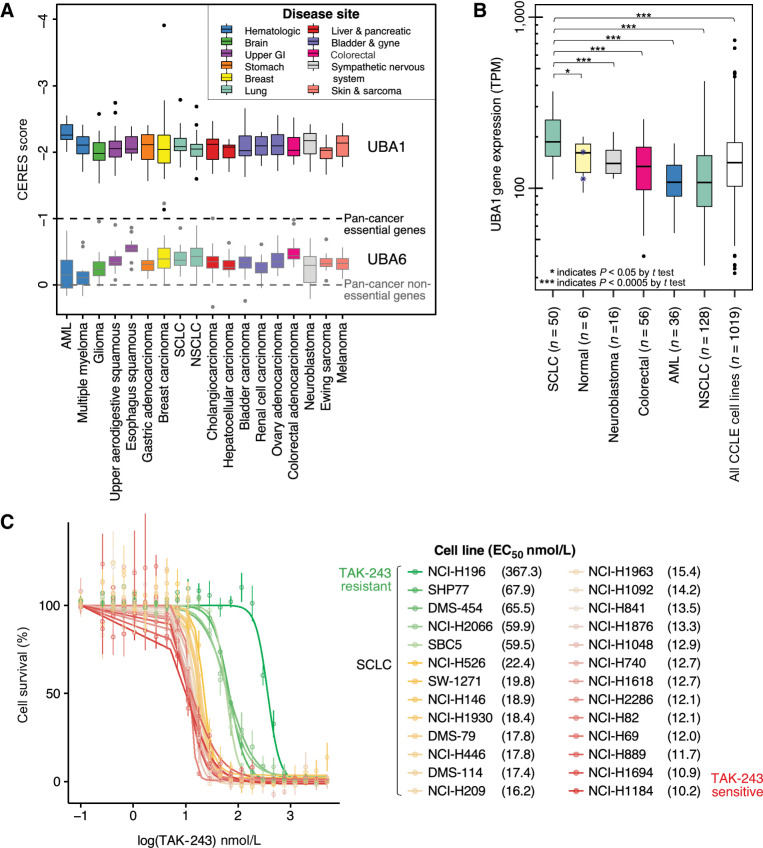
Purpose: Small cell lung cancer (SCLC) is an aggressive disease with an overall 5-year survival rate of less than 10%. Treatment for SCLC with cisplatin/etoposide chemotherapy (C/E) ± radiotherapy has changed modestly over several decades. The ubiquitin-proteasome system is an underexplored therapeutic target for SCLC. We preclinically evaluated TAK-243, a first-in-class small molecule E1 inhibitor against UBA1.

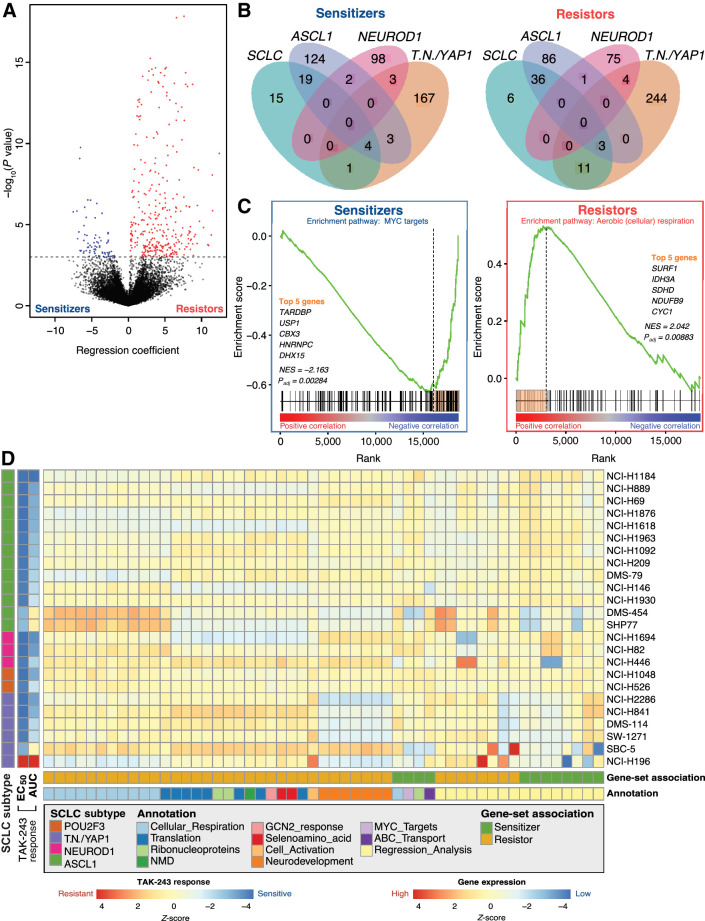
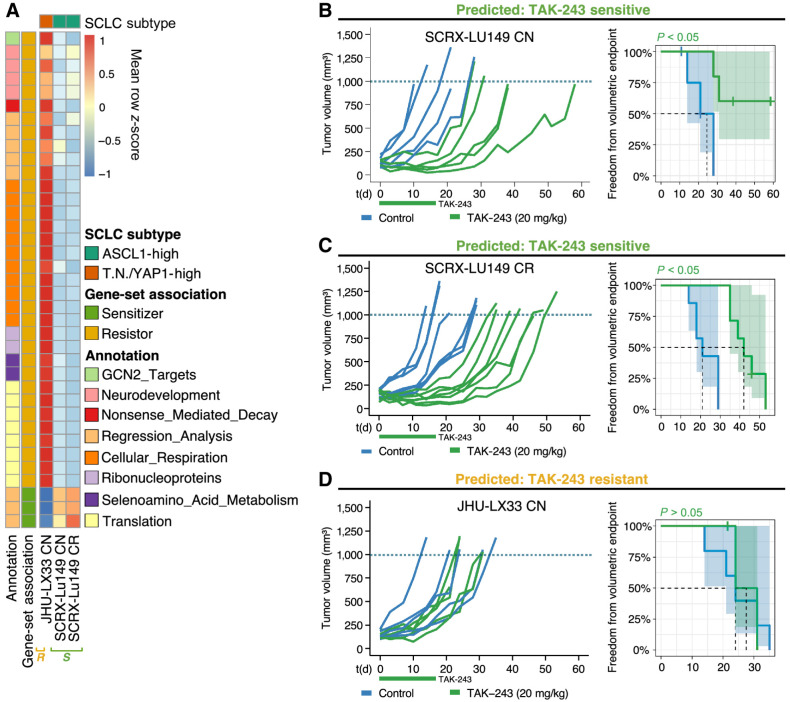
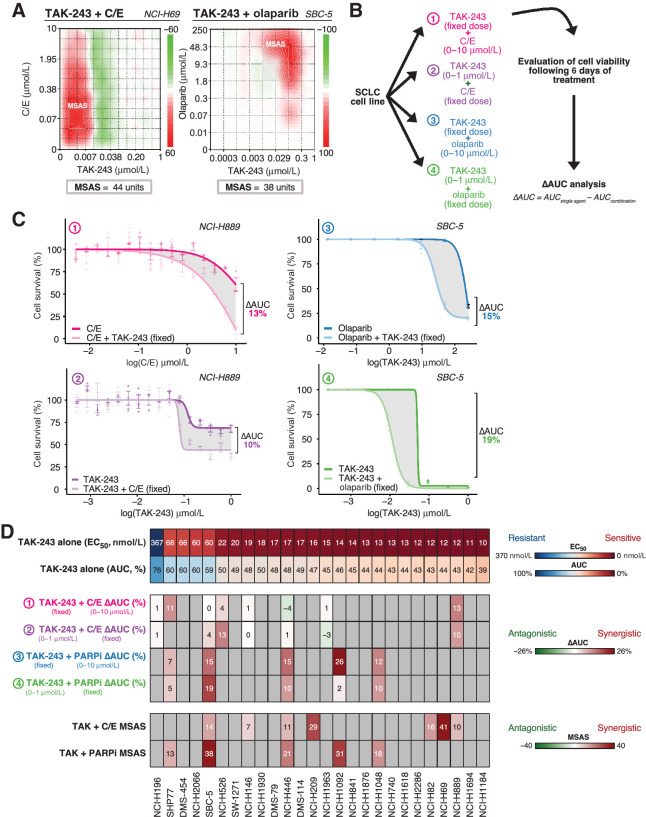
Experimental design: We assessed TAK-243 in 26 SCLC cell-lines as monotherapy and combined with C/E, the PARP-inhibitor, olaparib, and with radiation using cell viability assays. We interrogated TAK-243 response with gene expression to identify candidate biomarkers. We evaluated TAK-243 alone and in combination with olaparib or radiotherapy with SCLC patient-derived xenografts (PDX).

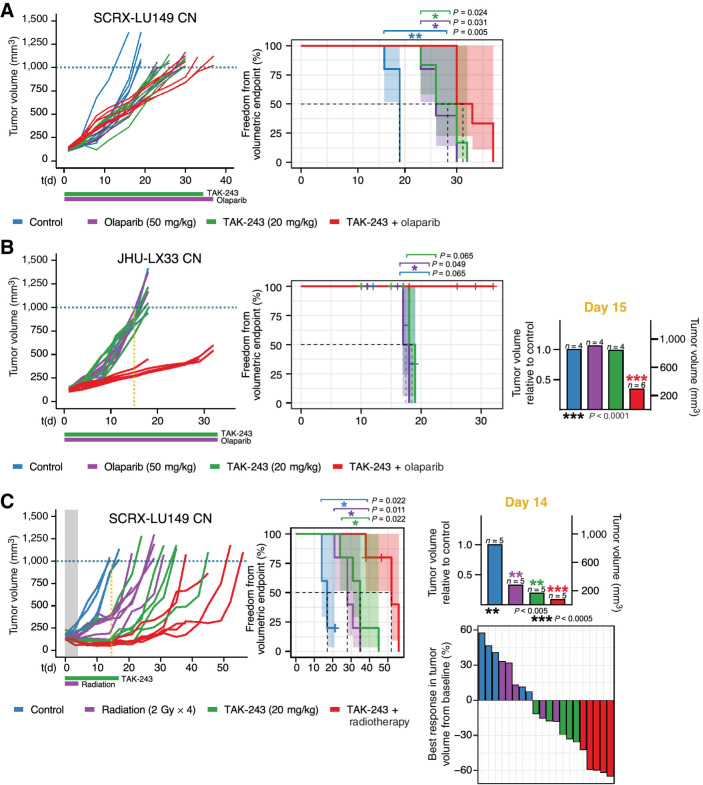
Results: Most SCLC cell lines were sensitive to TAK-243 monotherapy (EC50 median 15.8 nmol/L; range 10.2 nmol/L-367.3 nmol/L). TAK-243 sensitivity was associated with gene-sets involving the cell cycle, DNA and chromatin organization, and DNA damage repair, while resistance associated with cellular respiration, translation, and neurodevelopment. These associations were also observed in SCLC PDXs. TAK-243 synergized with C/E and olaparib in vitro across sensitive and resistant SCLC cell lines. Considerable TAK-243-olaparib synergy was observed in an SCLC PDX resistant to both drugs individually. TAK-243 radiosensitization was also observed in an SCLC PDX.

Conclusions: TAK-243 displays efficacy in SCLC preclinical models. Enrichment of gene sets is associated with TAK-243 sensitivity and resistance. TAK-243 exhibits synergy when combined with genotoxic therapies in cell lines and PDXs. TAK-243 is a potential therapeutic strategy to improve SCLC patient outcomes, both as a single agent and in combination with existing therapies.


Figures

Figure 1. UBA1 is an essential, highly expressed gene target in SCLC. A, Box and whisker plot of UBA1 (top) and UBA6 (bottom, representative control gene) dependency (CERES) scores by cancer subtype (n = 20). Colored boxes indicate disease site (n = 11). CERES scores of 0 and -1 represent the median pan-cancer nonessential and essential gene scores, respectively. A nonparametric Wilcoxon signed-rank test revealed that the median UBA1 CERES score across all cancer cell lines evaluated (n = 423) was significantly different from the median CERES score for nonessential cancer genes of 0. B, Box and whisker plot displaying relative UBA1 mRNA expression across cancer cell lines (SCLC n = 50; colorectal n = 56; neuroblastoma n = 16; AML n = 36; NSCLC n = 128) and immortalized normal cell lines (n = 6) using a log-arithmic (log10) scale. A Student t test revealed UBA1 expression was high in SCLC cell lines compared with other cancer subtypes. Normal cell lines originated from ovarian, breast, fibroblast, kidney, lung, and prostate tissues. Blue asterisks represent the immortalized normal lung cell lines evaluated. C, Dose response curves of SCLC cell lines after treatment with TAK-243 for 3 days, with individual EC50 indicated in the legend. Individual points on the plots indicate the mean of three technical replicates with SD represented by error bars. Outliers were excluded from analysis. Colors represent sensitive (red-yellow) and resistant (green) SCLC cell lines. GI, gastrointestinal; AML, acute myeloid leukemia; SCLC, small cell lung cancer; NSCLC, non small cell lung cancer.
Figure 1.
UBA1 is an essential, highly expressed gene target in SCLC. A, Box and whisker plot of UBA1 (top) and UBA6 (bottom, representative control gene) dependency (CERES) scores by cancer subtype (n = 20). Colored boxes indicate disease site (n = 11). CERES scores of 0 and -1 represent the median pan-cancer nonessential and essential gene scores, respectively. A nonparametric Wilcoxon signed-rank test revealed that the median UBA1 CERES score across all cancer cell lines evaluated (n = 423) was significantly different from the median CERES score for nonessential cancer genes of 0. B, Box and whisker plot displaying relative UBA1 mRNA expression across cancer cell lines (SCLC n = 50; colorectal n = 56; neuroblastoma n = 16; AML n = 36; NSCLC n = 128) and immortalized normal cell lines (n = 6) using a log-arithmic (log10) scale. A Student t test revealed UBA1 expression was high in SCLC cell lines compared with other cancer subtypes. Normal cell lines originated from ovarian, breast, fibroblast, kidney, lung, and prostate tissues. Blue asterisks represent the immortalized normal lung cell lines evaluated. C, Dose response curves of SCLC cell lines after treatment with TAK-243 for 3 days, with individual EC50 indicated in the legend. Individual points on the plots indicate the mean of three technical replicates with SD represented by error bars. Outliers were excluded from analysis. Colors represent sensitive (red-yellow) and resistant (green) SCLC cell lines. GI, gastrointestinal; AML, acute myeloid leukemia; SCLC, small cell lung cancer; NSCLC, non small cell lung cancer.
Figure 2. Candidate gene-sets are putative biomarkers of TAK-243 response in SCLC cell lines. A, Volcano plot showing results of TAK-243 EC50 regression analysis where the x-axis represents the regression coefficient assigned to each gene and the y-axis represents significance. Genes highlighted in blue represent sensitizer genes (expression is significantly negatively correlated with EC50; FDR < 0.05) and red genes represent resistor genes (expression is significantly positively correlated with EC50; FDR < 0.05). The dotted black horizontal line represents the significance threshold (Padj < 0.05). B, Venn diagram showing overlaps of sensitizer (left) and resistor (right) genes identified from each of the four regression analyses: All SCLC cell lines, ASCL1-high cell lines only, TN/YAP1-high cell lines only, and NEUROD1-high cell lines only. C, Representative example of how leading-edge genes were selected through GSEA to identify sensitizer (left) and resistor (right) pathways from across SCLC cell lines and subtypes. Leading-edge genes (highlighted orange bar) were used as potential biomarkers for TAK-243 response. MYC target (sensitizer) and aerobic respiration (cellular respiration; resistor) are depicted. D, Heatmap of scaled ssGSEA enrichment score for each set of biomarker genes identified from the regression or pathway analyses used to identify TAK-243 response in subsets of SCLC cell lines and subsequently applied to each SCLC cell line.
Figure 2.
Candidate gene-sets are putative biomarkers of TAK-243 response in SCLC cell lines. A, Volcano plot showing results of TAK-243 EC50 regression analysis where the x-axis represents the regression coefficient assigned to each gene and the y-axis represents significance. Genes highlighted in blue represent sensitizer genes (expression is significantly negatively correlated with EC50; FDR < 0.05) and red genes represent resistor genes (expression is significantly positively correlated with EC50; FDR < 0.05). The dotted black horizontal line represents the significance threshold (Padj < 0.05). B, Venn diagram showing overlaps of sensitizer (left) and resistor (right) genes identified from each of the four regression analyses: All SCLC cell lines, ASCL1-high cell lines only, TN/YAP1-high cell lines only, and NEUROD1-high cell lines only. C, Representative example of how leading-edge genes were selected through GSEA to identify sensitizer (left) and resistor (right) pathways from across SCLC cell lines and subtypes. Leading-edge genes (highlighted orange bar) were used as potential biomarkers for TAK-243 response. MYC target (sensitizer) and aerobic respiration (cellular respiration; resistor) are depicted. D, Heatmap of scaled ssGSEA enrichment score for each set of biomarker genes identified from the regression or pathway analyses used to identify TAK-243 response in subsets of SCLC cell lines and subsequently applied to each SCLC cell line.
Figure 3. TAK-243 sensitivity and resistance across two SCLC PDX models can be identified by candidate gene-sets derived in vitro. A, Heatmap of mean scaled single-sample GSEA enrichment score for each set of validated biomarker genes identified from in vitro cell line analyses and their independent associations with TAK-243 response in SCLC PDX models. ‘S’ denoting that SCRX-Lu149 CN and CR PDX models were TAK-243 sensitive and ‘R’ denoting that JHU-LX33 PDX model was TAK-243 resistant. Individual PDX tumor growth curves (left graphs) and Kaplan–Meier survival plots (right graphs) of SCRX-LU149 CN and CR (B and C); JHU-LX33 CN (D); PDX models were treated with either vehicle control or 20 mg/kg of TAK-243 (biweekly X 3 weeks, intravenously) alone. Freedom from volumetric endpoint (1,000 mm3, indicated by the dotted line in each growth curve) was determined by Kaplan–Meier survival analysis. For the Kaplan–Meier curves, shaded areas represent the 95% confidence intervals (CI) around each curve, and the dotted line, the median freedom from volumetric endpoint. The log-rank test was used to evaluate statistical significance, with adjusted P values to account for multiple tests.
Figure 3.
TAK-243 sensitivity and resistance across two SCLC PDX models can be identified by candidate gene-sets derived in vitro.A, Heatmap of mean scaled single-sample GSEA enrichment score for each set of validated biomarker genes identified from in vitro cell line analyses and their independent associations with TAK-243 response in SCLC PDX models. ‘S’ denoting that SCRX-Lu149 CN and CR PDX models were TAK-243 sensitive and ‘R’ denoting that JHU-LX33 PDX model was TAK-243 resistant. Individual PDX tumor growth curves (left graphs) and Kaplan–Meier survival plots (right graphs) of SCRX-LU149 CN and CR (B and C); JHU-LX33 CN (D); PDX models were treated with either vehicle control or 20 mg/kg of TAK-243 (biweekly X 3 weeks, intravenously) alone. Freedom from volumetric endpoint (1,000 mm3, indicated by the dotted line in each growth curve) was determined by Kaplan–Meier survival analysis. For the Kaplan–Meier curves, shaded areas represent the 95% confidence intervals (CI) around each curve, and the dotted line, the median freedom from volumetric endpoint. The log-rank test was used to evaluate statistical significance, with adjusted P values to account for multiple tests.
Figure 4. TAK-243 synergizes with standard of care C/E chemotherapy and olaparib. A, The NCI-H69 and SBC-5 SCLC cell lines serve as a representative example of the dose response matrices utilized to evaluate TAK-243 synergy with C/E chemotherapy and olaparib, respectively. Relative synergy scores are color-coded where red indicates synergy, white indicates lack of synergy, and green indicates antagonism based on respective synergy scoring. NCI-H69 and SBC-5 demonstrated the most synergy with TAK-243 in combination with chemotherapy and olaparib, respectively, as determined by the Bliss MSAS synergy metric. MSAS was calculated using the values outlined in gray boxes. B, Schematic of experimental design for TAK-243–C/E and TAK-olaparib dose response and analysis. SCLC cell-lines were treated with either various or fixed doses of TAK-243, C/E, or olaparib over 6 days. C, Dose response curves of representative NCI-H889 and SBC-5 cell lines after combination therapy consisting of either a fixed dose of TAK-243 with various doses of C/E (top left), a fixed dose of C/E with various doses of TAK-243 (bottom left), a fixed dose of TAK-243 with various doses of olaparib (top right), or a fixed dose of olaparib with various doses of TAK-243 (bottom right). Gray shaded region indicates the change in AUC measured. Individual points on the plots indicate the mean of three technical replicates with SD represented by error bars. Outliers were excluded from analysis. D, Observed TAK-243–C/E and TAK-243–olaparib synergy in SCLC was independent of specific cell line sensitivity or resistance to single-agent TAK-243. Top, Heatmap depicting SCLC cell-lines and their respective EC50 (μmol/L) and AUC value (%) in order of sensitivity (left to right). Middle, Heatmap illustrating the difference in AUC between single agent (TAK-243, C/E, or olaparib) and combination therapies (TAK-243 + C/E or TAK-243 + olaparib) across labeled SCLC cell lines. Bottom, Heatmap depicting Bliss MSAS as determined by TAK-243–C/E and TAK-243–olaparib synergy analysis for labeled SCLC cell lines. Gray nonnumbered boxes indicate cell lines for which combination experiments or analyses were not conducted. MSAS, most synergistic area score.
Figure 4.
TAK-243 synergizes with standard of care C/E chemotherapy and olaparib. A, The NCI-H69 and SBC-5 SCLC cell lines serve as a representative example of the dose response matrices utilized to evaluate TAK-243 synergy with C/E chemotherapy and olaparib, respectively. Relative synergy scores are color-coded where red indicates synergy, white indicates lack of synergy, and green indicates antagonism based on respective synergy scoring. NCI-H69 and SBC-5 demonstrated the most synergy with TAK-243 in combination with chemotherapy and olaparib, respectively, as determined by the Bliss MSAS synergy metric. MSAS was calculated using the values outlined in gray boxes. B, Schematic of experimental design for TAK-243–C/E and TAK-olaparib dose response and analysis. SCLC cell-lines were treated with either various or fixed doses of TAK-243, C/E, or olaparib over 6 days. C, Dose response curves of representative NCI-H889 and SBC-5 cell lines after combination therapy consisting of either a fixed dose of TAK-243 with various doses of C/E (top left), a fixed dose of C/E with various doses of TAK-243 (bottom left), a fixed dose of TAK-243 with various doses of olaparib (top right), or a fixed dose of olaparib with various doses of TAK-243 (bottom right). Gray shaded region indicates the change in AUC measured. Individual points on the plots indicate the mean of three technical replicates with SD represented by error bars. Outliers were excluded from analysis. D, Observed TAK-243–C/E and TAK-243–olaparib synergy in SCLC was independent of specific cell line sensitivity or resistance to single-agent TAK-243. Top, Heatmap depicting SCLC cell-lines and their respective EC50 (μmol/L) and AUC value (%) in order of sensitivity (left to right). Middle, Heatmap illustrating the difference in AUC between single agent (TAK-243, C/E, or olaparib) and combination therapies (TAK-243 + C/E or TAK-243 + olaparib) across labeled SCLC cell lines. Bottom, Heatmap depicting Bliss MSAS as determined by TAK-243–C/E and TAK-243–olaparib synergy analysis for labeled SCLC cell lines. Gray nonnumbered boxes indicate cell lines for which combination experiments or analyses were not conducted. MSAS, most synergistic area score.
Figure 5. TAK-243 synergizes with genotoxic therapies in TAK-243 monotherapy sensitive and resistant SCLC PDX models. Individual PDX tumor growth curves (left) and Kaplan–Meier survival plots (middle) of SCRX-LU149 CN (A and C) and JHU-LX33 CN (B). PDX models after treatment with either vehicle control, olaparib (50 mg/kg, 5 times/week until termination, oral), TAK-243 (20 mg/kg, biweekly × 5 weeks, intravenous), and TAK-243–olaparib (TAK-243 20 mg/kg, olaparib 50 mg/kg; A and B) or vehicle control, TAK-243 (20 mg/kg, biweekly × 3 weeks, intravenous), radiation (2G x 4), and TAK-243 + radiotherapy combination (TAK-243 20 mg/kg, radiotherapy 2G x 4, C). Dosing schedule is indicated below x-axis of growth-response curves: the horizontal green and purple lines represent period of TAK-243 and olaparib or radiation dosing, respectively. Freedom from volumetric endpoint (1,000 mm3, indicated by the dotted line in each growth curve) was determined by Kaplan–Meier survival analysis. For the Kaplan–Meier curves shaded areas represent the 95% CIs around each curve, and the dotted line, the median freedom from volumetric endpoint. The log-rank test was used to evaluate statistical significance, with adjusted P values to account for multiple tests. B, TAK-243 synergizes most with olaparib in the TAK-243, olaparib monotherapy resistant JHU-LX33 CN SCLC PDX model. Middle, Kaplan–Meier curve analysis for the control, TAK-243, and olaparib single agent groups was calculated by creating variance between groups artificially (+ or −1 day per each event) to enable visualization of each curve. Right, Average tumor volume of olaparib, TAK-243-, and combination-treated mice relative to control on day 15 of treatment. TAK-243 + olaparib–treated mice had significantly smaller tumors 15 days following treatment compared with all other groups (unpaired t test, P < 0.0001). C (right, top, TAK-243 + radiotherapy–treated mice had significantly smaller tumors 14 days following treatment compared with all other groups (unpaired t test, P < 0.0005). Waterfall plot (right, bottom) depicting the best response of individual mice treated with control, TAK-243, radiotherapy, or TAK-243 + radiotherapy. Best response was considered as the smallest tumor volume (compared with baseline) over the course of the study. The gray shaded area and the purple horizontal line of radiation indicates duration of time in which combination therapy overlapped. RT, radiotherapy; PDX, patient derived xenograft.
Figure 5.
TAK-243 synergizes with genotoxic therapies in TAK-243 monotherapy sensitive and resistant SCLC PDX models. Individual PDX tumor growth curves (left) and Kaplan–Meier survival plots (middle) of SCRX-LU149 CN (A and C) and JHU-LX33 CN (B). PDX models after treatment with either vehicle control, olaparib (50 mg/kg, 5 times/week until termination, oral), TAK-243 (20 mg/kg, biweekly × 5 weeks, intravenous), and TAK-243–olaparib (TAK-243 20 mg/kg, olaparib 50 mg/kg; A and B) or vehicle control, TAK-243 (20 mg/kg, biweekly × 3 weeks, intravenous), radiation (2G x 4), and TAK-243 + radiotherapy combination (TAK-243 20 mg/kg, radiotherapy 2G x 4, C). Dosing schedule is indicated below x-axis of growth-response curves: the horizontal green and purple lines represent period of TAK-243 and olaparib or radiation dosing, respectively. Freedom from volumetric endpoint (1,000 mm3, indicated by the dotted line in each growth curve) was determined by Kaplan–Meier survival analysis. For the Kaplan–Meier curves shaded areas represent the 95% CIs around each curve, and the dotted line, the median freedom from volumetric endpoint. The log-rank test was used to evaluate statistical significance, with adjusted P values to account for multiple tests. B, TAK-243 synergizes most with olaparib in the TAK-243, olaparib monotherapy resistant JHU-LX33 CN SCLC PDX model. Middle, Kaplan–Meier curve analysis for the control, TAK-243, and olaparib single agent groups was calculated by creating variance between groups artificially (+ or −1 day per each event) to enable visualization of each curve. Right, Average tumor volume of olaparib, TAK-243-, and combination-treated mice relative to control on day 15 of treatment. TAK-243 + olaparib–treated mice had significantly smaller tumors 15 days following treatment compared with all other groups (unpaired t test, P < 0.0001). C (right, top, TAK-243 + radiotherapy–treated mice had significantly smaller tumors 14 days following treatment compared with all other groups (unpaired t test, P < 0.0005). Waterfall plot (right, bottom) depicting the best response of individual mice treated with control, TAK-243, radiotherapy, or TAK-243 + radiotherapy. Best response was considered as the smallest tumor volume (compared with baseline) over the course of the study. The gray shaded area and the purple horizontal line of radiation indicates duration of time in which combination therapy overlapped. RT, radiotherapy; PDX, patient derived xenograft.

Comment in

  • New potential targeted strategies in small cell lung cancer.
    de Toro M, Pangua C, Serrano-Montero G, Lara MÁ, Rogado J. de Toro M, et al. Transl Lung Cancer Res. 2023 Apr 28;12(4):661-664. doi: 10.21037/tlcr-23-64. Epub 2023 Apr 4. Transl Lung Cancer Res. 2023. PMID: 37197617 Free PMC article. No abstract available.

References

    1. Rudin CM, Brambilla E, Faivre-Finn C, Sage J. Small-cell lung cancer. Nat Rev Dis Prim 2021;7:3. - PMC - PubMed
    1. Rudin CM, Poirier JT, Byers LA, Dive C, Dowlati A, George J, et al. Molecular subtypes of small cell lung cancer: a synthesis of human and mouse model data. Nat Rev Cancer 2019;19:289–97. - PMC - PubMed
    1. Baine MK, Hsieh MS, Lai WV, Egger JV, Jungbluth AA, Daneshbod Y, et al. SCLC subtypes defined by ASCL1, NEUROD1, POU2F3, and YAP1: a comprehensive immunohistochemical and histopathologic characterization. J Thorac Oncol 2020;15:1823–35. - PMC - PubMed
    1. Gay CM, Stewart CA, Park EM, Diao L, Groves SM, Heeke S, et al. Patterns of transcription factor programs and immune pathway activation define four major subtypes of SCLC with distinct therapeutic vulnerabilities. Cancer Cell 2021;39:346–60. - PMC - PubMed
    1. Simpson KL, Stoney R, Frese KK, Simms N, Rowe W, Pearce SP, et al. A biobank of small cell lung cancer CDX models elucidates inter- and intratumoral phenotypic heterogeneity. Nat Cancer 2020;1:437–51. - PubMed

Publication types