. 2022 Mar 30;42(13):2786-2803.
doi: 10.1523/JNEUROSCI.1627-21.2022. Epub 2022 Feb 14.

Nicotinic Acetylcholine Receptors Expressed by Striatal Interneurons Inhibit Striatal Activity and Control Striatal-Dependent Behaviors

Affiliations

Nicotinic Acetylcholine Receptors Expressed by Striatal Interneurons Inhibit Striatal Activity and Control Striatal-Dependent Behaviors

Alice Abbondanza et al. J Neurosci. .

Abstract

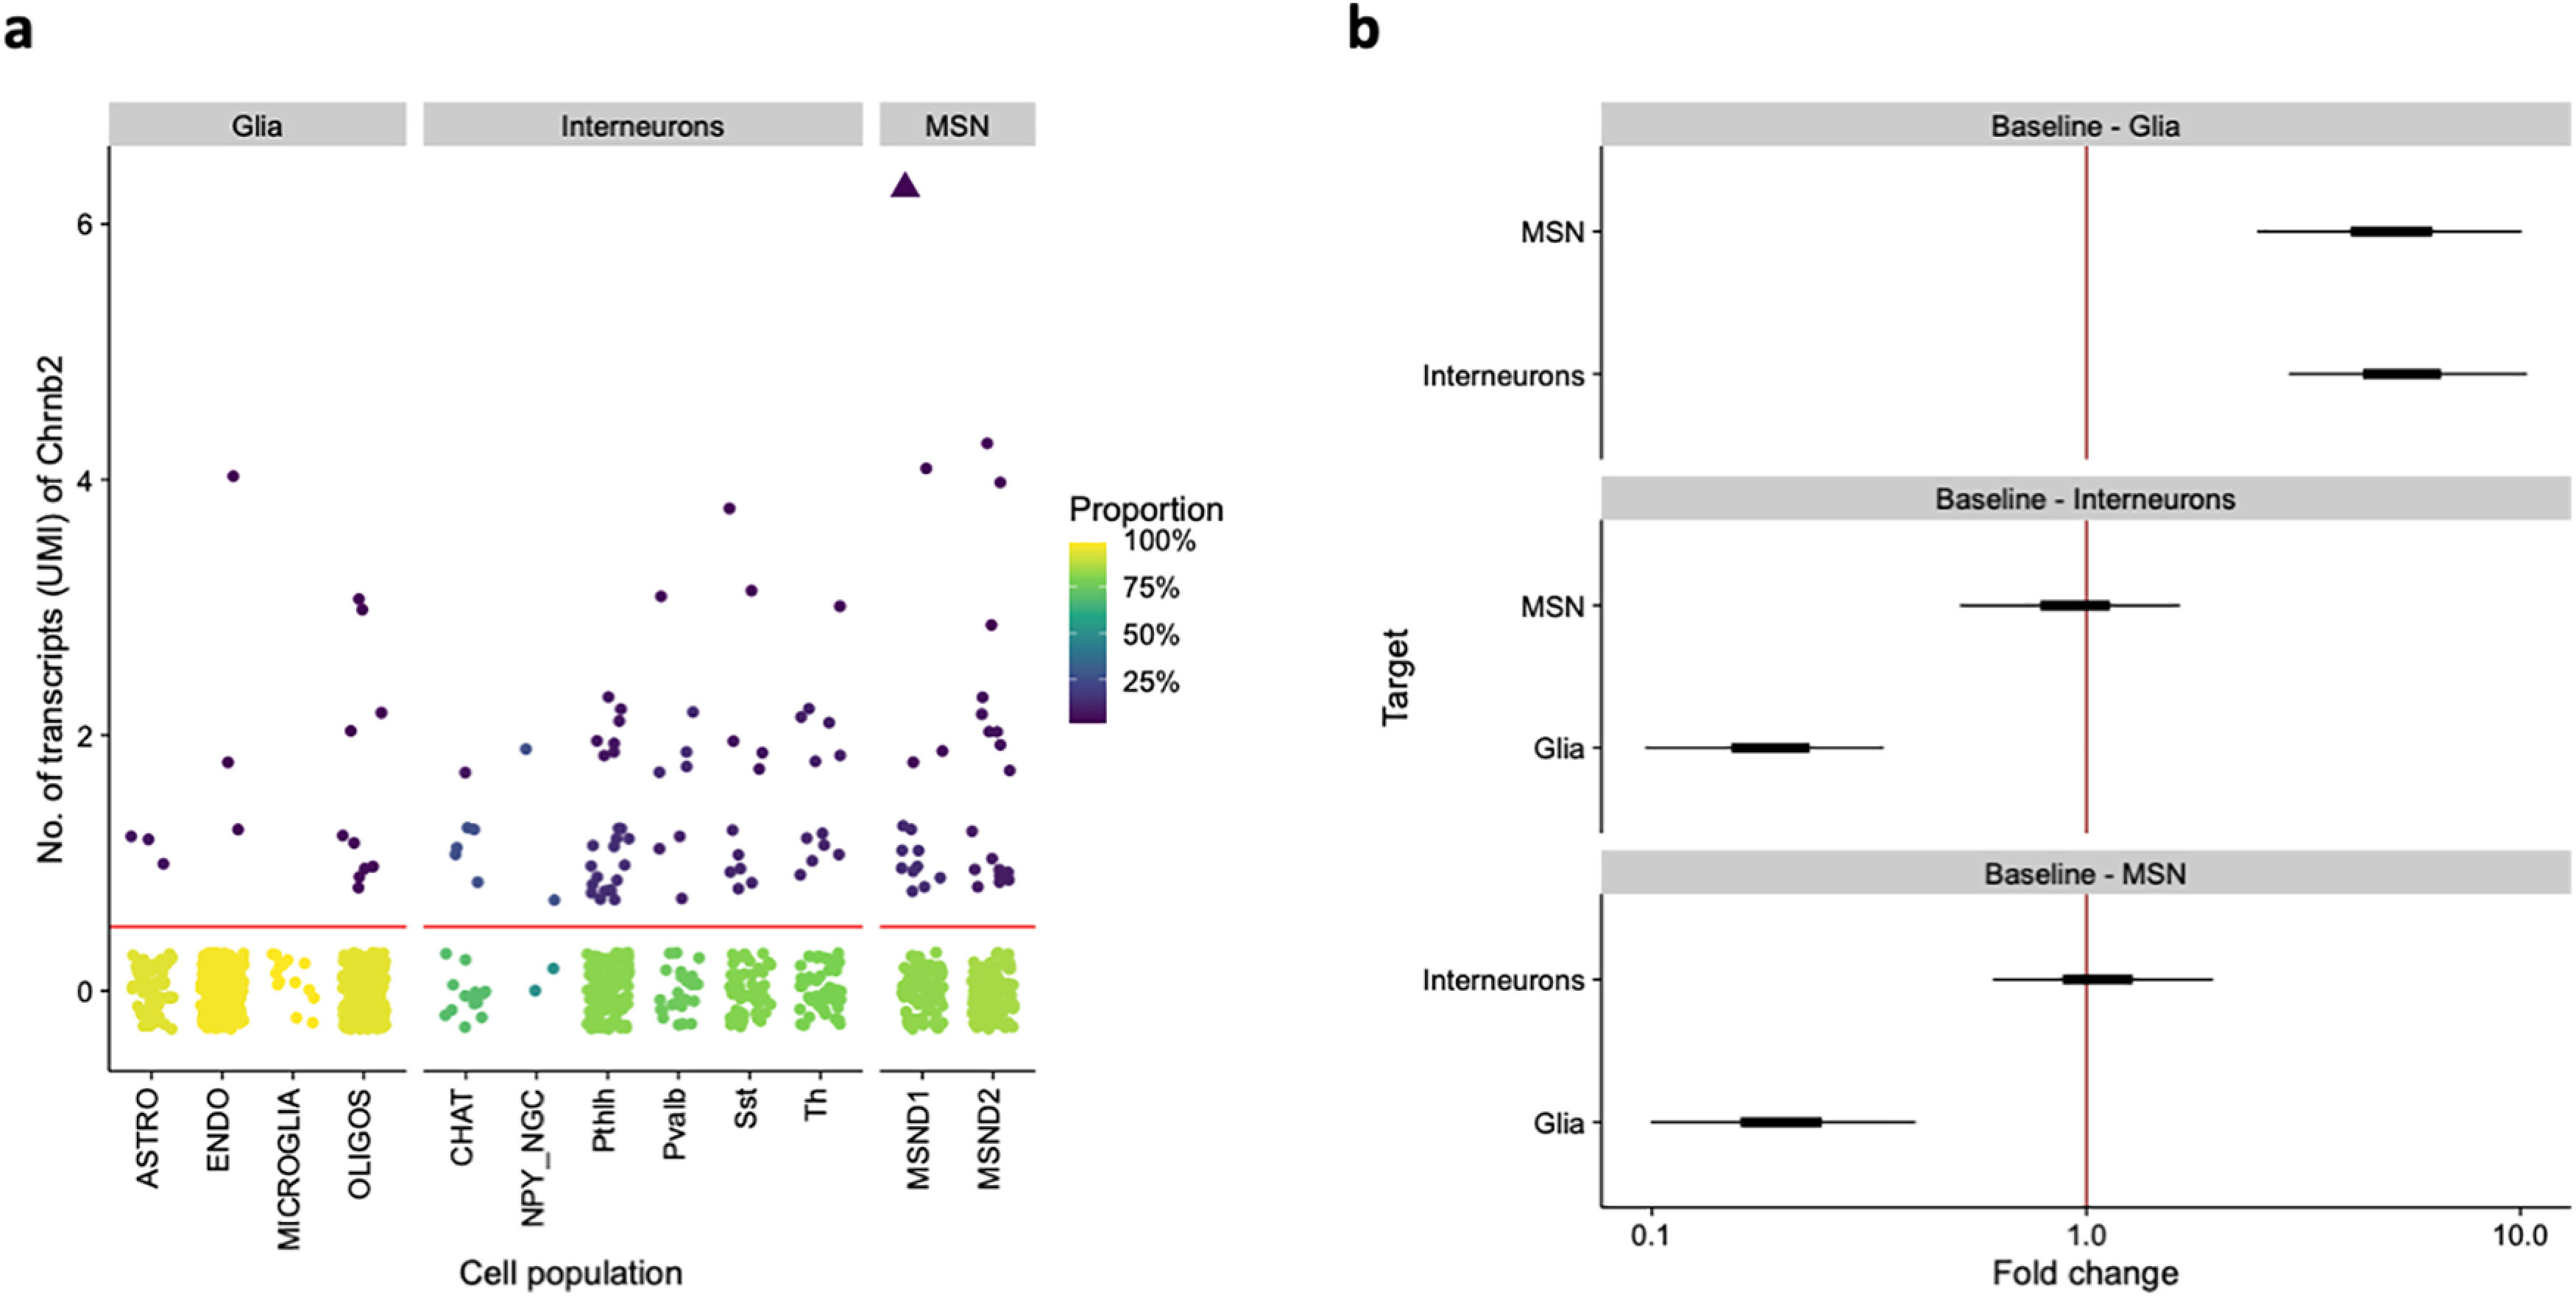
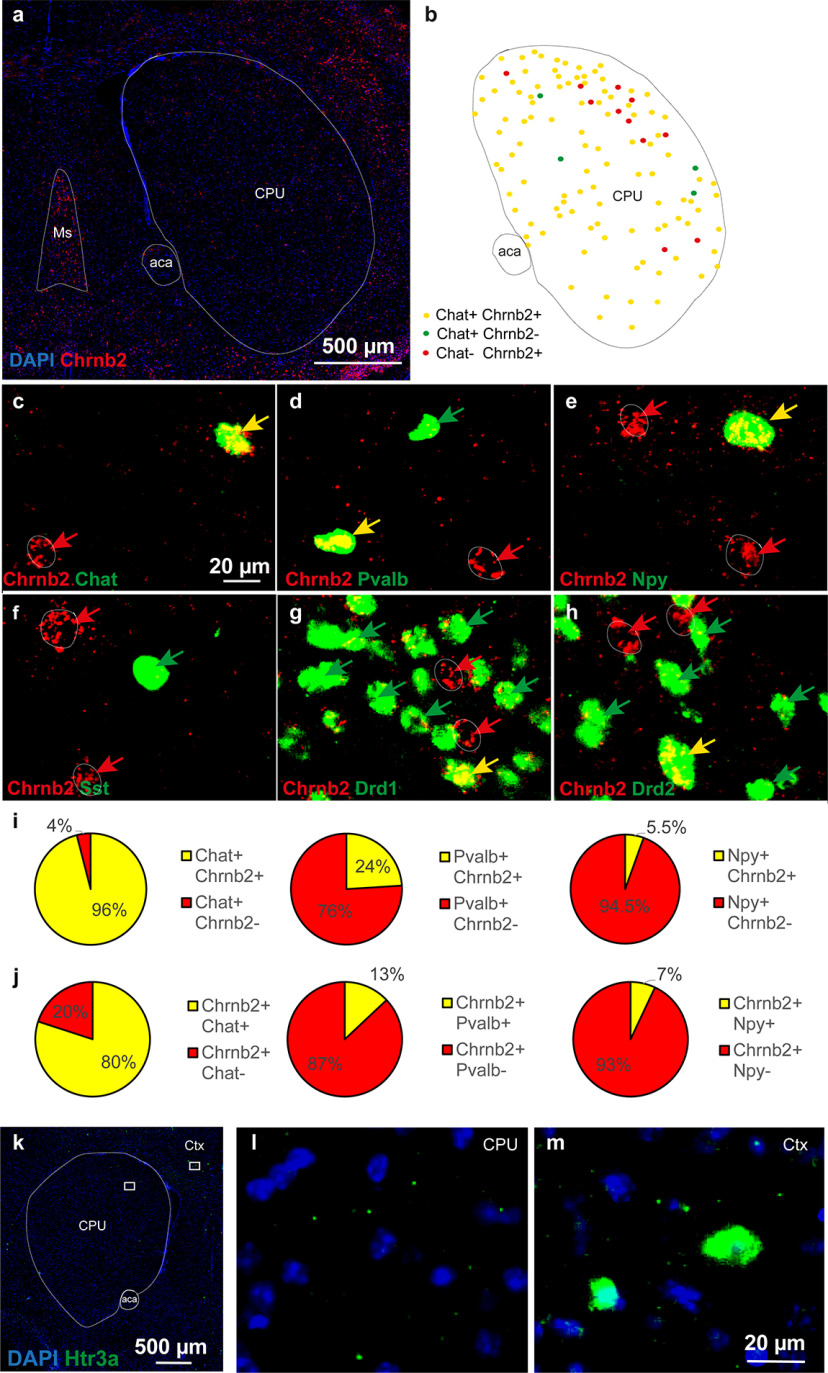
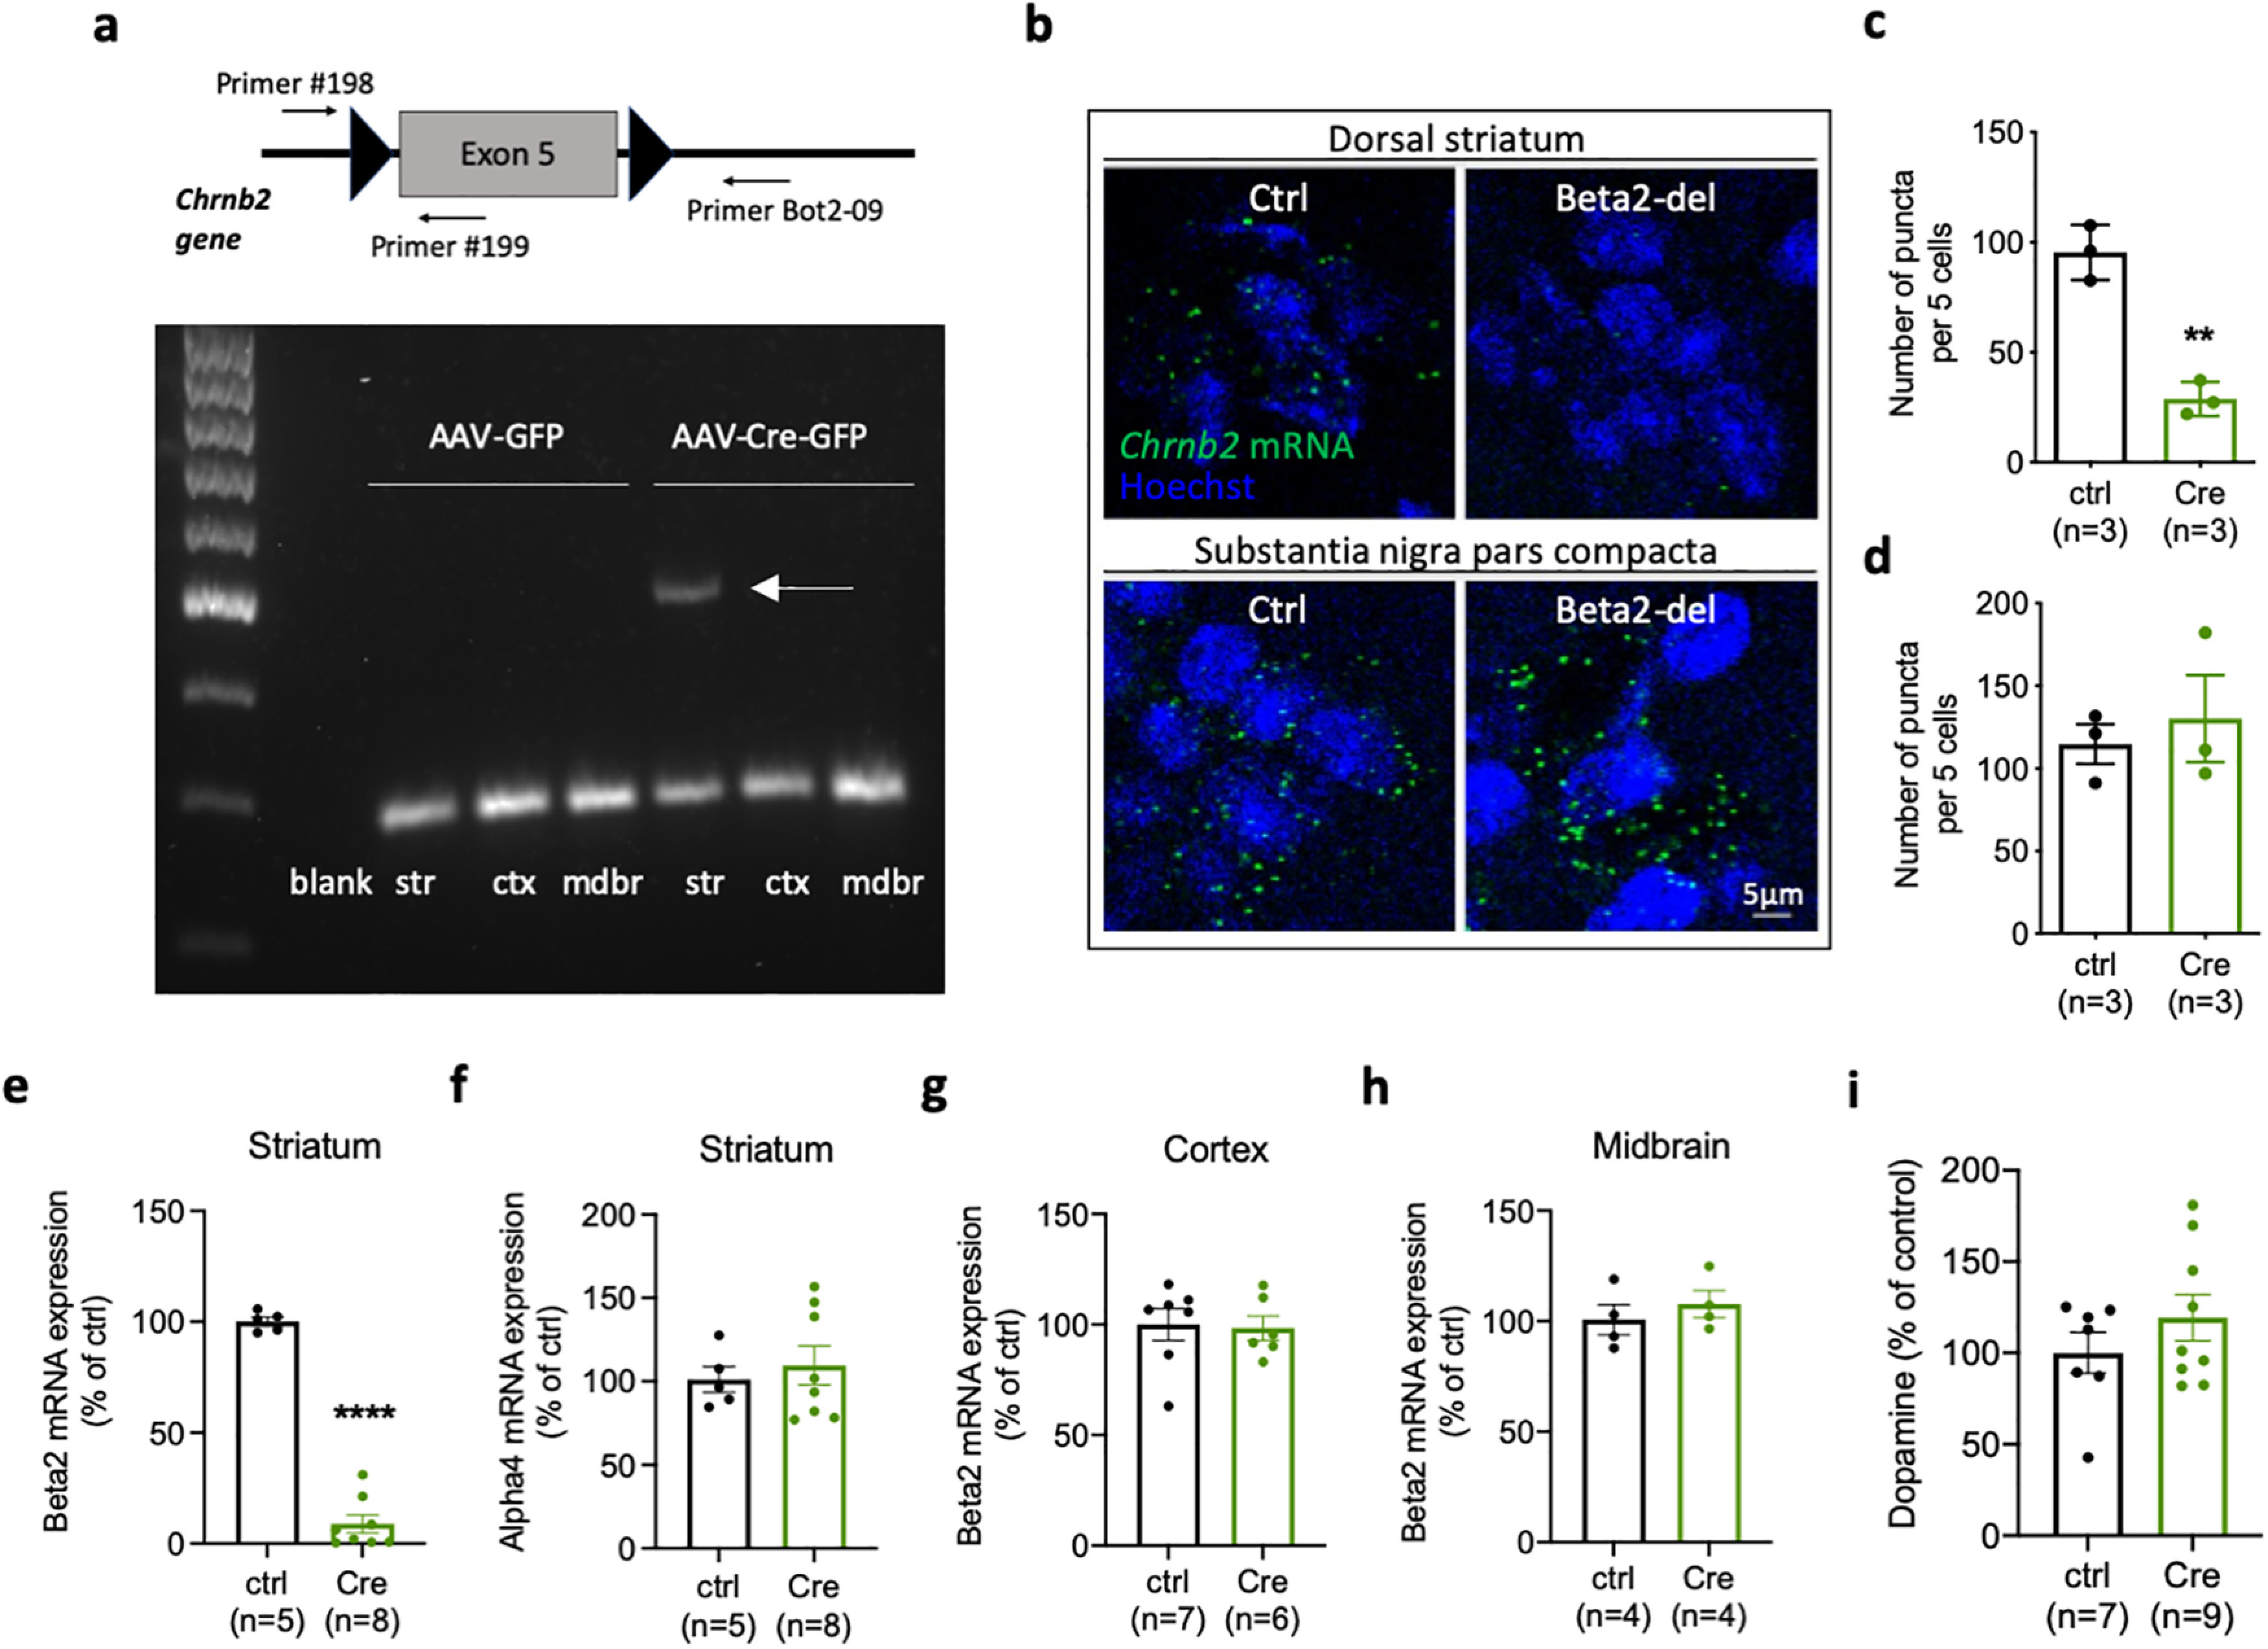
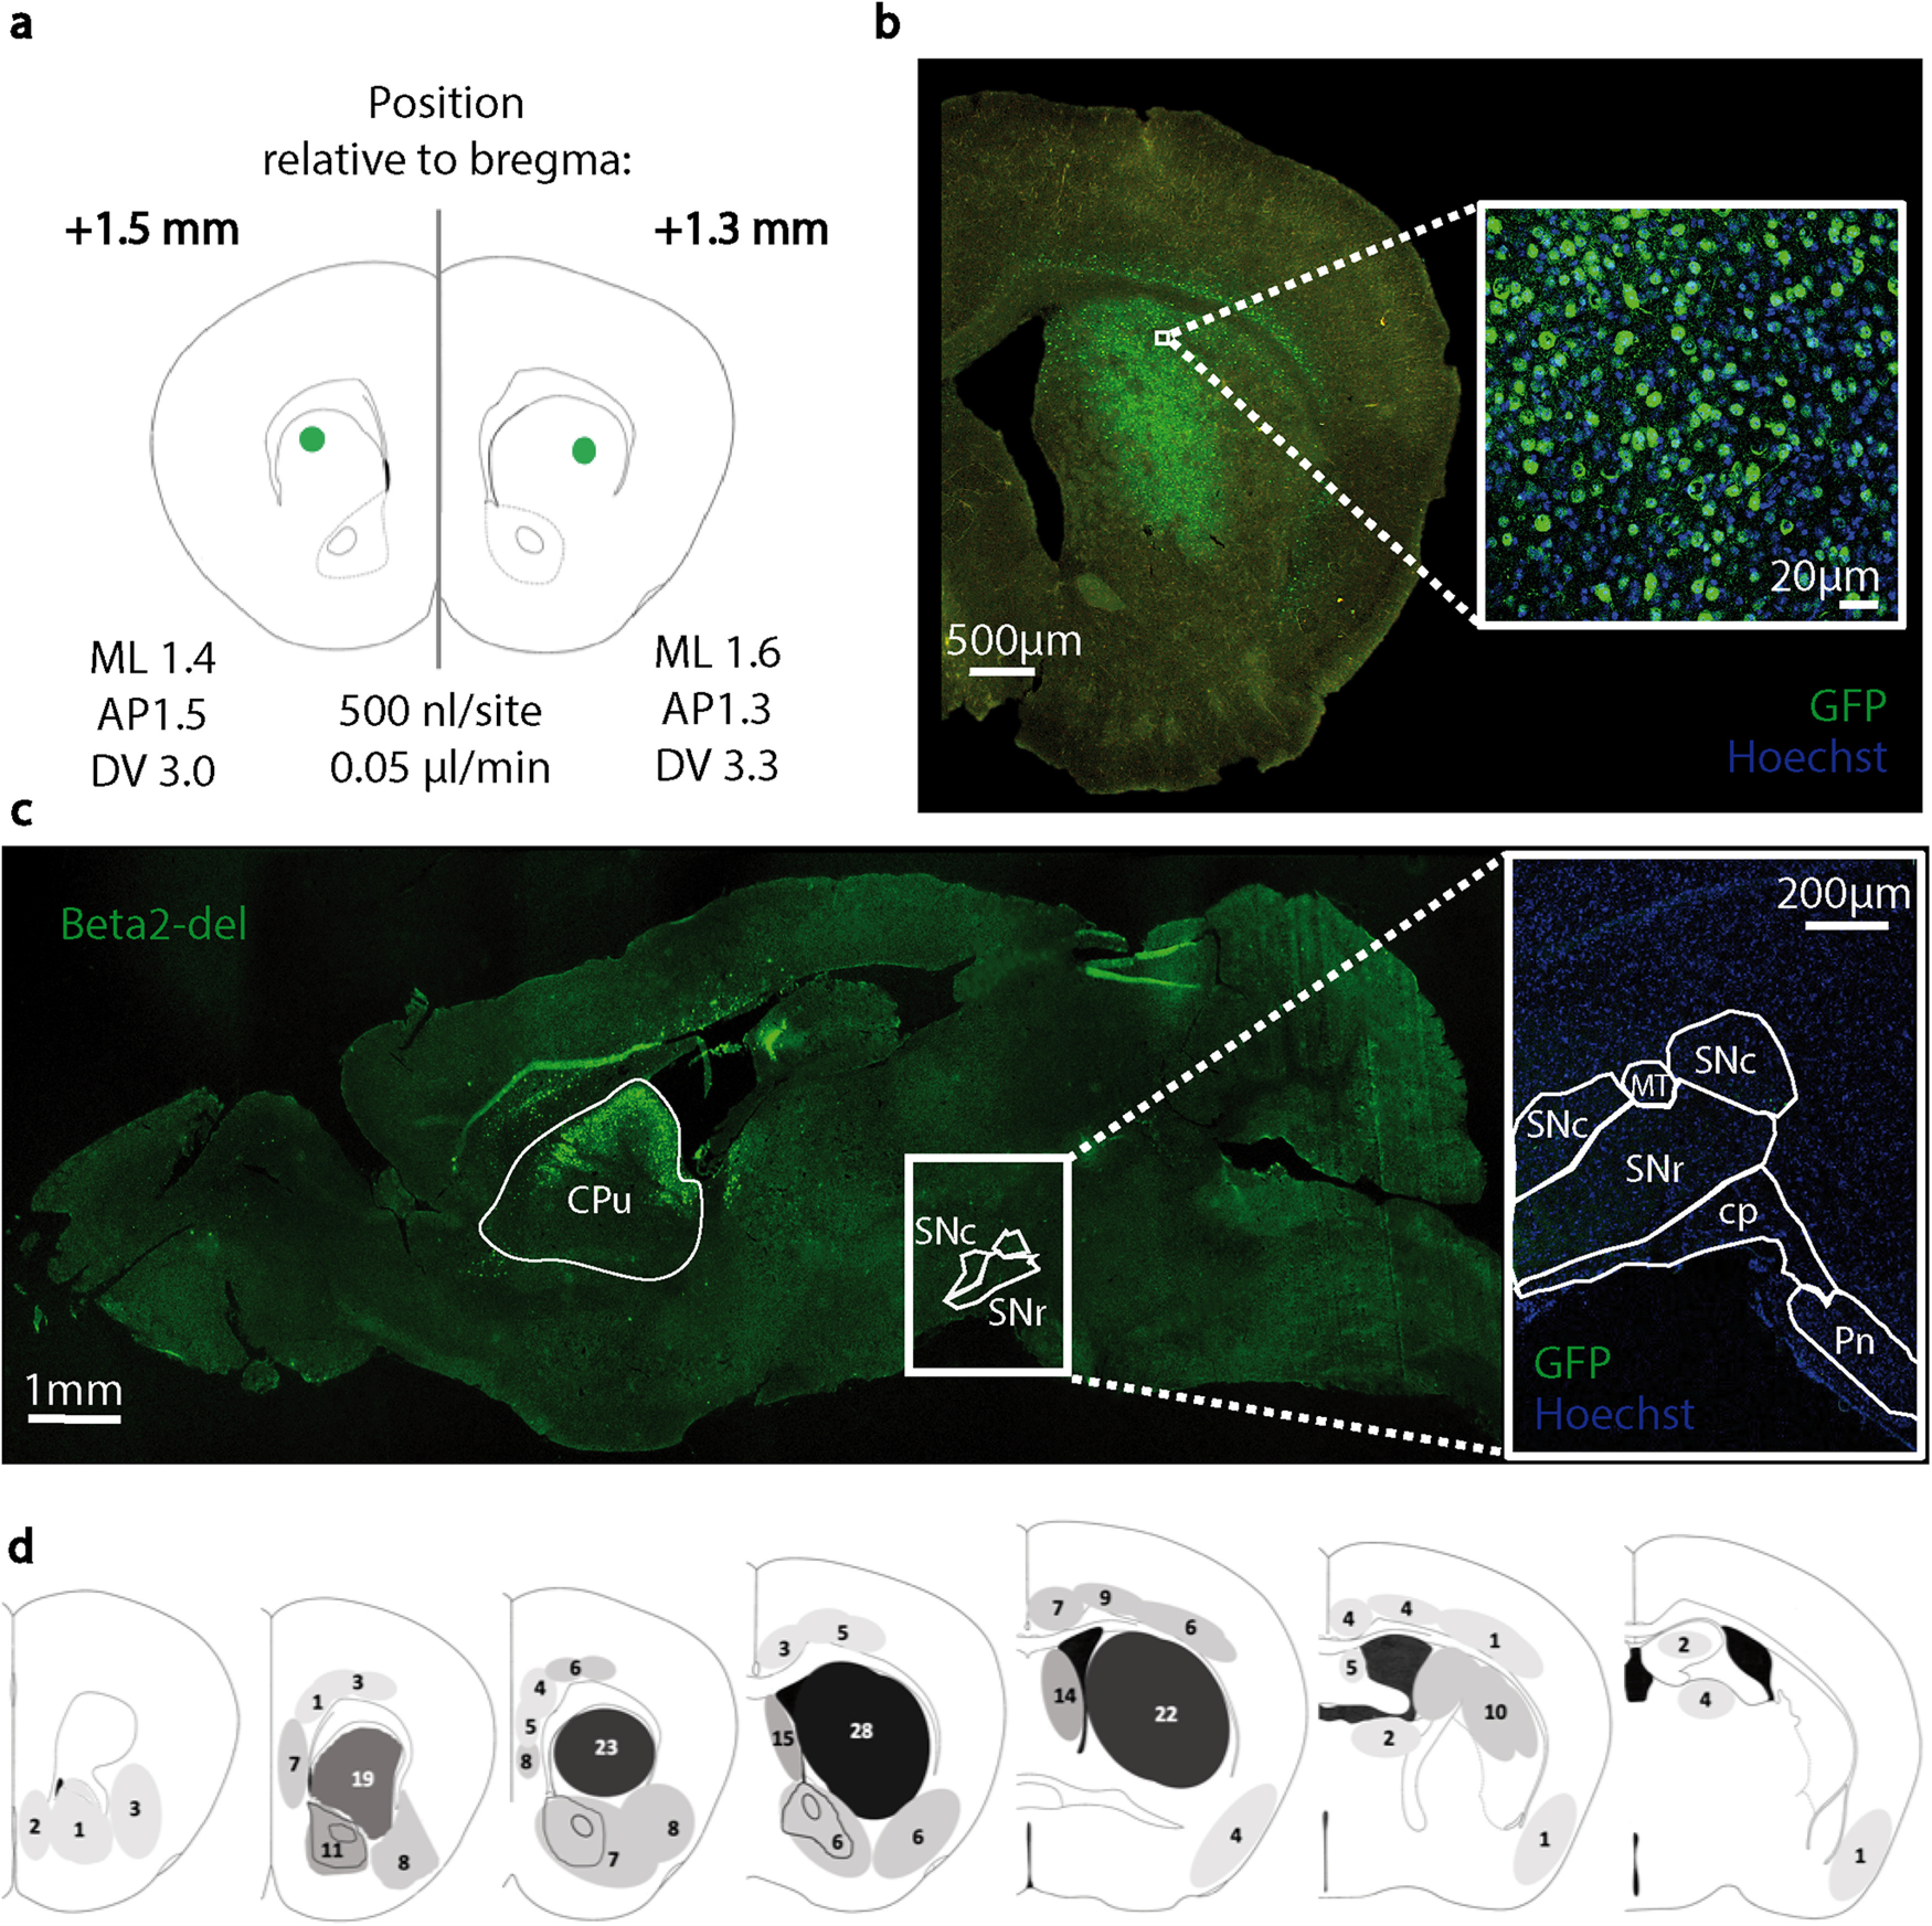
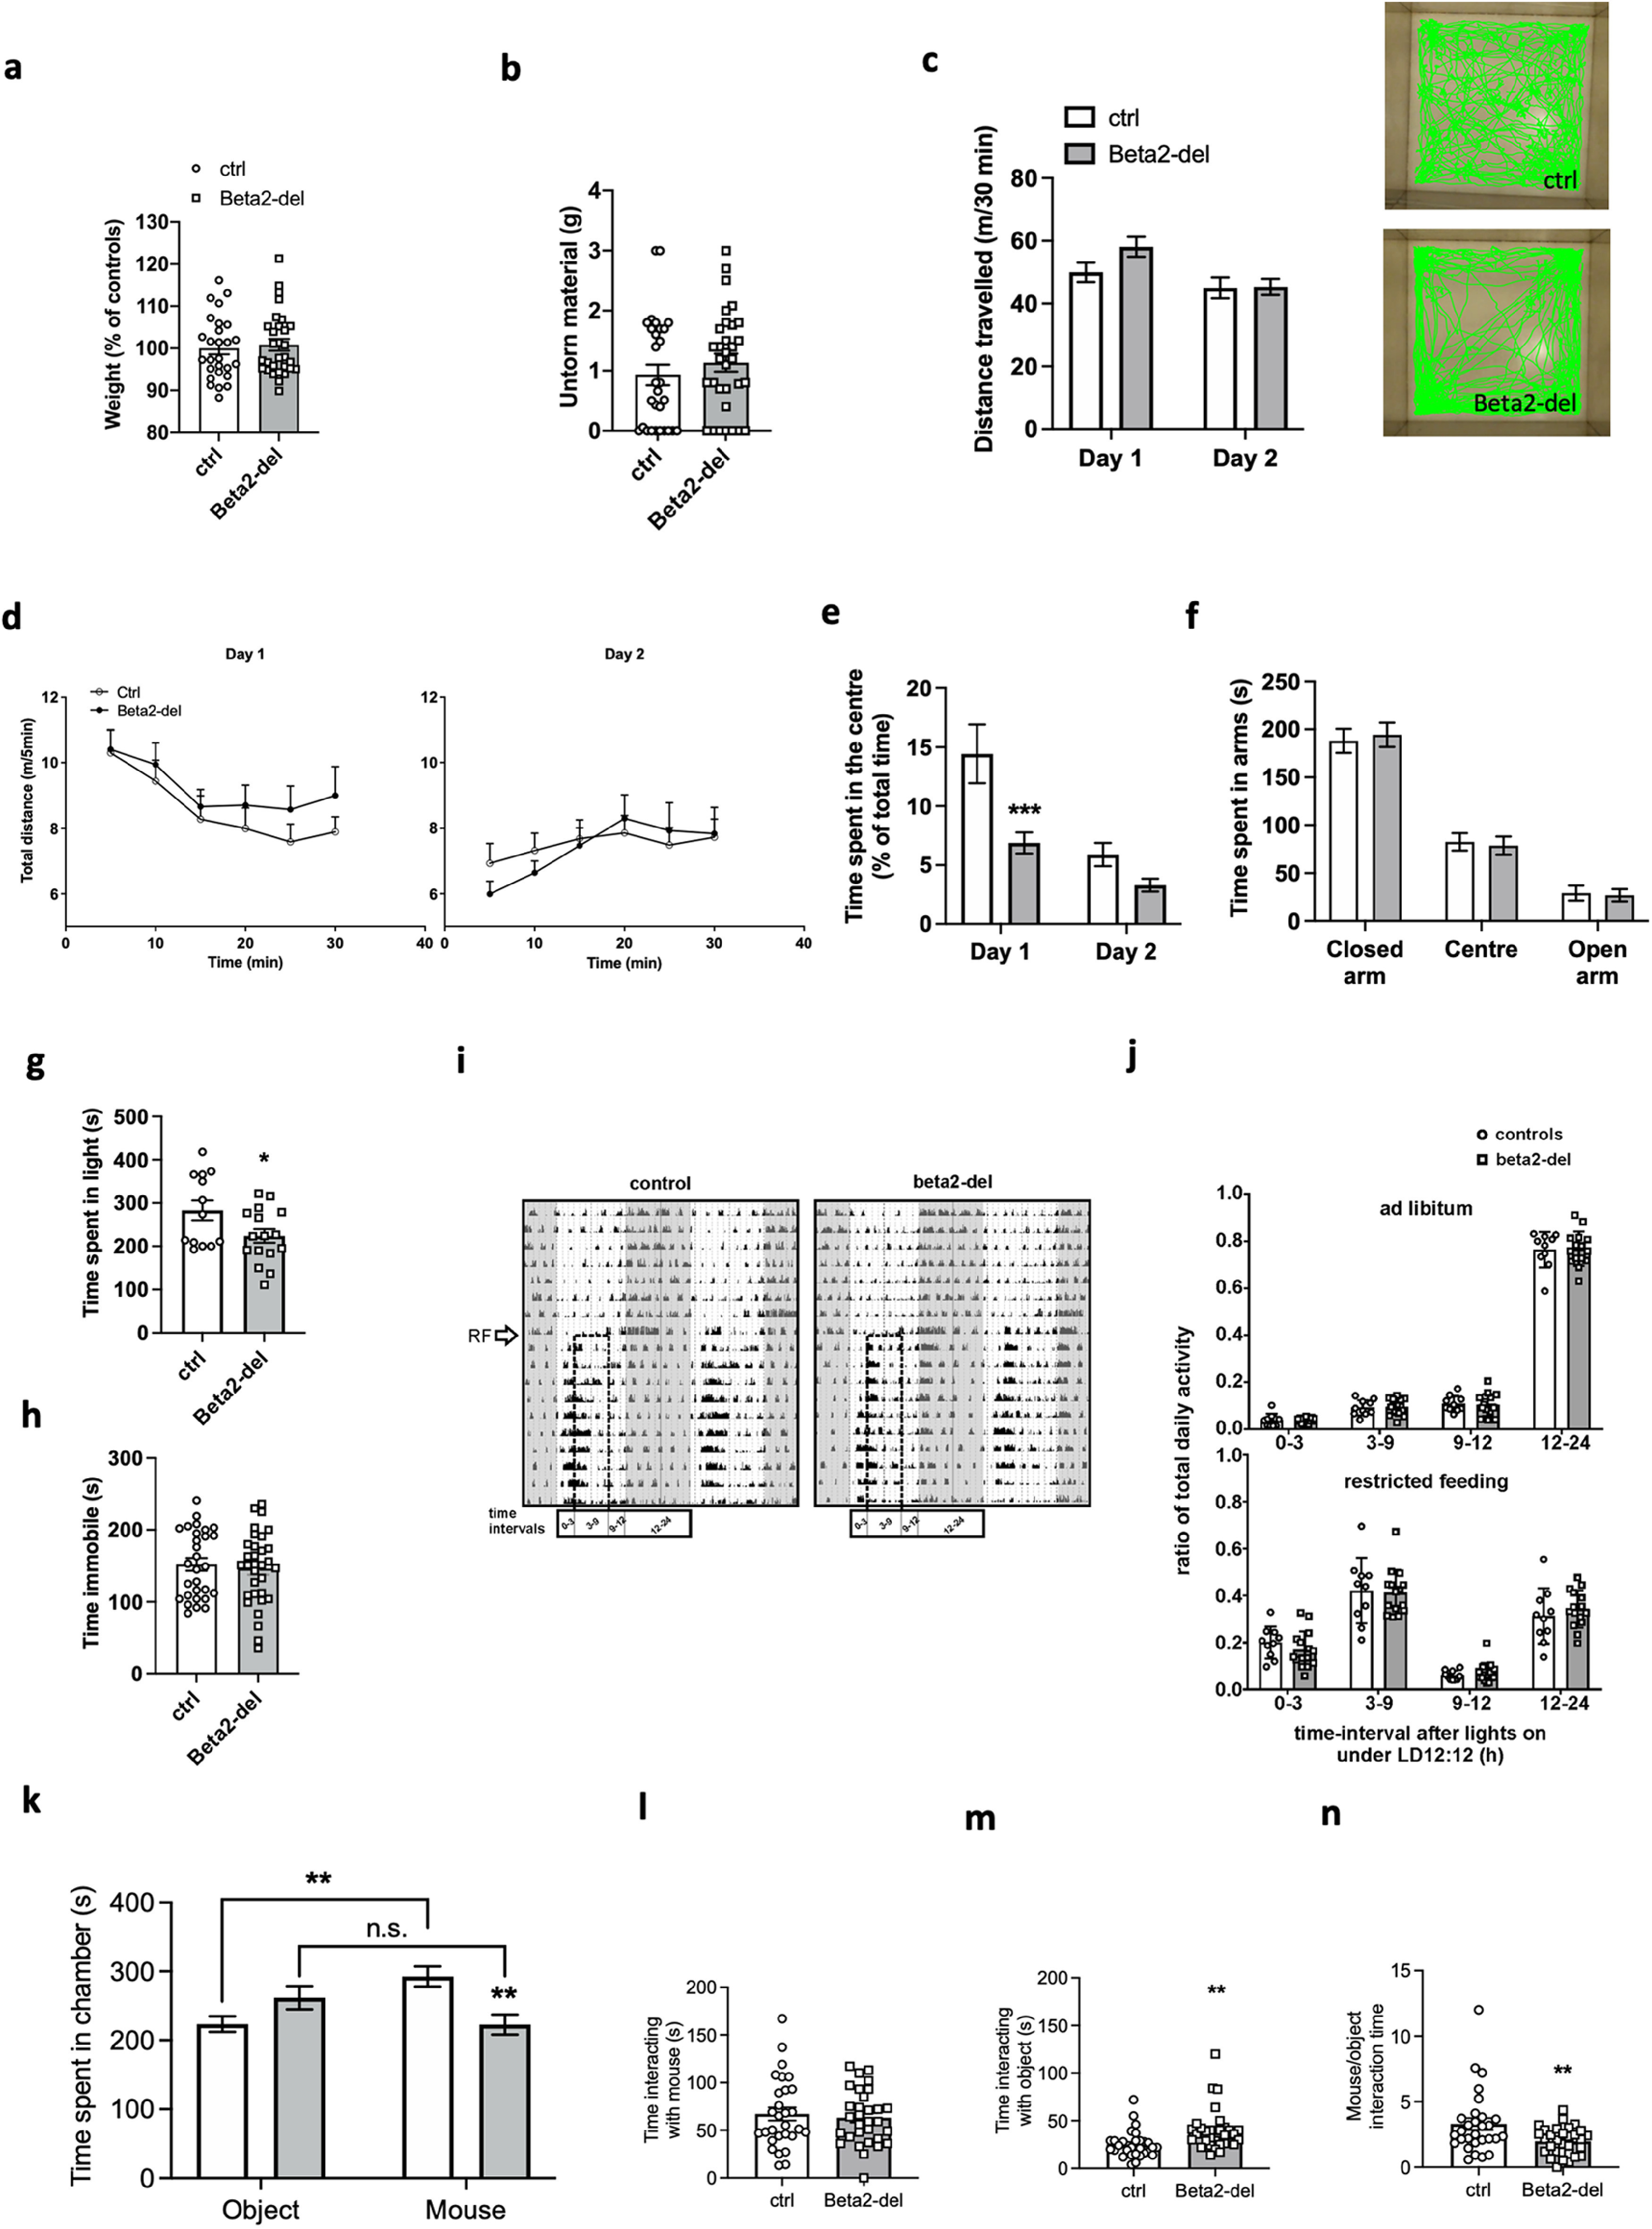
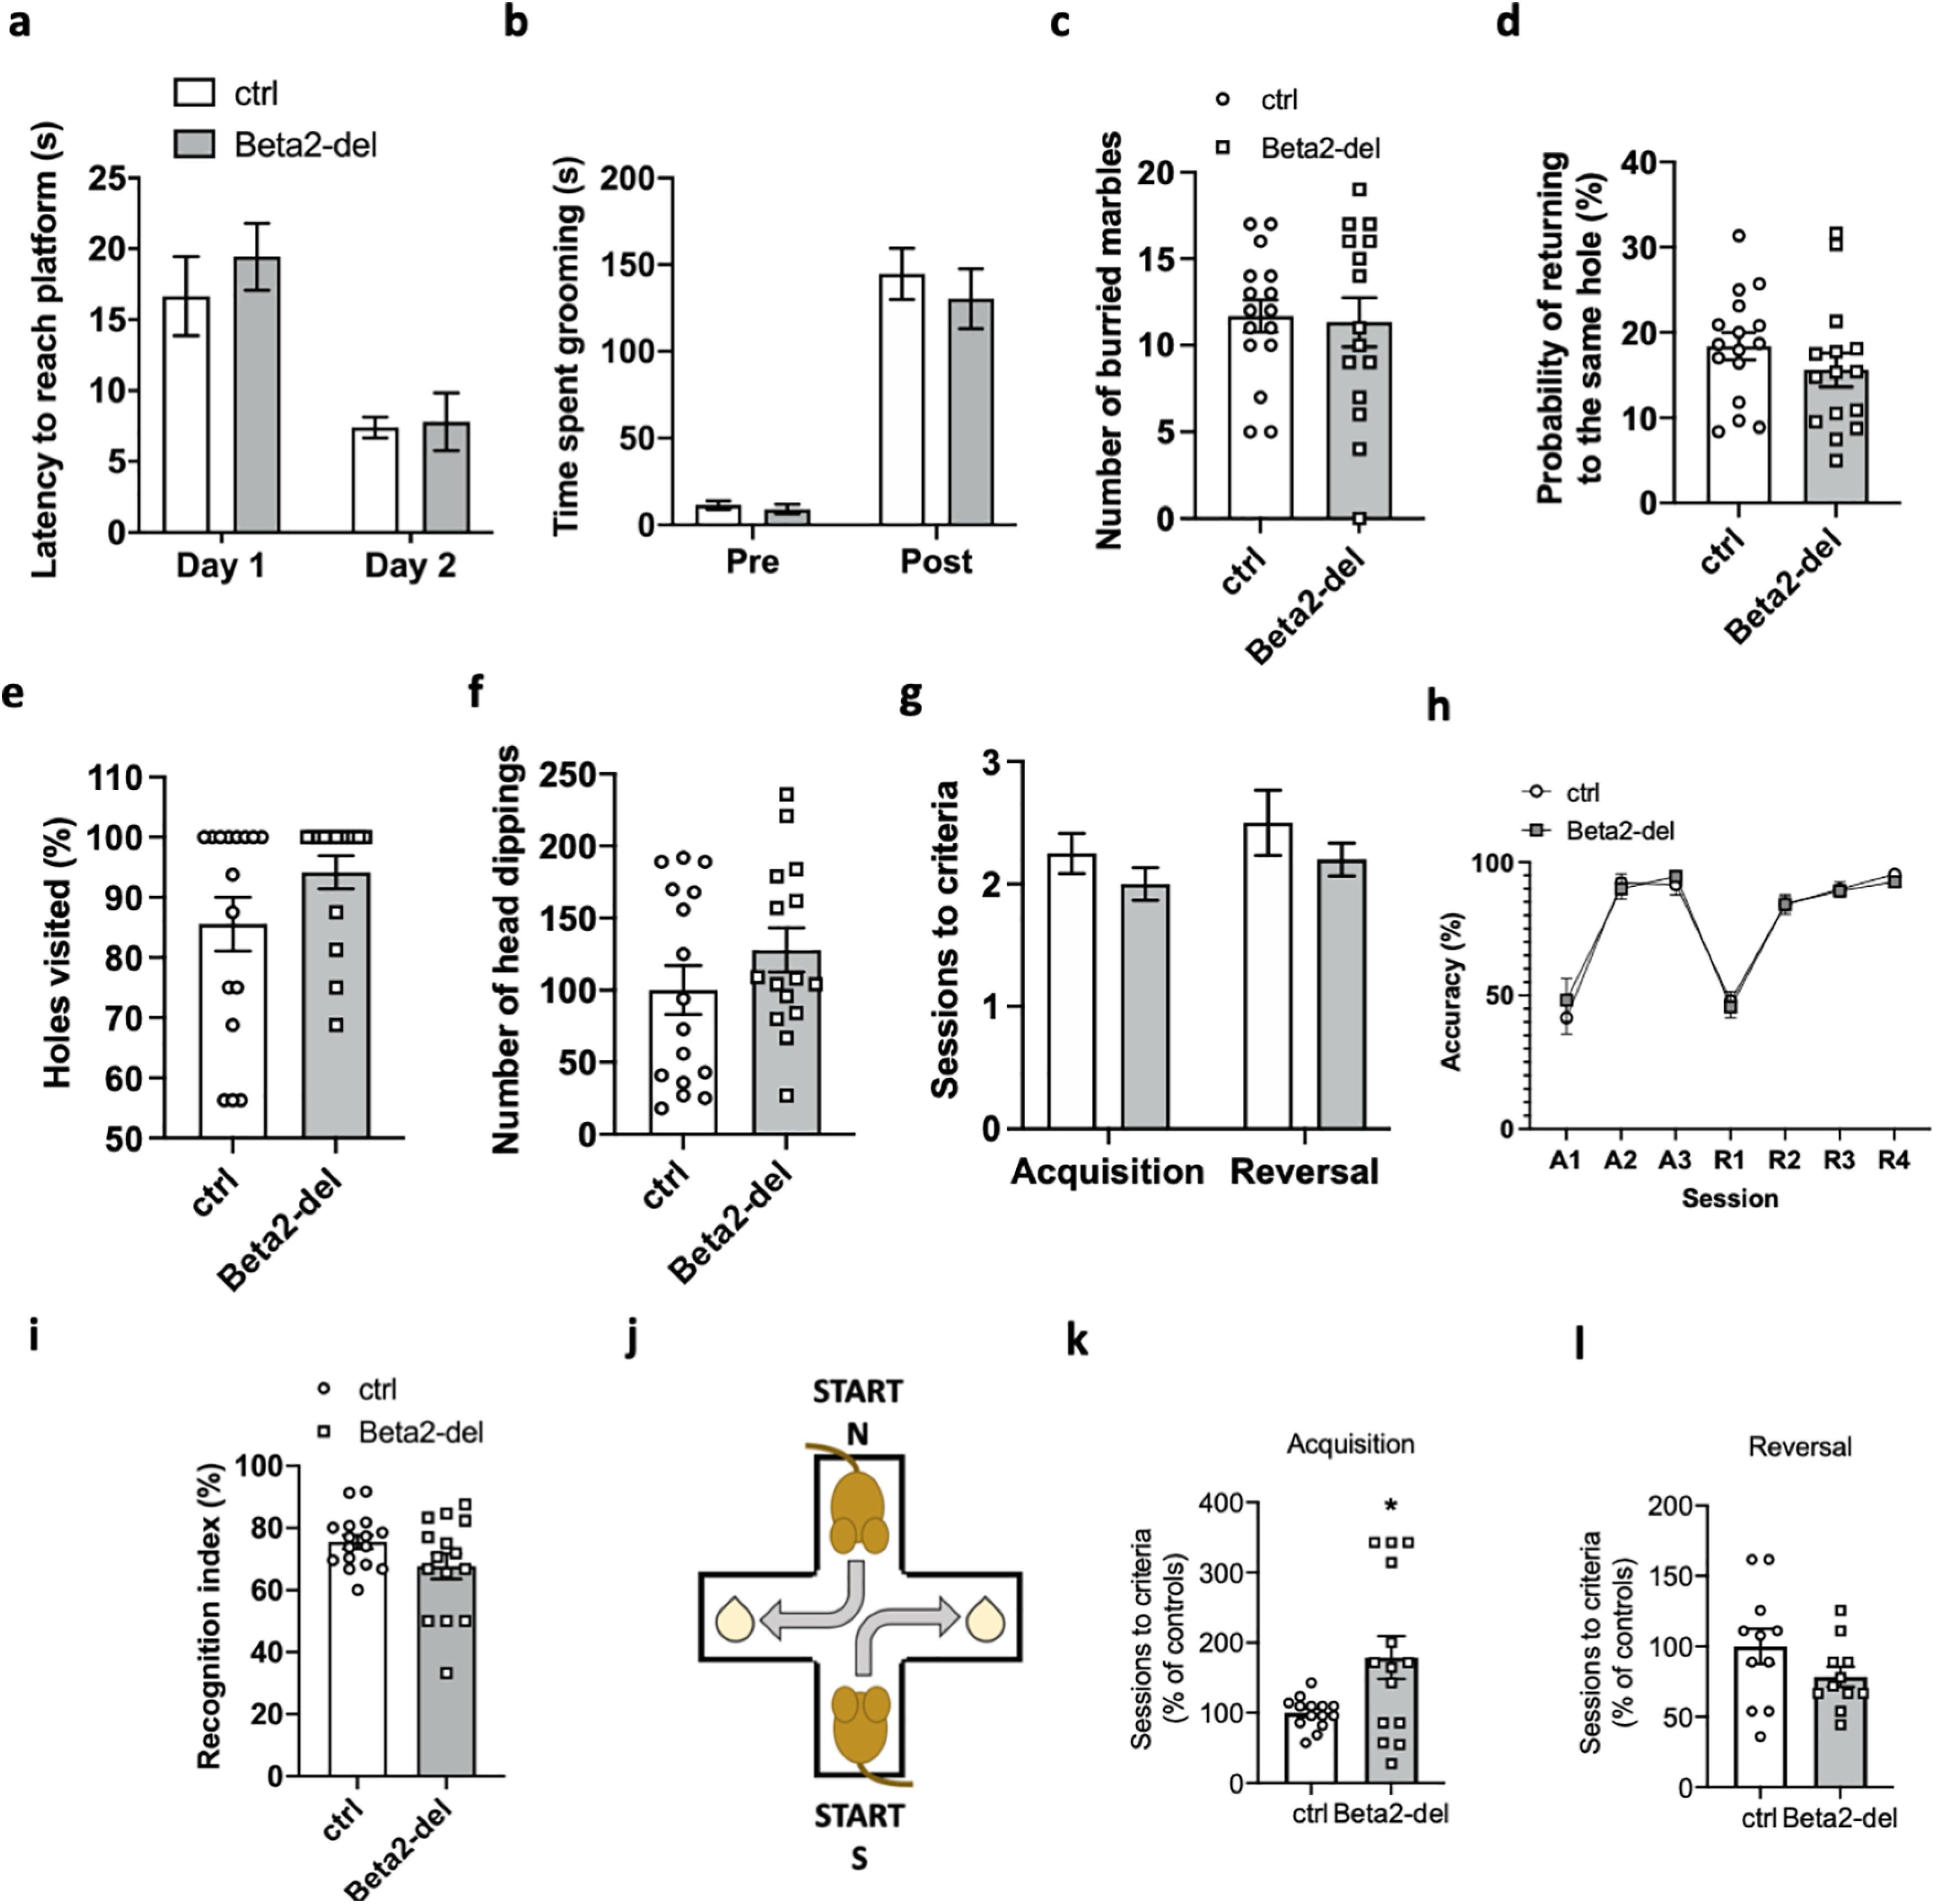
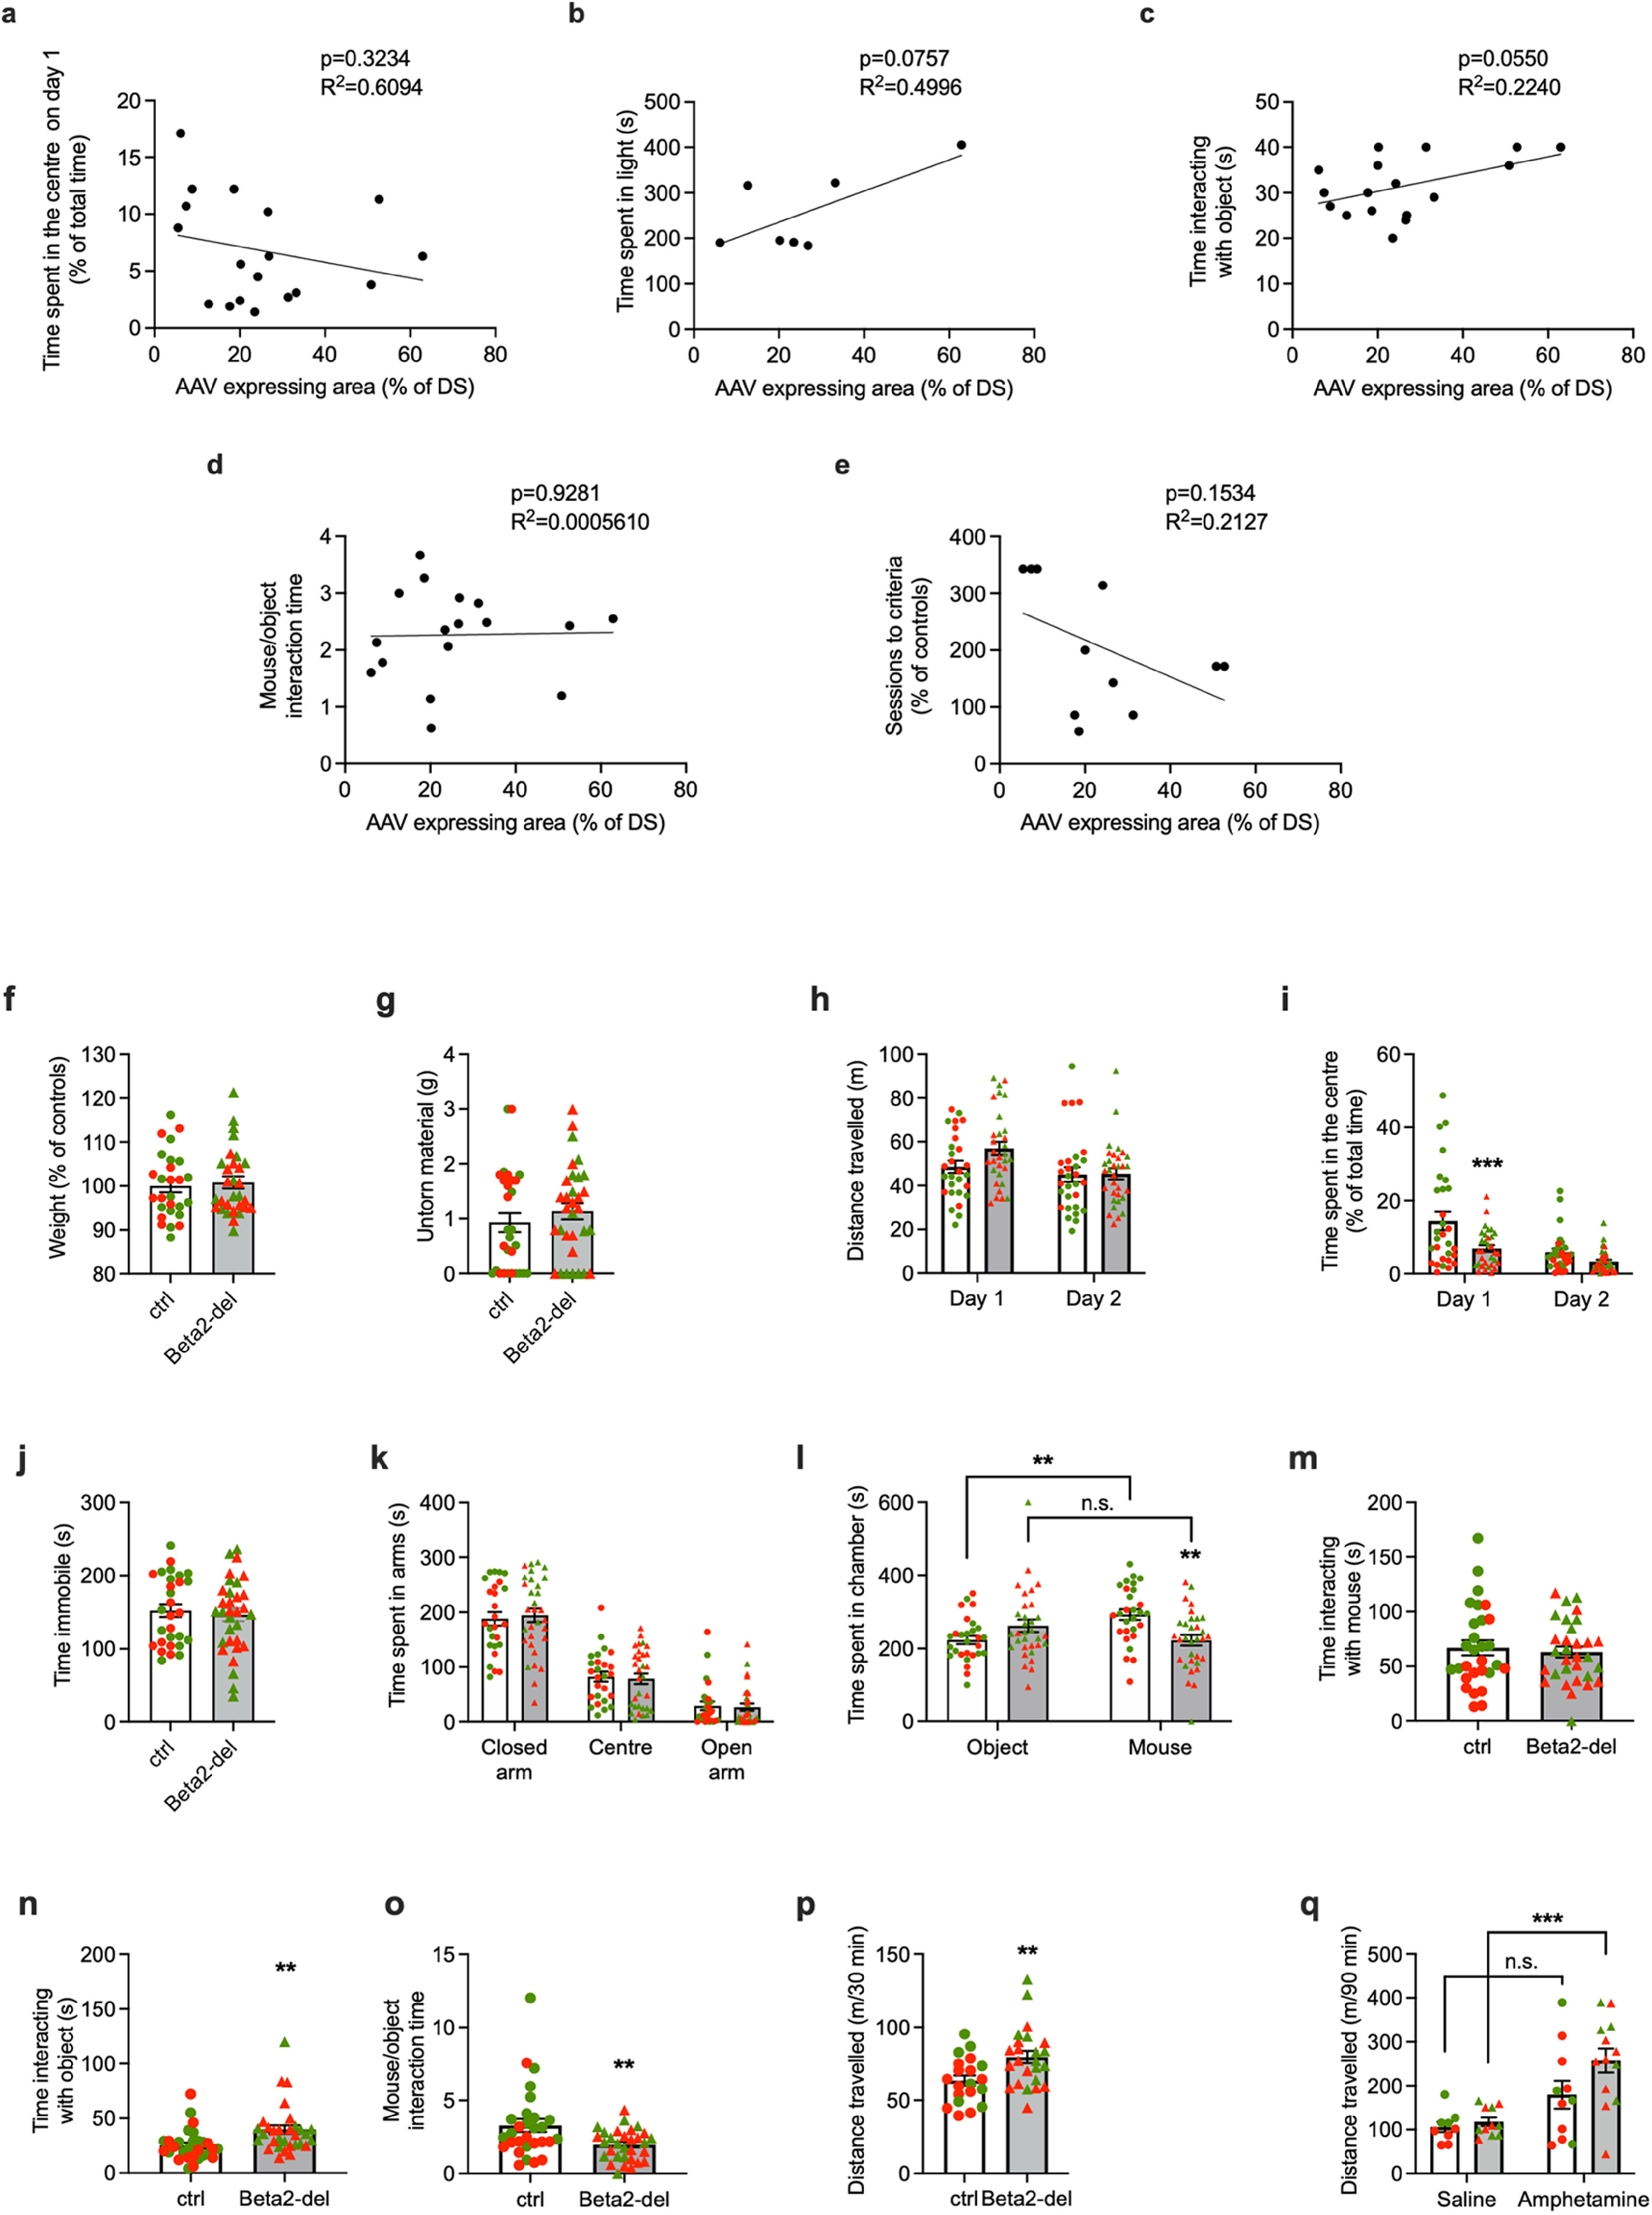
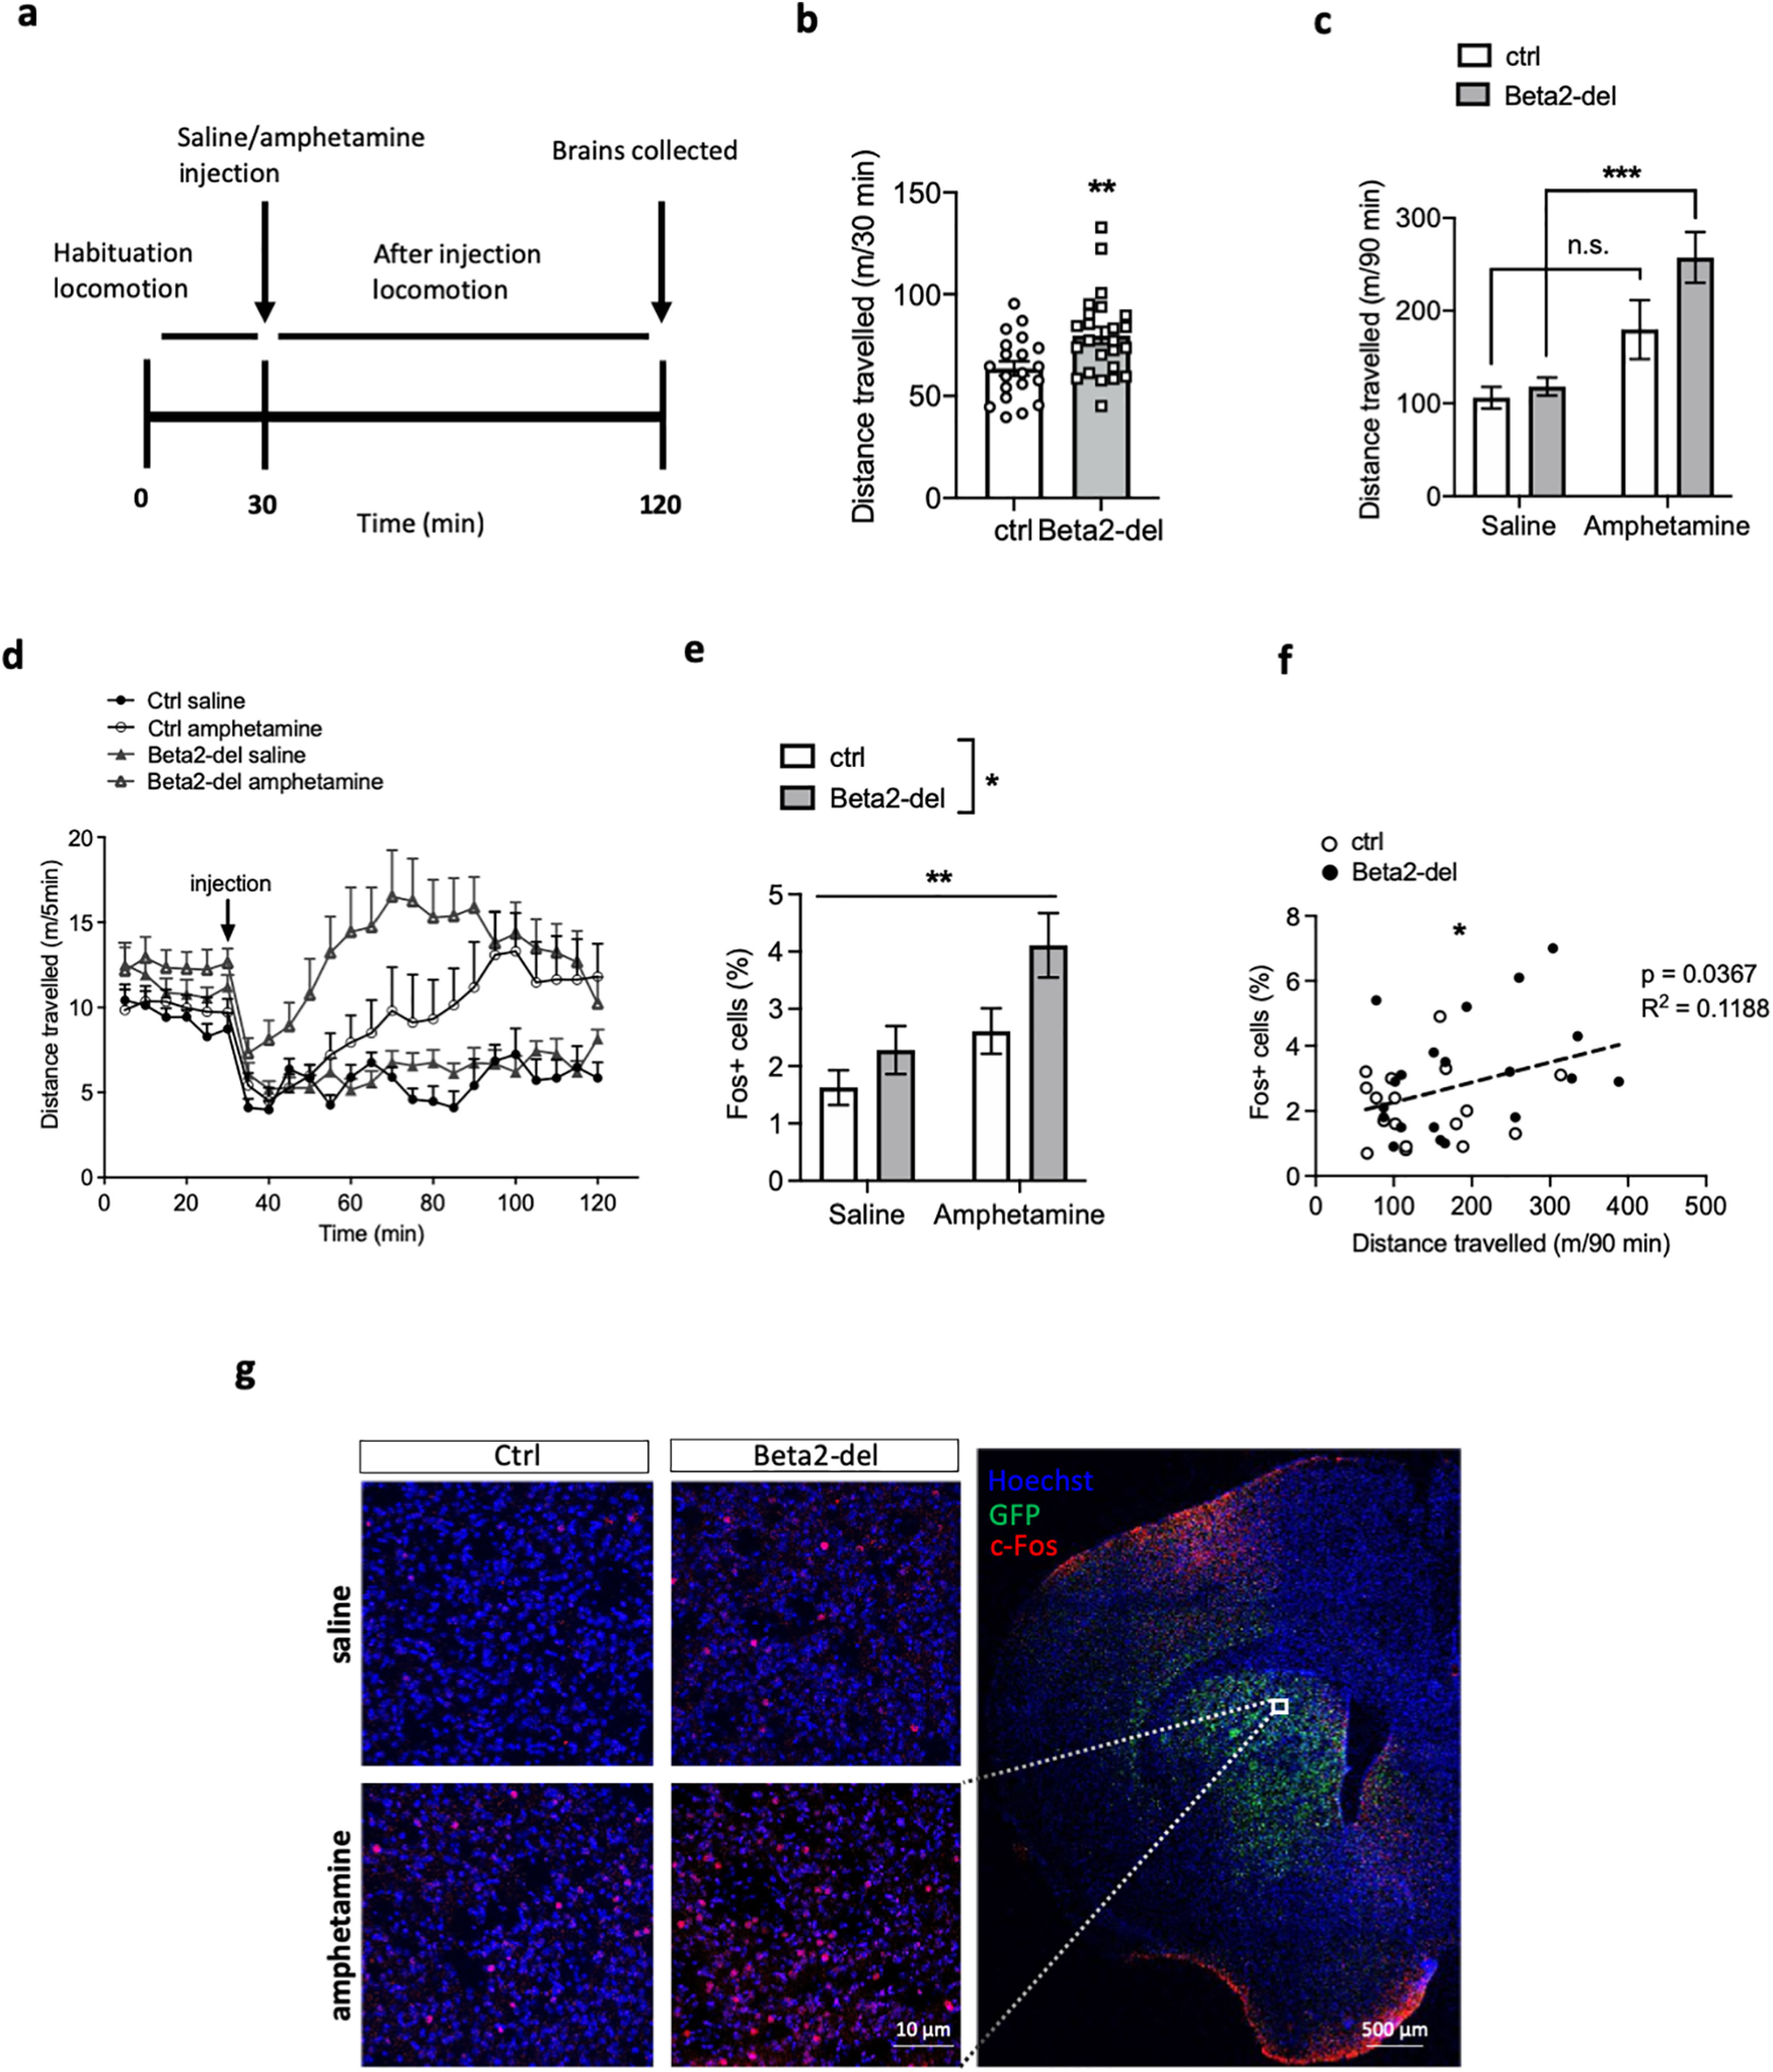
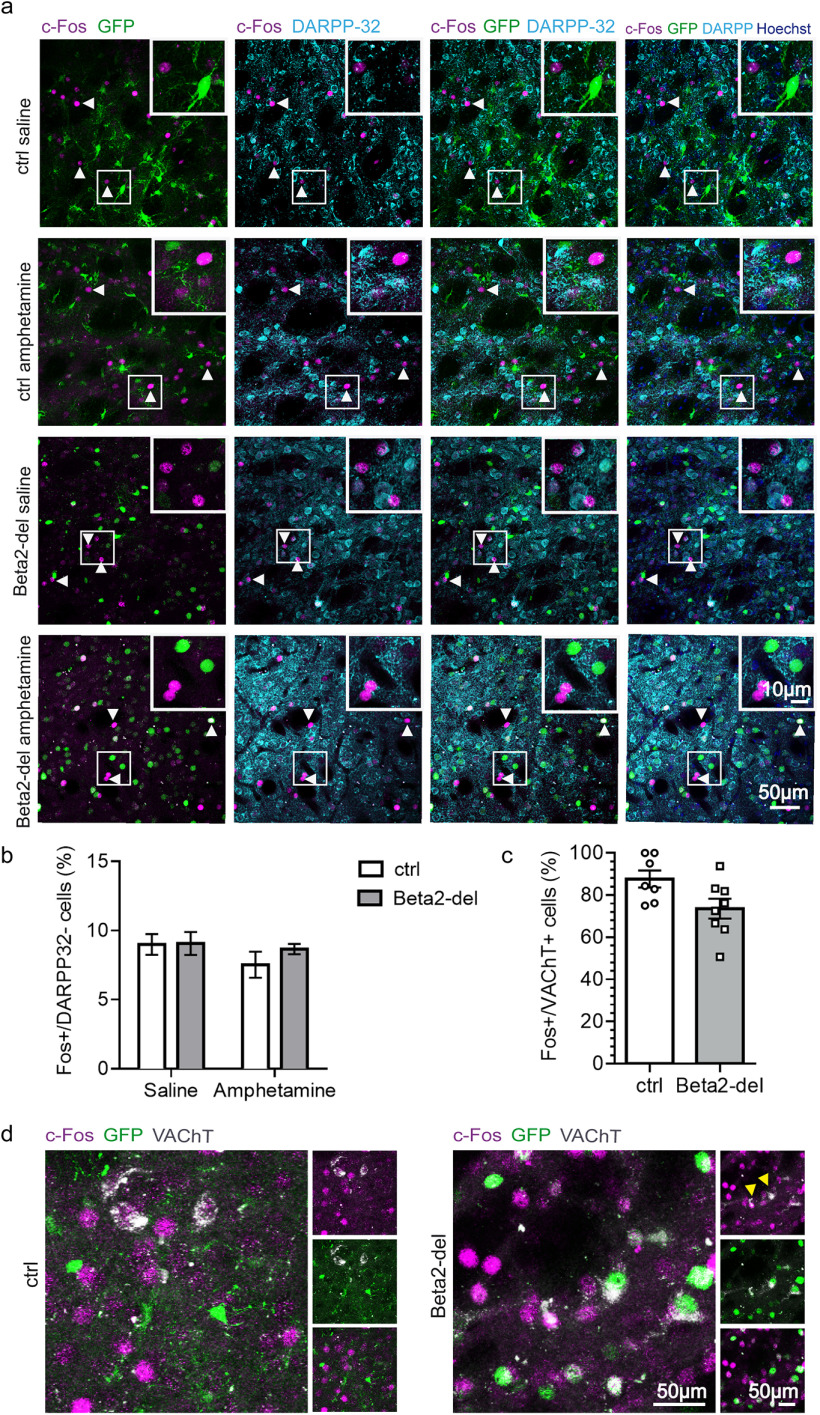
Acetylcholine is an important modulator of striatal activity, and it is vital to controlling striatal-dependent behaviors, including motor and cognitive functions. Despite this significance, the mechanisms determining how acetylcholine impacts striatal signaling are still not fully understood. In particular, little is known about the role of nAChRs expressed by striatal interneurons. In the present study, we used FISH to determine which neuronal types express the most prevalent beta2 nicotinic subunit in the mouse striatum. Our data support a common view that nAChR expression is mostly restricted to striatal interneurons. Surprisingly though, cholinergic interneurons were identified as a population with the highest expression of beta2 nicotinic subunit. To investigate the functional significance of beta2-containing nAChRs in striatal interneurons, we deleted them by injecting the AAV-Cre vector into the striatum of beta2-flox/flox male mice. The deletion led to alterations in several behavioral domains, namely, to an increased anxiety-like behavior, decrease in sociability ratio, deficit in discrimination learning, and increased amphetamine-induced hyperlocomotion and c-Fos expression in mice with beta2 deletion. Further colocalization analysis showed that the increased c-Fos expression was present in both medium spiny neurons and presumed striatal interneurons. The present study concludes that, despite being relatively rare, beta2-containing nAChRs are primarily expressed in striatal neurons by cholinergic interneurons and play a significant role in behavior.SIGNIFICANCE STATEMENT A large variety of nAChRs are expressed in the striatum, a brain region that is crucial in the control of behavior. The complexity of receptors with different functions is hindering our understanding of mechanisms through which striatal acetylcholine modulates behavior. We focused on the role of a small population of beta2-containing nAChRs. We identified neuronal types expressing these receptors and determined their impact in the control of explorative behavior, anxiety-like behavior, learning, and sensitivity to stimulants. Additional experiments showed that these alterations were associated with an overall increased activity of striatal neurons. Thus, the small population of nicotinic receptors represents an interesting target for a modulation of response to stimulant drugs and other striatal-based behavior.

Keywords: Fos; acetylcholine; behavior; interneurons; nAChRs; striatum.


Figures

Figure 1.
Figure 1.
Behavioral tests performed in individual cohorts of mice. The order of tests in each cohort and the approximate age of tested animals are shown. We indicate each month of age with an arrow; each arrow can host 4 dots representing the 4 weeks of the month. On this timeline, we are showing the order of the behavioral tasks in the two different cohorts. The maximum age gap between the youngest and oldest animals in the cohorts is 6 weeks.
Figure 2.
Figure 2.
Chrnb2 expression in individual cell populations in the striatum. a, Expression of Chrnb2 across cell populations from (Muñoz-Manchado et al., 2018). Each point is a cell. Color represents the proportion of cells with the given number of transcripts in each population. The cells below the horizontal red line have no Chrnb2 transcripts. Triangle represents an outlier cell that had 13 reads. b, Differences between groups of cell populations as fitted by a Bayesian hierarchical GLM. Displayed are 50% (thick) and 95% (thin) posterior credible intervals for the difference of a given group (vertical axis) from a baseline group (subplot title). Fold change > 1 indicates that the group on the vertical axis has higher mean expression than the baseline group. ASTRO, astrocytes; ENDO, endothelial cells; OLIGOS, oligodendrocytes; CHAT, CINs; NPY_NGC, NPY-expressing neurogliaform INs; Pthlh, parathyroid hormone like hormone-expressing INs; Pvalb, parvalbumin-expressing INs; Sst, somatostatin-expressing INs; Th, TH-expressing INs; MSND1, D1-expressing MSNs; MSND2, D2-expressing MSNs.
Figure 3.
Figure 3.
Double-labeling riboprobe FISH of serial sections identifying neuronal phenotypes expressing Chrnb2 gene in mouse striatum. a, Overview of Chrnb2 expression in the CPU at bregma 0.5. Red represents Chrnb2. Blue represents DAPI. b, Schematic summary of findings mapping the extent of Chrnb2 and Chat overlap within CPU subnuclei. c–h, Closeups of codetection of Chrnb2 (red) with the following (in green): (c) Chat, (d) Pvalb, (e) Npy, (f) Sst, (g) Drd1, and (h) Drd2. Arrows point to cells positive for one mRNA only (red or green) or double-positive (yellow arrows). i, Quantitative analysis of the proportion of Chat, Pvalb, or Npy gene-expressing neurons in the mouse striatum, displaying Chrnb2 mRNA. j, Quantitative analysis of the proportion of Chrnb2 gene-expressing neurons in mouse striatum displaying also Chat, Pvalb, or Npy mRNA. i, j, Percentage indicates the result of quantification per CPU from 3 male mice. A mean of 700, 1200, 520, and 830 for Chat, Npy, Pvalb, and Sst neurons, respectively, was analyzed per brain. k-m, Htr3a+ cells in mouse coronal brain section. l, Only minimum to none of Htr3a+ cells were found in the CPU. m, Several cells strongly positive for Htr3a are shown in the cortex. Ms, Medial septum; aca, anterior commissure; Ctx, cortex.
Figure 4.
Figure 4.
Striatal injection of AAV-Cre leads to a specific decrease of beta2 mRNA in the striatum of beta2-flox/flox mice. a, Top, Diagram showing exon 5 of the Chrnb2 gene flanked by loxP sites in beta2-flox/flox mice. Locations of the three primers used in the ELFO analysis below are also indicated. Bottom, The ELFO analysis shows samples from two representative mice injected with AAV-GFP or AAV-Cre-GFP in the DS. Bottom row on the gel shows 200 bp products of #198 and #199 primers. Top additional band shows an additional 400 bp product of #198 and Bot2-09 primers indicating excision of exon 5. b, RNAscope visualization of Chrnb2 mRNA in the DS and SNc in two representative mice injected with AAV-GFP or AAV-Cre-GFP. Chrnb2 mRNA puncta are missing in the DS injected with Cre while the SNc of the same animal shows no decrease in puncta density. c, Quantification of Chrnb2 mRNA puncta in the DS. t(4) = 7.824, p = 0.0014, two-tailed t test. d, Quantification of Chrnb2 mRNA puncta in the SNc. t(4) = 0.5321, p = 0.6228, two-tailed t test. e, Chrnb2 mRNA expression analyzed by qRT-PCR in striatal punches from AAV-expressing area of mice injected with AAV-GFP or AAV-Cre-GFP. t(11) = 16.95, p < 0.0001, two-tailed t test. f, Chrna4 mRNA expression analyzed by qRT-PCR in striatal punches from AAV-expressing area. t(11) = 0.5191, p = 0.6140, two-tailed t test. g, h, Chrnb2 mRNA expression analyzed by qRT-PCR in the cortex (g) and midbrain (h). Cortex: t(11) = 0.1788, p = 0.8613; midbrain: t(6) = 0.7645, p = 0.4736; two-tailed t test. i, Concentration of dopamine measured by ELISA in homogenates prepared from mice injected with AAV-GFP or AAV-Cre-GFP. t(14) = 1.106, p = 0.2874, two-tailed t test. Number of samples used for analysis is indicated in graphs. Data are individual values and mean ± SEM. str, Striatum; ctx, cortex; mdbr, midbrain.
Figure 5.
Figure 5.
Expression of the AAV-Cre-GFP virus injected in the DS of beta2-flox/flox mice. a, Scheme of the viral injections, 2 sites per hemisphere (frontal section). b, A representative image of the injection extent in the DS. An enlarged image shows transduction by the AAV5 serotype used in the study. c, A sagittal brain section shows an expression of the AAV-Cre-GFP in the DS and an absence of the viral expression in the midbrain. d, Scheme of the degree of the AAV-Cre-GFP expression in mice used for behavioral testing. Shaded areas represent the extent of expression. Numbers in individual regions indicate the number of mice that showed viral expression in that region. A darker shade is proportional to a higher number of mice showing expression in the region. Two of the animals (of 32) used in behavioral tests died prematurely and were not included in the histologic analysis. ML, mediolateral; AP, anteroposterior; DV, dorsoventral; SNc, substantia nigra pars compacta; SNr, substantia nigra pars reticulata; MT, medial terminal nucleus; cp, cerebral peduncle; Pn, pontine nuclei.
Figure 6.
Figure 6.
Beta2-del mice show increased anxiety-like behavior and changes in the social task. a, Weight of beta2-del and control mice 1 month after surgery. n = 30, n(ctrl) = 27. t(55) = 0.4069, p = 0.6857, two-tailed t test. b, The amount of nestlet material left untorn in the nest building task. n = 32, n(ctrl) = 29. 95% credible interval for difference in untorn material proportion (%) [−0.6; 20], Bayesian GLM. c, Left, Distance traveled during 30 min in the open field task measured on 2 consecutive days. n = 32, n(ctrl) = 29. Effect of group: F(1,59) = 1.255, p = 0.2672; effect of day: F(1,59) = 17.81, p < 0.0001; group versus day interaction: F(1,59) = 3.409, p = 0.0699; two-way ANOVA. Right, Representative track records of a control and beta2-del mouse during the first day in the open field. Note the lower preference for the central part of the arena by the beta2-del mouse. d, Locomotor activity in open field divided into 5 min time bins, measured on day 1 (left) and day 2 (right). e, Time spent in the center of the open field arena measured on 2 consecutive days. n = 32, n(ctrl) = 29. Effect of group: F(1,59) = 8.925, p = 0.0041; effect of day: F(1,59) = 38.56, p < 0.0001; group versus day interaction: F(1,59) = 6.494, p = 0.0134; two-way ANOVA. f, Time spent in the open and closed arms of the EPM apparatus. n = 31, n(ctrl) = 26. Effect of group: F(1,65) = 0.000, p > 0.999; effect of arm: F(2,165) = 138.6, p < 0.0001; genotype versus arm interaction, F(2,65) = 0.1530, p = 0.8583; two-way ANOVA. g, Time spent in the light part of the arena during the light/dark task. n = 16, n(ctrl) = 13. t(27) = 2.184, p = 0.0378; two-tailed t test. h, Time spent immobile during the FST task. n = 32, n(ctrl) = 29. 95% CI for beta2-del/controls ratio [0.88; 1.22], p = 0.658, GLM. i, Representative double-plotted locomotor activity records (actograms) of 1 control (left) and 1 beta2-del (right) mouse. The mice were maintained in the original light/dark cycle (gray area represents darkness), and then they were exposed to a restricted feeding (RF) regimen (arrow) for 10 d. Dashed rectangle represents the time of food availability during 6 h centered to the middle of the light phase. Time intervals during which the activity was compared between the controls and the beta2-del mice are shown at the bottom of the actograms. n = 15, n(ctrl) = 10. j, Comparison of locomotor activity of the control (circles, open column) and the beta2-del (squares, gray column) mice under ad libitum (top) and restricted feeding (bottom) conditions as assessed in four intervals during the 24 h cycle depicted in i. The activity is expressed as the ratio of total daily activity of each mouse. Data were analyzed by multiple t test: top, 0-3, p = 0.7522; 3-9, p = 0.7941; 9-12, p = 0.8045; 12-24, p = 0.8953; bottom, 0-3, p = 0.3174, 3-9, p = 0.8551, 9-12, p = 0.4827, 12-24, p = 0.4526. k, Time spent in the individual chambers of the apparatus during the social preference task. n = 32. n(ctrl) = 28. Effect of group: F(1,116) = 1.158, p = 0.2842; effect of chamber: F(1,116) = 1.041, p = 0.3098; group versus chamber interaction: F(1,116) = 13.43, p = 0.0004; two-way ANOVA. l, Time spent directly interacting with a juvenile mouse during the social preference task. t(58) = 0.4590, p = 0.6480, two-tailed t test. m, Time spent directly interacting with an inanimate object during the social preference task. p = 0.003, GLM. n, Sociability in beta2-del and control mice expressed as a ratio of time spent interacting with a mouse versus time spent interacting with an object. p = 0.009; GLM. Data are mean ± SEM. In selected tasks, we also correlated main behavioral parameters to the extent of AAV expression in the DS (see Fig. 8a–e). In tasks that were performed in all Cohorts 1-4, we analyzed performance of mice divided according to the age (Cohorts 1&2 vs Cohorts 3&4) (see Fig. 8f–q).
Figure 7.
Figure 7.
Beta2-del mice show a deficit in the acquisition of the T-maze task, but they have no impairment of cognitive flexibility. a, Latency to reach a visible platform in the cued-MWM task. n = 15, n(ctrl) = 16. Effect of group: F(1,29) = 0.3785, p = 0.5432; effect of day: F(1,29) = 48.16, p < 0.0001; group versus day interaction: F(1,29) = 0.6274, p = 0.4347; two-way ANOVA. b, Time spent grooming during the grooming test before and after spraying the mice with water. n = 15, n(ctrl) = 16. Effect of group: F(1,58) = 0.5290, p = 0.4699; effect of phase: F(1,58) = 123.5, p < 0.0001; group versus phase interaction: F(1,58) = 0.2765, p = 0.6010; two-way ANOVA. c, Number of buried marbles during the marble burying test. n = 15, n(ctrl) = 16. t(29) = 0.2103, p = 0.8349, two-tailed t test. d, The probability of returning to the same hole during the hole-board test. n = 15, n(ctrl) = 16. t(29) = 1.096, p = 0.2823, two-tailed t test. e, The percentage of visited holes (of 16) during the hole-board test. t(29) = 1.611, p = 0.1180, two-tailed t test. f, The total number of head dippings during the hole-board test. p = 0.27, GLM. g, Number of sessions needed to reach criteria during the acquisition and reversal phase of the instrumental task. n = 11, n(ctrl) = 8. F(1,33) = 2.488, p = 0.1243, mixed-effects model. h, Percentage of correct presses during different stages of a simple instrumental task in the operant box. Effect of group: F(1,17) = 0.01091, p = 0.9180; effect of session: F(2.537,41.44) = 57.05, p < 0.0001; group versus session interaction: F(6,98) = 0.3622, p = 0.9011; mixed-effects model. i, Recognition index in the NOR test. n = 15, n(ctrl) = 16. t(21.56) = 1.708, p = 0.1021, Welch's t test. j, Diagram represents two alternating starting positions in the response-based T-maze task and the respective location of the reward. k, Number of sessions needed to reach learning criteria during the acquisition phase of the T-maze task expressed as percentage of control performance. n = 14, n(ctrl) = 14. t(13.96) = 2.521, p = 0.0245; Welsh's t test. l, Number of sessions needed to reach learning criteria during the reversal phase of the T-maze task expressed as percentage of control performance. n = 11, n(ctrl) = 8. t(20) = 1.497, p = 0.1499, two-tailed t test. Data are mean ± SEM. In selected tasks, we also correlated main behavioral parameters to the extent of AAV expression in the DS (see Fig. 8a–e). In tasks that were performed in all Cohorts 1-4, we analyzed performance of mice divided according to the age (Cohorts 1&2 vs Cohorts 3&4) (see Fig. 8f–q).
Figure 8.
Figure 8.
Additional analysis of selected behavioral tasks. a–e, Main parameters of selected behavioral tasks correlated to AAV expression in the DS. The individual parameters are (a) time spent in the center (%) during the open field test on day 1, (b) time spent in light (s) during the light/dark task, (c) time interacting with object (s) during the social preference test, (d) mouse/object interaction time (ratio) during the social preference test, and (e) number of sessions needed to reach performance criteria in the acquisition phase of the T-maze task. None of the parameters shows a significant correlation with the AAV expression, although the correlation almost reaches significance in c. f–q, Graphs represent split performance for Cohorts 1&2 versus Cohorts 3&4. Individual performances corresponding to mice in Cohorts 1&2 (green circles and triangles represent controls and beta2-del, respectively) and Cohorts 3&4 (red circles and triangles represent controls and beta2-del, respectively) are shown. Only tests that were performed in both cohorts are shown: (f) weight after surgery, (g) nest building test, (h,i) locomotion in the open field, (j) FST, (k) EPM, (l–o) social preference task, and (p,q) locomotion in amphetamine experiment before (p) and after (q) injection. When performance of ctrl and beta2-del mice was analyzed separately for Cohorts 1&2 versus Cohorts 3&4, only the difference in “Time interacting with object” (n) reached the significance in both cohorts before pooling the data.
Figure 9.
Figure 9.
Beta2-del mice are hyperactive and show higher amphetamine-induced c-Fos expression compared with controls. a, Diagram showing the experimental design. b, Distance traveled during the 30 min of habituation (pre-injection) in the open field. n = 24, n(ctrl) = 20. t(42) = 2.877, p = 0.0063, two-tailed t test. c, Distance traveled in the open field for the 90 min following an acute saline or amphetamine injection. n(saline/amphetamine) = 11/13, n(ctrl; saline/amphetamine) = 9/11. Effect of group: F(1,40) = 3.519, p = 0.068; effect of treatment: F(1,40) = 19.75, p < 0.0001; group versus treatment interaction: F(1,40) = 1.886, p = 0.1773; two-way ANOVA. d, Locomotion during the amphetamine experiment divided into 5 min time bins. We also analyzed distance traveled before and after injection in individual cohorts of mice divided according to the age (Cohorts 1&2 vs Cohorts 3&4) (see Fig. 8p,q). e, Analysis of c-Fos expression in the DS of beta2-del and control mice injected either with saline or amphetamine. n(saline/amphetamine) = 11/9, n(ctrl; saline/amphetamine) = 8/9. An average of 1000 nuclei per picture were analyzed in 6 brain sections per mouse. Effect of group: F(1,33) = 5.958, p = 0.0202; effect of treatment: F(1,33) = 10.15, p = 0.0031; group versus treatment interaction: F(1,33) = 0.9106, p = 0.3469; two-way ANOVA. f, Distance traveled after injection correlated to c-Fos expression. g, Right, Representative section counterstained with Hoechst showing GFP and c-Fos expression. White square represents a typical area in the DS that was used for c-Fos analysis. Left, Representative images counterstained with Hoechst showing baseline and amphetamine-induced c-Fos expression in beta2-del and control animals. Data are mean ± SEM.
Figure 10.
Figure 10.
c-Fos-expressing neurons include both DARPP-32+ MSNs and DARPP-32 INs. a, Representative images showing baseline and amphetamine-induced c-Fos expression in beta2-del and control animals in combination with DARPP-32 and GFP staining (indicating the AAV-expressing area with presumed beta2 deletion). From the left, Merged images represent the following: c-Fos double labeling with GFP; c-Fos double labeling with DARPP-32; c-Fos triple labeling with GFP and DARPP-32; the combination of the three markers over Hoechst counterstain for nuclei. White arrowheads highlight c-Fos-positive cells, not expressing DARPP-32. White squares represent closeups on the c-Fos+/DARPP-32 cells. b, Number of c-Fos+ and DARPP-32 cells expressed as percentage of all c-Fos+ neurons in beta2-del and control mice injected with either saline or amphetamine. n(saline/amphetamine) = 3/3, n(ctrl; saline/amphetamine) = 3/3. An average of 25 c-Fos+, DARPP-32 neurons were analyzed in two brain sections per mouse. Effect of group: F(1,8) = 0.6286, p = 0.4507; effect of treatment: F(1,8) = 1.541, p = 0.2497; group versus treatment interaction: F(1,8) = 0.4934, p = 0.5023; two-way ANOVA. c, Number of c-Fos+ neurons out of all VAChT+ neurons in control and beta2-del mice. Saline and amphetamine-injected mice were pooled together in each group. n(ctrl) = 7, n(beta2-del) = 8. An average of 23 VAChT+ neurons were analyzed in 4 brain sections per mouse. The 95% credible interval for the odds ratio between ctrl and beta2-del [0.09; 1.02], generalized linear mixed model. Data are mean ± SEM. d, Representative images showing amphetamine-induced c-Fos expression in control and beta2-del animals in combination with VAChT and GFP staining (indicating the AAV-expressing area with presumed beta2 deletion). Left, Two main panels represent merged images for the three markers c-Fos (magenta), GFP (green), and VAChT (gray). Right, Different combinations of two markers are shown, c-Fos/VAChT, GFP/VAChT, and c-Fos/GFP. Yellow arrowheads indicate two VAChT+/c-Fos CINs in beta2-del animal.

References

    1. Angoa-Pérez M, Kane MJ, Briggs DI, Francescutti DM, Kuhn DM (2013) Marble burying and nestlet shredding as tests of repetitive, compulsive-like behaviors in mice. J Vis Exp. Advance online publication. Retrieved Dec 24, 2013. doi: 10.3791/50978. - DOI - PMC - PubMed
    1. Assous M (2021) Striatal cholinergic transmission: focus on nicotinic receptors' influence in striatal circuits. Eur J Neurosci 53:2421–2442. 10.1111/ejn.15135 - DOI - PMC - PubMed
    1. Assous M, Faust TW, Assini R, Shah F, Sidibe Y, Tepper JM (2018) Identification and characterization of a novel spontaneously active bursty GABAergic interneuron in the mouse striatum. J Neurosci 38:5688–5699. 10.1523/JNEUROSCI.3354-17.2018 - DOI - PMC - PubMed
    1. Assous M, Kaminer J, Shah F, Garg A, Koos T, Tepper JM (2017) Differential processing of thalamic information via distinct striatal interneuron circuits. Nat Commun 8:15860. 10.1038/ncomms15860 - DOI - PMC - PubMed
    1. Avale ME, Chabout J, Pons S, Serreau P, De Chaumont F, Olivo-Marin JC, Bourgeois JP, Maskos U, Changeux JP, Granon S (2011) Prefrontal nicotinic receptors control novel social interaction between mice. FASEB J 25:2145–2155. 10.1096/fj.10-178558 - DOI - PubMed

Publication types

LinkOut - more resources