

Genetic associations with carotid intima-media thickness link to atherosclerosis with sex-specific effects in sub-Saharan Africans
- PMID: 35165267
- PMCID: PMC8844072
- DOI: 10.1038/s41467-022-28276-x
Genetic associations with carotid intima-media thickness link to atherosclerosis with sex-specific effects in sub-Saharan Africans
Abstract
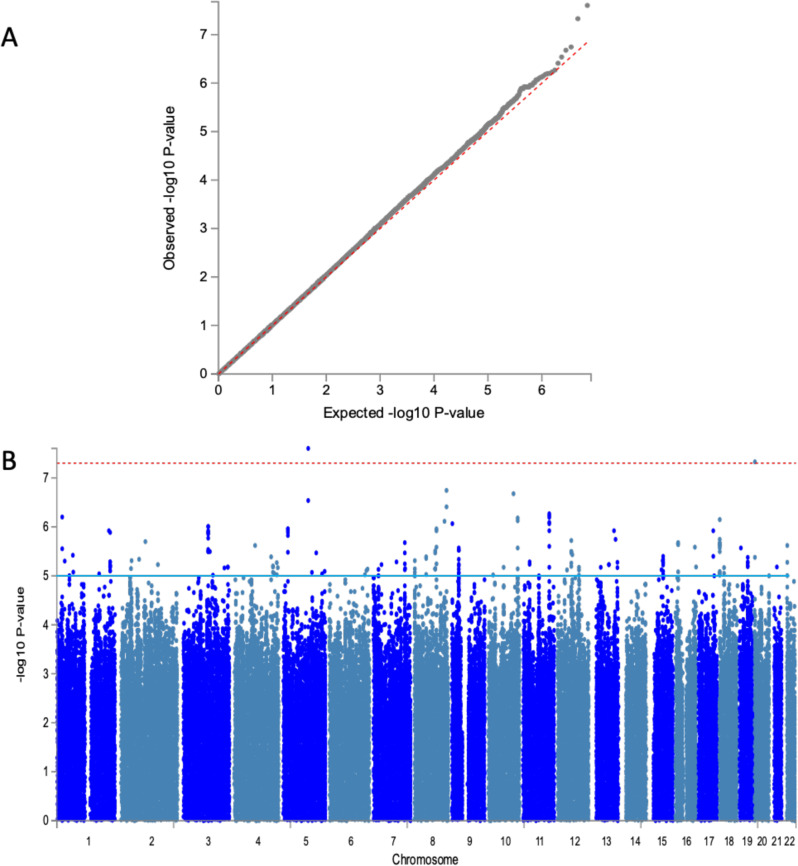
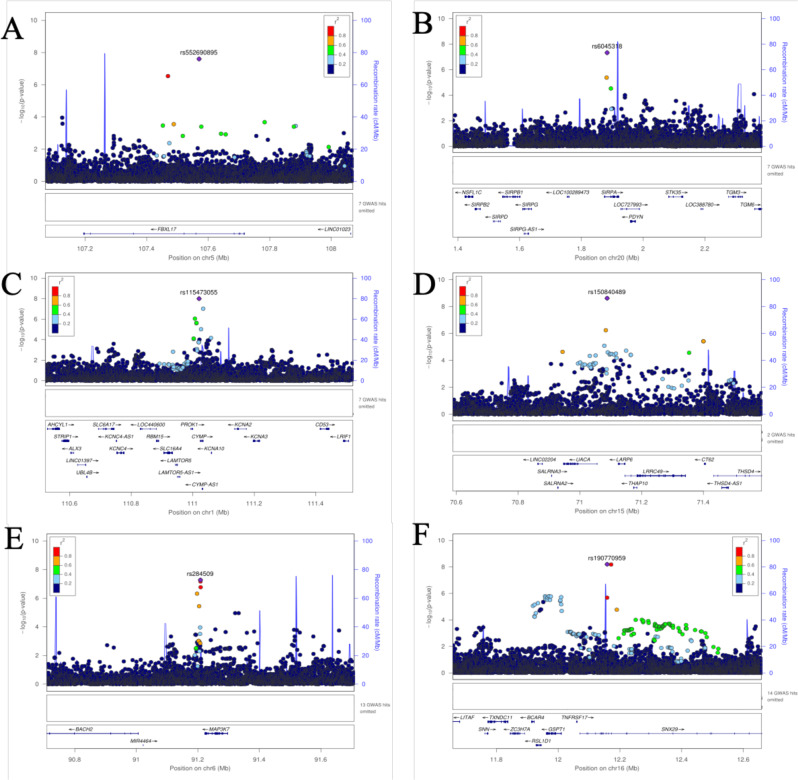
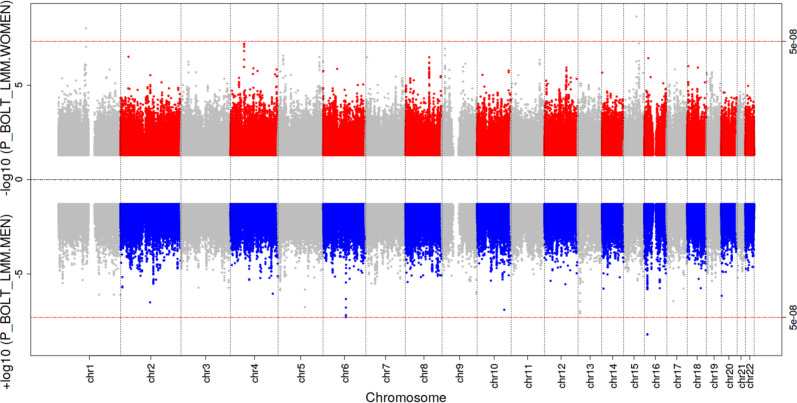
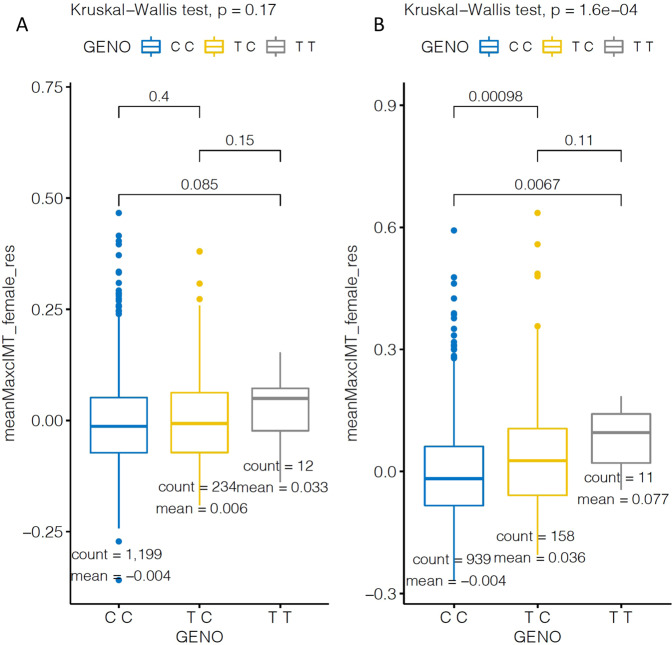
Atherosclerosis precedes the onset of clinical manifestations of cardiovascular diseases (CVDs). We used carotid intima-media thickness (cIMT) to investigate genetic susceptibility to atherosclerosis in 7894 unrelated adults (3963 women, 3931 men; 40 to 60 years) resident in four sub-Saharan African countries. cIMT was measured by ultrasound and genotyping was performed on the H3Africa SNP Array. Two new African-specific genome-wide significant loci for mean-max cIMT, SIRPA (p = 4.7E-08), and FBXL17 (p = 2.5E-08), were identified. Sex-stratified analysis revealed associations with one male-specific locus, SNX29 (p = 6.3E-09), and two female-specific loci, LARP6 (p = 2.4E-09) and PROK1 (p = 1.0E-08). We replicate previous cIMT associations with different lead SNPs in linkage disequilibrium with SNPs primarily identified in European populations. Our study find significant enrichment for genes involved in oestrogen response from female-specific signals. The genes identified show biological relevance to atherosclerosis and/or CVDs, sex-differences and transferability of signals from non-African studies.
© 2022. The Author(s).
Conflict of interest statement
The authors declare no competing interests.
Figures
References
-
- Roth, G. A. et al. Global, Regional, and National Burden of Cardiovascular Diseases for 10 Causes, 1990 to 2015. J. Am. Coll. Cardiol. [Internet]. http://www.ncbi.nlm.nih.gov/pubmed/28527533%0A (2017). - PMC - PubMed
-
- Fuster V. Global burden of cardiovascular disease: time to implement feasible strategies and to monitor results. J. Am. Coll. Cardiol. 2014;64:520–522. - PubMed
-
- Fox CS, et al. Genetic and environmental contributions to atherosclerosis phenotypes in men and women: heritability of carotid intima-media thickness in the Framingham heart study. Stroke. 2003;34:397–401. - PubMed
-
- Fagnani C, et al. Genetic and environmental components of carotid artery elasticity: an Italian twin study. Eur. J. Intern. Med. [Internet] 2013;24:e53–e54. - PubMed
Publication types
MeSH terms
Substances
Grants and funding
LinkOut - more resources
Full Text Sources
Medical
