Clinical Trial
. 2022 Feb 14;13(1):857.
doi: 10.1038/s41467-022-28408-3.

Clinical and biomarker analyses of sintilimab versus chemotherapy as second-line therapy for advanced or metastatic esophageal squamous cell carcinoma: a randomized, open-label phase 2 study (ORIENT-2)

Affiliations
Clinical Trial

Clinical and biomarker analyses of sintilimab versus chemotherapy as second-line therapy for advanced or metastatic esophageal squamous cell carcinoma: a randomized, open-label phase 2 study (ORIENT-2)

Jianming Xu et al. Nat Commun. .

Abstract

This randomized, open-label, multi-center phase 2 study (NCT03116152) assessed sintilimab, a PD-1 inhibitor, versus chemotherapy in patients with esophageal squamous cell carcinoma after first-line chemotherapy. The primary endpoint was overall survival (OS), while exploratory endpoint was the association of biomarkers with efficacy. The median OS in the sintilimab group was significantly improved compared with the chemotherapy group (median OS 7.2 vs.6.2 months; P = 0.032; HR = 0.70; 95% CI, 0.50-0.97). Incidence of treatment-related adverse events of grade 3-5 was lower with sintilimab than with chemotherapy (20.2 vs. 39.1%). Patients with high T-cell receptor (TCR) clonality and low molecular tumor burden index (mTBI) showed the longest median OS (15.0 months). Patients with NLR < 3 at 6 weeks post-treatment had a significantly prolonged median OS (16.6 months) compared with NLR ≥ 3. The results demonstrate a significant improvement in OS of sintilimab compared to chemotherapy as second-line treatment for advanced or metastatic ESCC.


Conflict of interest statement

H.Z., Y.W., Z.M., Y.Q.W., B.P., J.Y.S., and C.M. are the staff of Innovent Biologics, Inc. Other authors declare no completing interests.

Figures

Fig. 1
Fig. 1. CONSORT diagram of patient flow.
This figure shows reasons for exclusion from the study and the numbers of patients included in the analyses. †, unqualified pathological type; *, patients refused to receive treatment, but received follow-up. Treatment discontinuation occurred due to prespecified conditions such as serious protocol deviation, using prohibited drug in the study, loss of follow-up, life-threatening adverse events and other unacceptable toxicities.
Fig. 2
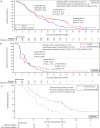
Fig. 2. Kaplan–Meier plots of survival.
a Overall survival in the ITT population; b Progression free survival in the ITT population. c Overall survival in the continuous and non-continuous subgroups of the sintilimab group. Log-rank test stratified by Eastern Cooperative Oncology Group performance-status (ECOG PS) score was used (2-sided).
Fig. 3
Fig. 3. Forest plot for subgroup analyses of overall survival.
Dots represent the cohort-specific hazard ratios with error bars corresponding to 95% CI bounds, which were calculated by using the univariate Cox regression model. ECOG PS Eastern Cooperative Oncology Group performance status, HR hazard ratio, CI confidence interval.
Fig. 4
Fig. 4. Kaplan–Meier plots of survival in high and low neutrophil-to-lymphocyte ratio (NLR) subgroups of the sintilimab group.
a Overall survival with NLR at baseline. b Progression-free survival with NLR at baseline. c Overall survival with NLR at 6 weeks post treatment. d Progression-free survival with NLR at 6 weeks post treatment. HR hazard ratio. P-values were based on a two-sided log-rank test.
Fig. 5
Fig. 5. Heatmap and forest plots of the association of tumor microenvironment immune-cell signatures and progression-free survival.
Heat map of immune score of 28 immune-cell populations is shown and forest plots (right panel) displaythe correlation of each immune subtype with progression-free survival. Node position reflects hazard ratio (<1 for favorable outcome with high score in the respective treatment). Only significant correlations are displayed and node size reflects the p-value (the larger the node size, the more significant). P-values were based on a two-sided Wald test. Source data are provided as a Source Data file.
Fig. 6
Fig. 6. Kaplan–Meier plots of survival in different TCR clonality and mTBI subgroups of the sintilimab group.
a Overall survival. b Progression-free survival. The high- or low- level groups of TCR clonality or mTBI are split by the respective median value. Group A: high TCR clonality and high mTBI; Group B: high TCR clonality and low mTBI; Group C: low TCR clonality and high mTBI; Group D: low TCR clonality and low mTBI. P-values were based on a two-sided Wald test. Source data are provided as a Source Data file.

References

    1. Sung H, et al. Global cancer statistics 2020: GLOBOCAN estimates of incidence and mortality worldwide for 36 cancers in 185 countries. CA Cancer J. Clin. 2021;71:209–249. - PubMed
    1. Arnold M, Ferlay J, van Berge Henegouwen MI, Soerjomataram I. Global burden of oesophageal and gastric cancer by histology and subsite in 2018. Gut. 2020;69:1564–1571. - PubMed
    1. The global, regional, and national burden of oesophageal cancer and its attributable risk factors in 195 countries and territories, 1990-2017: a systematic analysis for the Global Burden of Disease Study 2017. Lancet Gastroenterol. Hepatol.5, 582–597 (2020). - PMC - PubMed
    1. Jiao R, et al. Immune checkpoint inhibitors in esophageal squamous cell carcinoma: progress and opportunities. Onco. Targets Ther. 2019;12:6023–6032. - PMC - PubMed
    1. Lordick F, et al. Oesophageal cancer: ESMO clinical practice guidelines for diagnosis, treatment and follow-up. Ann. Oncol. 2016;27:v50–v57. - PubMed

Publication types

MeSH terms

Associated data