. 2022 Feb 14;13(1):856.
doi: 10.1038/s41467-022-28338-0.

Mesenchymal stem cells transfer mitochondria to allogeneic Tregs in an HLA-dependent manner improving their immunosuppressive activity

Affiliations

Mesenchymal stem cells transfer mitochondria to allogeneic Tregs in an HLA-dependent manner improving their immunosuppressive activity

Karolina Piekarska et al. Nat Commun. .

Abstract

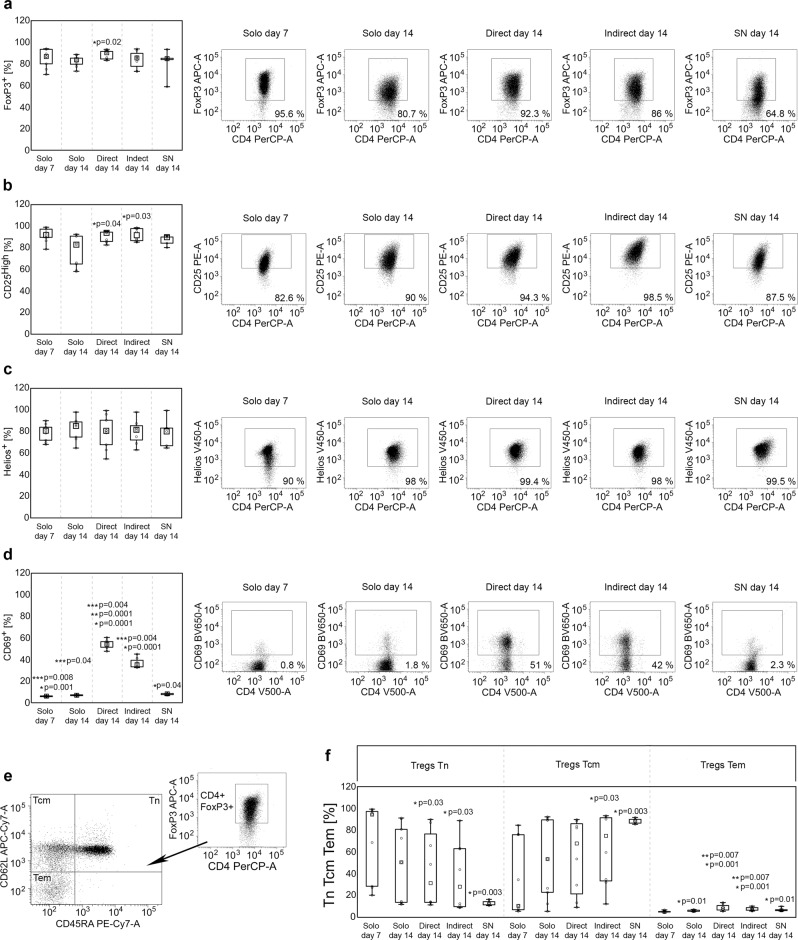
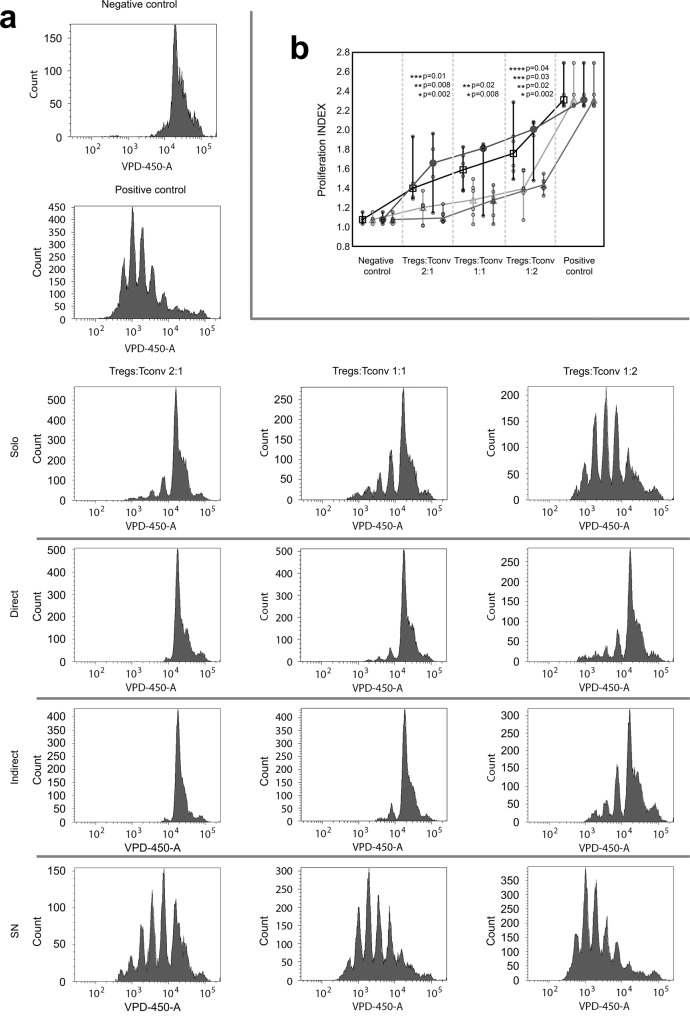
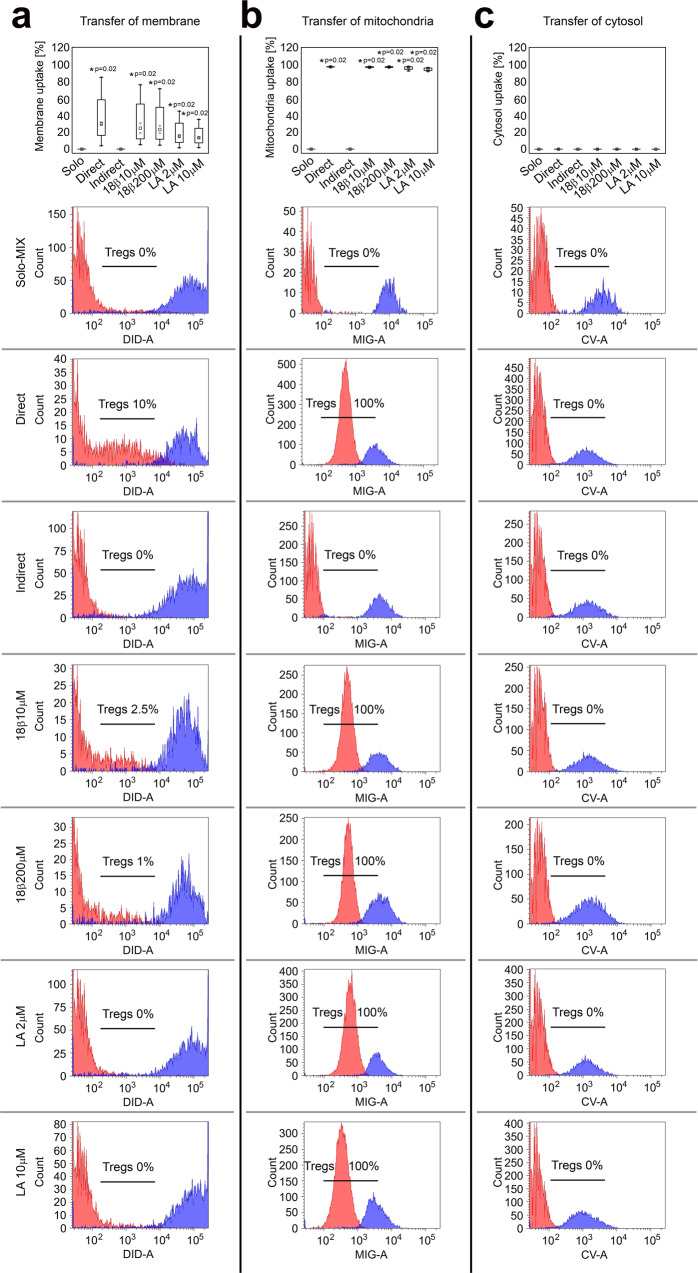
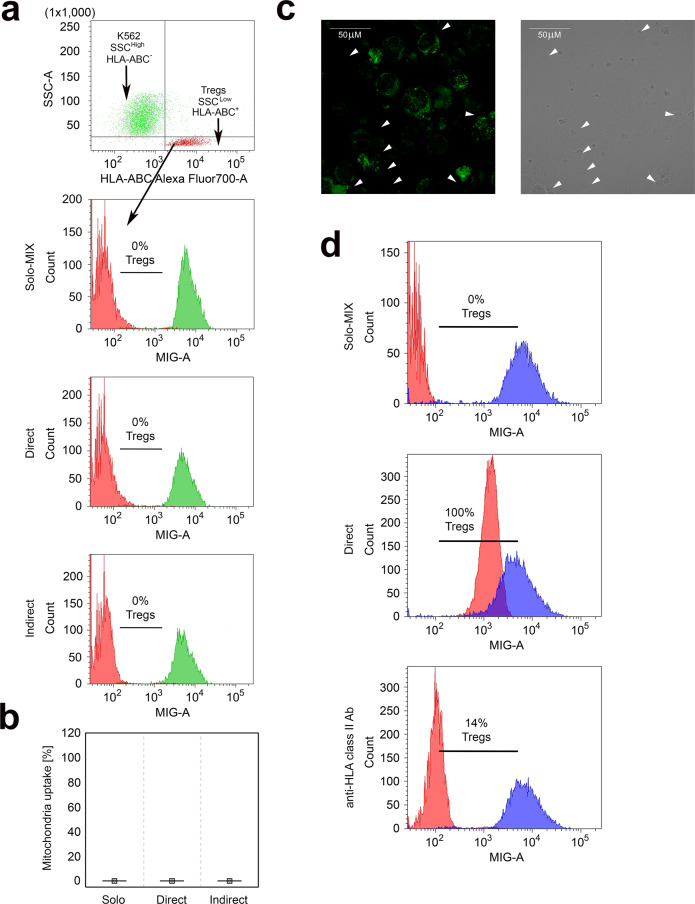
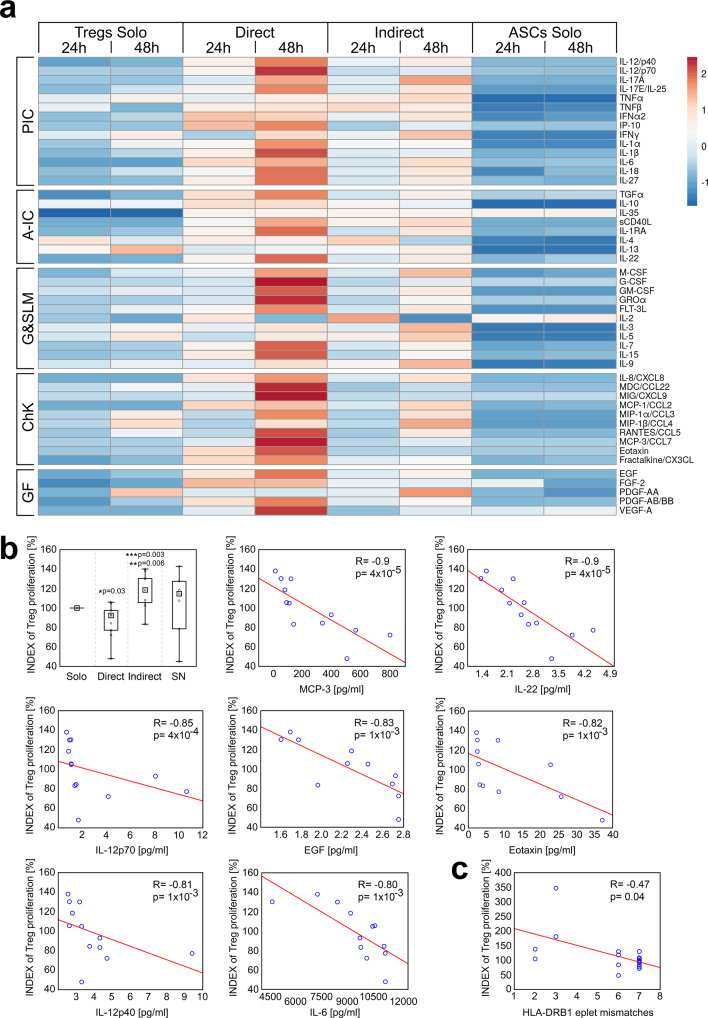
Cell-based immunotherapies can provide safe and effective treatments for various disorders including autoimmunity, cancer, and excessive proinflammatory events in sepsis or viral infections. However, to achieve this goal there is a need for deeper understanding of mechanisms of the intercellular interactions. Regulatory T cells (Tregs) are a lymphocyte subset that maintain peripheral tolerance, whilst mesenchymal stem cells (MSCs) are multipotent nonhematopoietic progenitor cells. Despite coming from different origins, Tregs and MSCs share immunoregulatory properties that have been tested in clinical trials. Here we demonstrate how direct and indirect contact with allogenic MSCs improves Tregs' potential for accumulation of immunosuppressive adenosine and suppression of conventional T cell proliferation, making them more potent therapeutic tools. Our results also demonstrate that direct communication between Tregs and MSCs is based on transfer of active mitochondria and fragments of plasma membrane from MSCs to Tregs, an event that is HLA-dependent and associates with HLA-C and HLA-DRB1 eplet mismatch load between Treg and MSC donors.


Conflict of interest statement

N.M.T. and K.P. are co-authors of two patent applications related to the presented content. N.M.T. and P.T. are shareholders of PolTREG S.A. company. The remaining authors declare no competing interests.

Figures

Fig. 1
Fig. 1. Direct contact with allogeneic ASCs induces high expression of CD69 and preserves expression of FoxP3 and CD25 in Tregs during culture in vitro.
Graphs and representative dot-plots depict data for Tregs from monocultures at day 7 and day 14 after isolation (Solo day 7 and Solo day 14, respectively), from direct and indirect cocultures at day 14 after Treg isolation that corresponds with day 7 of coculture (Direct day 14 and Indirect day 14, respectively), and from Treg monocultures supplemented with ASC-derived SNs at day 14 after isolation (corresponds with day 7 of culture supplementation with SNs; SN day 14). a The frequency of FoxP3+ cells within CD4+ T cell population. b The frequency of CD25High, c Helios+ and d CD69+ cells within the CD4+FoxP3+ Treg subset. *p < 0.05 for comparisons between the given condition vs Solo day 14. **p < 0.05 for differences between Direct day 14 vs Indirect day 14. ***p < 0.05 for differences between the given condition vs SN day 14. e Gaiting strategy for identification of Tn, Tcm and Tem Tregs. f Proportions of naive and memory subsets in the indicated culture conditions. *p < 0.05 for comparisons of Tn, Tcm and Tem subset frequencies between day 7 and 14 in the indicated culture conditions. **p < 0.05 for comparisons of Tem subset frequencies in the indicated culture conditions vs Treg monocultures at day 14. The data were calculated from nine independent experiments with a two-sided Mann–Whitney U test with correction. Box plots indicate median (symbol within the box), 25th, 75th percentile (box), minimum and maximum values (whiskers). Source data are provided as a Source Data file.
Fig. 2
Fig. 2. Direct and indirect Treg contact with allogeneic ASCs increases their potential for suppression of autologous Tconv proliferation.
a Histograms from 1 representative experiment depict dilution of violet proliferation dye 450 (VPD-450) by proliferating Tconvs in presence of Tregs from various culture conditions in Treg:Tconv ratios of 2:1 (left panel), 1:1 (middle panel) and 1:2 (right panel). Histograms for negative (unstimulated Tconvs without Tregs) and positive control (stimulated Tconvs without Tregs) are also presented. b Comparison of proliferation indexes (PI) of Tconvs in the presence of various proportions of autologous Tregs derived from indicated culture conditions is shown for 6 independent experiments. VPD-450 stained unstimulated and stimulated Tconvs served as negative and positive controls, respectively. Squares, circles, filled and empty triangles correspond with the proliferation suppression effect exerted by Tregs expanded in standard monocultures, monocultures supplemented with ASC-derived SNs, direct and indirect cocultures, respectively. The differences were calculated with a two-sided Mann–Whitney U test with correction. *p < 0.05 for direct cocultures vs monocultures. **p < 0.05 for indirect cocultures vs monocultures. p < 0.05 for comparisons between Tregs from monocultures supplemented with ASC-derived SNs vs Tregs from direct or indirect cocultures are marked with *** and ****, respectively. In the whisker plots the median is indicated by the symbol between the whiskers. The lower and upper whiskers indicate the minimum and maximum values, respectively. Source data are provided as a Source Data file.
Fig. 3
Fig. 3. Direct and indirect contact with allogeneic ASCs enhances the activity of CD39 and CD73 in Tregs leading to increased degradation of proinflammatory eATP and eAMP.
a The frequency of CD39+ cells within CD4+FoxP3+ T cell population and the intensity of CD39 expression (MFI, median fluorescence intensity) by CD4+FoxP3+CD39+ Tregs in the studied culture conditions (n = 9). b The frequency of CD73+ cells within CD4+FoxP3+ T cell population and the intensity of CD73 expression (MFI) by CD4+FoxP3+CD73+ Tregs in the indicated culture conditions (n = 9). *p < 0.05 for comparisons with Tregs from monocultures at day 7. **p < 0.05 for comparisons with Tregs from monocultures at day 14. c The intensity of degradation of eATP, eAMP and eADO by Tregs from the indicated culture conditions in relation to standard Treg monocultures (INDEX, n = 4). *p < 0.05 for comparisons between Treg monocultures and the given culture condition. **p < 0.05 for direct vs indirect cocultures. ***p < 0.05 for direct cocultures vs monocultures supplemented with ASC-derived SNs. ****p < 0.05 for indirect cocultures vs monocultures supplemented with ASC-derived SNs. d Correlations between eATP, eAMP and eADO degradation by Tregs from the indicated culture conditions and their inhibition of Tconv proliferation in 2:1, 1:1 and 1:2 Treg:Tconv ratios together (n = 48) were calculated with Spearman’s rank correlation, R and p values are given. Inhibition of Tconv proliferation was defined by the proliferation INDEX of Tconvs in the presence of Tregs. A lower proliferation INDEX of Tconvs in the presence of Tregs corresponds to a higher Treg suppressive potential. The differences between the culture conditions were calculated with a two-sided Mann–Whitney U test with correction. In all boxplots the median is indicated by the symbol within the box, lower and upper bounds of the boxes correspond with the 25th and 75th percentiles. The lower and upper whiskers indicate minimum and maximum values, respectively. MFI is presented as value to power of 3 or 4 (e.g. 1E4 = 1 × 104). Source data are provided as a Source Data file.
Fig. 4
Fig. 4. Tregs uptake plasmalemma and mitochondria, but not cytosol from allogeneic ASCs when present in direct cell-to-cell contact.
Plasmalemma, mitochondria and cytosol of allogeneic ASCs were stained with a Vybrant DiD (DID), b mitotracker green (MIG) and c calcein violet (CV), respectively. Unstained Tregs cultured separately served as a negative control (Solo-MIX, n = 4) and were mixed with stained ASCs immediately before the analysis with flow cytometry to show Treg autofluorescence and fluorescence of labelled ASCs on the same graph. Simultaneously, stained ASCs were cocultured with unstained Tregs for 72 h in direct (Direct, n = 4) and indirect (Indirect, n = 4) contact. In addition, the effect of 18β-glycyrrhetinic acid (18β 10 μM, n = 4 and 18β 200 μM, n = 4) and latrunculin A (LA 2 μM, n = 4 and LA 10 μM, n = 4) inhibitors of gap junction and tunnelling nanotube formation, respectively was tested in direct cocultures. Graphs depict the percentage of Tregs that internalized ASC-derived cellular elements. Histograms from one representative experiment are shown. Red and blue histograms represent the fluorescence of unstained Tregs and stained ASCs, respectively. Cellular element uptake is visible as an increase in the fluorescence of unstained Tregs after coculture with labelled ASCs. The frequency of Tregs that internalized ASC-derived element is shown on each histogram. Data for four independent experiments were calculated using a two-sided Mann–Whitney U test with correction. *p < 0.05 for direct cocultures with and without inhibitors vs monocultures and indirect cocultures. In all boxplots the median is indicated by the symbol within the box, lower and upper bounds of the boxes correspond with the 25th and 75th percentiles. The lower and upper whiskers indicate the minimum and maximum values, respectively. Source data are provided as a Source Data file.
Fig. 5
Fig. 5. Tregs internalize active mitochondria of allogeneic ASCs and the process correlates with HLA eplet mismatch load.
a Red and blue histograms represent fluorescence of CM-XRos in unstained Tregs and stained ASCs, respectively. Representative histograms from 1 of 7 experiments are shown. Uptake of active mitochondria is visualized as an increase in CM-XRos fluorescence in unstained Tregs after coculture with labelled ASCs. The percentage of Tregs that internalized active mitochondria derived from ASCs is given for each histogram. Unstained Tregs cultured separately served as a negative control (Solo-MIX) and were mixed with stained ASCs immediately before the analysis with flow cytometry to show Treg autofluorescence and fluorescence of labelled ASCs on the same graph. Simultaneously, stained ASCs were cocultured with unstained Tregs for 72 h in direct (Direct) and indirect contact (Indirect). The effect of 18β-glycyrrhetinic acid (18β 200 μM) and latrunculin A (LA 10 μM) on mitochondria transfer was tested in direct cocultures. b Uptake of ASC-derived active (MIG+CM-XRos+, grey-shaded graphs) and inactive (MIG+CM-XRos, white graphs) mitochondria by Tregs in various culture conditions is depicted. Data for seven independent experiments were calculated using a two-sided Mann–Whitney U test with correction. *p < 0.05 for uptake of active or inactive mitochondria by Tregs from direct cocultures with and without inhibitors vs Tregs from monocultures and indirect cocultures. **p < 0.05 for uptake of active vs inactive mitochondria by Tregs in the a given culture condition. cf Representative confocal micrographs from 1 of 4 experiments show MIG and CM-H2XRos labelled ASCs and unstained Tregs that became MIG+CM-XRos+ after incorporation of mitochondria from labelled ASCs in direct cell-to-cell coculture. Exemplary Tregs are highlighted with the arrows. c Green fluorescence of MIG (total mitochondrial mass). d Red fluorescence of CM-XRos (active mitochondria). e Light micrograph. f Merged view from three channels. g Positive correlations between the uptake of active allogeneic mitochondria by Tregs and HLA eplet mismatch load calculated with Spearman’s rank correlation, R and p values are given. Box plots indicate median (symbol within the box), 25th, 75th percentile (box), minimum and maximum values (whiskers). Source data are provided as a Source Data file.
Fig. 6
Fig. 6. Treg mitochondria uptake is HLA dependent.
The figure depicts the lack of mitochondria transfer from K562 cells to Tregs. a The gating strategy for identification of K562 cells (HLA-ABCSSCHigh) and Tregs (HLA-ABC+SSCLow) in the coculture experiments for mitochondria transfer analysis, where K562 cells were stained with mitotracker green dye (MIG). In the next step gated K562 cells and Tregs were visualized on histograms for MIG fluorescence to measure mitochondria transfer from MIG stained K562 cells (green histograms) to unstained Tregs (red histograms). Unstained Tregs cultured separately served as a negative control (Solo-MIX, n = 4) and were mixed with stained K562 cells immediately before the analysis with flow cytometry to display Treg autofluorescence and fluorescence of labelled K562 on the same graph. Simultaneously, stained K562 cells were cocultured with unstained Tregs for 72 h in direct (Direct, n = 4) and indirect (Indirect, n = 4) contact. Histograms from one representative experiment are shown. Percentage of Tregs that internalized K562 cell-derived mitochondria is given for each histogram. b The frequency of Tregs that have taken up mitochondria from K562 cells (n = 4). c Representative confocal micrographs from 1 of 2 experiments show K562 cells labelled with MIG and unstained allogenic Tregs that did not incorporate mitochondria from K562 cells after coculture in direct cell-to-cell contact. Tregs are highlighted by the arrows on the light and green fluorescence micrographs. Tregs would show green fluorescence if K562 cell-derived mitochondria were incorporated. The image was acquired with ×60 oil immersion objective lens. d Inhibition of Treg mitochondria uptake after ASC preincubation with blocking anti-HLA class II antibody. Unstained Tregs cultured separately served as a negative control (Solo-MIX) and were mixed with stained ASCs immediately before the analysis to depict Treg autofluorescence and fluorescence of labelled ASCs on the same graph. Simultaneously, stained and anti-HLA class II blocking antibody treated (anti-HLA class II Ab) and not treated (Direct) ASCs were cocultured with unstained Tregs for 72 h in direct cell-to-cell contact. Graphs depict the percentage of Tregs that internalized ASC-derived mitochondria. Data were calculated with a two-sided Mann–Whitney U test with correction. In the statistical plots the median is indicated by the symbol. No boxes and no whiskers are visible as each time the values were equal to zero. Source data are provided as a Source Data file.
Fig. 7
Fig. 7. Direct contact of Tregs with allogeneic mismatched ASCs results in release of increased amounts of proinflammatory mediators that inhibit Treg proliferation.
a The heat map depicts the secretion of various soluble mediators after 24 h and 48 h by Treg and ASC monocultures (Tregs Solo, n = 6 and ASCs Solo, n = 6, respectively) and direct and indirect cocultures (Direct, n = 6 and Indirect, n = 6, respectively). The listed factors were grouped into proinflammatory (PIC) and anti-inflammatory cytokines (A-IC), mediators stimulating growth and survival of lymphoid and myeloid cells (G&SLM), chemokines (ChK) and growth factors (GF). b Treg proliferation rate in relation to standard Treg monoculture (INDEX of Treg proliferation) in the presence or absence of ASCs is shown. The differences using data from nine independent experiments were calculated with two-sided Mann–Whitney U tests with correction. *p < 0.05 for direct cocultures vs monocultures. **p < 0.05 for direct vs indirect cocultures. ***p < 0.05 for indirect cocultures vs monocultures. The most significant correlations between the proliferation of Tregs from direct and indirect cocultures together (n = 12) and cytokine levels in these cocultures are shown. c The impact of ASC-Treg HLA-DRB1 eplet mismatch load on the proliferation of Tregs from direct and indirect cocultures (n = 18). All correlations were calculated with Spearman’s rank correlation, R and p values are given. In all boxplots the median is indicated by the symbol within the box, lower and upper bounds of the boxes correspond with the 25th and 75th percentiles. The lower and upper whiskers indicate the minimum and maximum values, respectively. Source data are provided as a Source Data file.

References

    1. Sakaguchi S, Yamaguchi T, Nomura T, Ono M. Regulatory T cells and immune tolerance. Cell. 2008;133:775–787. - PubMed
    1. Gambineri, E. et al. Clinical, immunological, and molecular heterogeneity of 173 patients with the phenotype of immune dysregulation, polyendocrinopathy, enteropathy, X-linked (IPEX) syndrome. Front. Immunol.9, 2411 (2018). - PMC - PubMed
    1. Pilat N, et al. Treg-mediated prolonged survival of skin allografts without immunosuppression. Proc. Natl Acad. Sci. USA. 2019;116:13508–13516. - PMC - PubMed
    1. Danby RD, et al. High proportions of regulatory T cells in PBSC grafts predict improved survival after allogeneic haematopoietic SCT. Bone Marrow Transpl. 2016;51:110–118. - PMC - PubMed
    1. Trzonkowski P, et al. Hurdles in therapy with regulatory T cells. Sci. Transl. Med. 2015;7:304ps318. - PubMed

Publication types