. 2022 Feb 14;12(1):2404.
doi: 10.1038/s41598-022-05990-6.

Stain-free detection of embryo polarization using deep learning

Affiliations

Stain-free detection of embryo polarization using deep learning

Cheng Shen et al. Sci Rep. .

Abstract

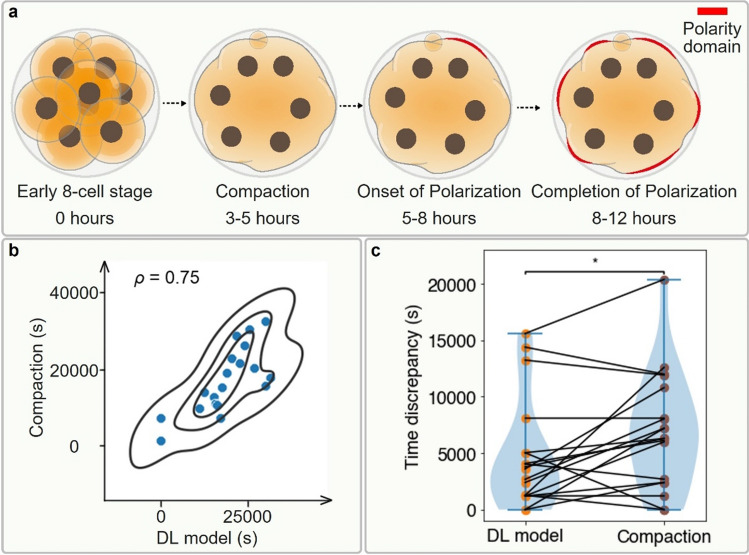
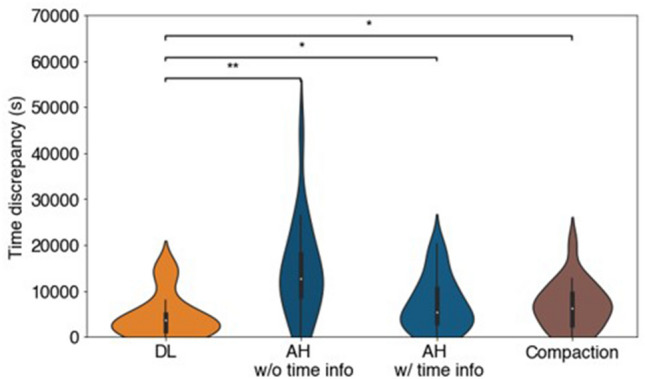
Polarization of the mammalian embryo at the right developmental time is critical for its development to term and would be valuable in assessing the potential of human embryos. However, tracking polarization requires invasive fluorescence staining, impermissible in the in vitro fertilization clinic. Here, we report the use of artificial intelligence to detect polarization from unstained time-lapse movies of mouse embryos. We assembled a dataset of bright-field movie frames from 8-cell-stage embryos, side-by-side with corresponding images of fluorescent markers of cell polarization. We then used an ensemble learning model to detect whether any bright-field frame showed an embryo before or after onset of polarization. Our resulting model has an accuracy of 85% for detecting polarization, significantly outperforming human volunteers trained on the same data (61% accuracy). We discovered that our self-learning model focuses upon the angle between cells as one known cue for compaction, which precedes polarization, but it outperforms the use of this cue alone. By compressing three-dimensional time-lapsed image data into two-dimensions, we are able to reduce data to an easily manageable size for deep learning processing. In conclusion, we describe a method for detecting a key developmental feature of embryo development that avoids clinically impermissible fluorescence staining.


Conflict of interest statement

The authors declare no competing interests.

Figures

Figure 1
Figure 1
Method to track and annotate polarity. (a) Overview of mouse pre-implantation development, from the zygote stage at embryonic day 0 to the late blastocyst stage at embryonic day 4.5. At the late 8-cell stage, polarization takes place, as each blastomere gains a defined apical-basal axis of polarity indicated by the presence of an apical domain (red). (b) Data preprocessing of dual-channel 3D mouse embryo videos, each of which is a 5D tensor with the dimension of x, y, z, c (channel), and t (time). First, each video was split into a fluorescence (Ezrin-RFP) and DIC channel, visualized in red and gray respectively. Then, each channel was compressed along the z dimension by different algorithms. The maximum intensity z-projection algorithm was applied for the fluorescence channel and DTCWT based AIF algorithm for the DIC channel to get the frame sequences. (c) Expert annotation on fluorescence frame sequences, where the time point of polarity onset is pinpointed. In the time sequence, the onset of polarization was defined as the frame in which the blastomere had a clear polarity ring or cap (closed) which took up at least 1/3 of the visible surface, or 1/3 of the cell surface curve if displayed side-on. Frames before this point were defined as before-onset, whilst frames including and after this point are defined as after-onset. (d) Supervised learning of a single DCNN model. The DIC frame sequences paired with the class labels from fluorescence annotation were permuted and used as the input and target of the supervised learning. Transfer learning from pre-trained weights on ImageNet database and data augmentation are utilized in the training of all DCNN models. Scale bar = 30 μm.
Figure 2
Figure 2
An ensemble deep learning approach to predict embryo polarization from DIC images. (a) Class distribution in the training/testing/whole dataset. (b) Ensemble learning on six DCNN models. The predicted probability vectors for two classes on a single testing frame by six DCNN models were averaged element-wisely and the class corresponding to the larger probability was used as the final predicted label. (c) Temporal smoothing on the predicted labels for each testing embryo’s DIC frame sequence. The majority voting based smoothing window slid over the chronologically ordered binary labels. The window length is 3 and we kept the label at both ends untouched. Finally, the time index of first after-onset prediction was taken as the final prediction of polarity onset time point. Scale bar = 20 μm.
Figure 3
Figure 3
Results of image classification task by the ensemble deep learning model and the average human. (a) The receiver operating characteristic (ROC) curve of the performance of the ensemble deep learning (DL) model on testing frames. The 95% confidence intervals (CIs) of the ROC curve are indicated by the orange shaded area. The orange solid star represents the performance of the ensemble DL model with the default probability threshold of 0.5 to binarize its output and the dark blue solid circle represents the performance of the average human (AH), which is an aggregate result of six human volunteers’ prediction. We applied majority voting to the six predictions on each testing frame to obtain the average human performance. If each prediction received three votes, we randomly assigned a prediction of before or after onset. (b) Confusion matrix of image classification on testing frames by the ensemble DL model with the binarization threshold of 0.5 and the average human. c Testing accuracy bar chart of the ensemble DL model and the average human compared with no skill (random predictions), where the error bars represent the 95% CI. The ensemble DL model significantly outperforms the average human, and the no skill predictions. *p < 0.05, **p < 0.01, ***p < 0.001, ****p < 0.0001, NS, not significant, two-sided z-test. All the 95% CIs are estimated by bootstrapping the testing dataset with 1000 replicates.
Figure 4
Figure 4
Visualization of the decision-making by the ensemble deep learning model. Heat maps obtained by the class activation mapping (CAM) technique highlight how the ensemble deep learning model attends the discriminative regions in the testing frame when giving the predicted class label. The red regions indicate positive focus of the model (in alignment with the predicted label) and the blue regions negative focus (in opposition to the predicted label). (ad) correspond to four cases in confusion matrix, true negatives (TN), false positives (FP), false negative (FN), and true positives (TP), respectively. In each subfigure, from left to right are the testing DIC image, its overlay with the focus heat map, and its corresponding fluorescence channel image. On top of the test DIC image is the predicted label of the ensemble DL model with its confidence (from 0 to 100%). On top of the fluorescence image is the annotated label by the expert. All the heat maps show that our DL model either attends to the individual blastomeres or the inter-blastomere angles. For example, TP heat map d focuses on the truly polarized blastomeres. At a certain time-point, some blastomeres have started polarization but the others have not, as shown in the FN case (c). This issue resulted in the DL model making a Type II error with low confidence in the case given. Scale bar = 20 μm.
Figure 5
Figure 5
Comparative analysis of the ensemble deep learning model prediction and the compaction-based prediction for polarization. (a) Chronological order of compaction and polarization events during the 8-cell stage for a normal mouse embryo. (b) Correlation analysis between time points of DL model polarity prediction and compaction. The x and y coordinate are the predicted polarity onset time index of testing embryos (marked in blue solid balls) by the ensemble DL model and the annotated compaction time index, respectively. Their pairwise relationship shows a Pearson correlation coefficient (ρ) of 0.75. (c) Violin plot to visualize the time discrepancy between the annotated and the predicted polarity onset time index on 19 testing embryos by ensemble DL model and compaction proxy, overlaid with a slopegraph showing each testing embryo prediction time discrepancy in pair. From the kernel density estimate (blue shade) of violin plot and the connection line trends of slopegraph, we can tell that the prediction time discrepancy of DL model is significantly lower than the one of compaction proxy. The p-value is specified in the figure for *p < 0.05, **p < 0.01, ***p < 0.001, ****p < 0.0001, NS not significant, two-sided Wilcoxon matched-pairs signed-rank test.
Figure 6
Figure 6
Comparative analysis of the polarity onset time point prediction by the ensemble deep learning model, the average human and the compaction proxy. Violin plot of time discrepancy between the annotated and the predicted polarity onset time index of 19 testing embryos by ensemble DL model, average human (AH) without/with time information and compaction proxy. AH without (w/o) time information (info) means that six human volunteers were given the randomized testing frames without any time information. Their predicted labels were then chronologically ordered for each testing embryo and temporally smoothened in the same manner as the ensemble DL model predictions. The mean discrepancy was taken from the six volunteers. AH with (w/) time information indicates that six human volunteers were given the chronologically ordered frames for each testing embryo. They directly estimated the polarity onset time point from these time sequences. Statistical analysis uses the ensemble DL model result as the reference to test their difference significance and the p-values are specified in the figure for *p < 0.05, **p < 0.01, ***p < 0.001, ****p < 0.0001, NS not significant, two-sided Wilcoxon matched-pairs signed-rank test.

Similar articles

Cited by

References

    1. Johnson MH, Ziomek CA. The foundation of two distinct cell lineages within the mouse morula. Cell. 1981;24:71–80. doi: 10.1016/0092-8674(81)90502-X. - DOI - PubMed
    1. Fleming TP, Cannon PM, Pickering SJ. The cytoskeleton, endocytosis and cell polarity in the mouse preimplantation embryo. Dev. Biol. 1986;113:406–419. doi: 10.1016/0012-1606(86)90175-2. - DOI - PubMed
    1. Gerri C, et al. Initiation of a conserved trophectoderm program in human, cow and mouse embryos. Nature. 2020;587:443–447. doi: 10.1038/s41586-020-2759-x. - DOI - PMC - PubMed
    1. Zhu, M. et al. Human embryo polarization requires PLC signaling to mediate trophectoderm specification. elife10, e65068 (2021). - PMC - PubMed
    1. Anani S, Bhat S, Honma-Yamanaka N, Krawchuk D, Yamanaka Y. Initiation of Hippo signaling is linked to polarity rather than to cell position in the pre-implantation mouse embryo. Development. 2014;141:2813–2824. doi: 10.1242/dev.107276. - DOI - PubMed

Publication types

Substances