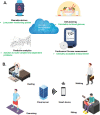
A machine learning-based on-demand sweat glucose reporting platform
- PMID: 35165316
- PMCID: PMC8844049
- DOI: 10.1038/s41598-022-06434-x
A machine learning-based on-demand sweat glucose reporting platform
Abstract
Diabetes is a chronic endocrine disease that occurs due to an imbalance in glucose levels and altering carbohydrate metabolism. It is a leading cause of morbidity, resulting in a reduced quality of life even in developed societies, primarily affected by a sedentary lifestyle and often leading to mortality. Keeping track of blood glucose levels noninvasively has been made possible due to diverse breakthroughs in wearable sensor technology coupled with holistic digital healthcare. Efficient glucose management has been revolutionized by the development of continuous glucose monitoring sensors and wearable, non/minimally invasive devices that measure glucose concentration by exploiting different physical principles, e.g., glucose oxidase, fluorescence, or skin dielectric properties, and provide real-time measurements every 1-5 min. This paper presents a highly novel and completely non-invasive sweat sensor platform technology that can measure and report glucose concentrations from passively expressed human eccrine sweat using electrochemical impedance spectroscopy and affinity capture probe functionalized sensor surfaces. The sensor samples 1-5 µL of sweat from the wearer every 1-5 min and reports sweat glucose from a machine learning algorithm that samples the analytical reference values from the electrochemical sweat sensor. These values are then converted to continuous time-varying signals using the interpolation methodology. Supervised machine learning, the decision tree regression algorithm, shows the goodness of fit R2 of 0.94 was achieved with an RMSE value of 0.1 mg/dL. The output of the model was tested on three human subject datasets. The results were able to capture the glucose progression trend correctly. Sweet sensor platform technology demonstrates a dynamic response over the physiological sweat glucose range of 1-4 mg/dL measured from 3 human subjects. The technology described in the manuscript shows promise for real-time biomarkers such as glucose reporting from passively expressed human eccrine sweat.
© 2022. The Author(s).
Conflict of interest statement
Drs. Shalini Prasad and Sriram Muthukumar have a significant interest in EnLiSense LLC, a company that may have a commercial interest in the results of this research and technology. The potential individual conflict of interest has been reviewed and managed by The University of Texas at Dallas and played no role in the study design; in the collection, analysis, and interpretation of data; in the writing of the report, or in the decision to submit the report for publication. Mr. Devangsingh Sankhala, Drs. Madhavi Pali and Kai-Chun Lin, Mr. Badrinath Jagannath and Ms. Abha Umesh declare no competing interests.
Figures


References
-
- The Centre for Disease Control and Prevention. Estimates of diabetes and its burden in the United States National Diabetes statistics report. Natl. Diabetes Stat. Rep. 1–32 (2020).
-
- Growth Opportunities in Ventilators, Blood Glucose Tracking, Orthopedic Implants, and Brain Visualization Platforms. https://store.frost.com/growth-opportunities-in-ventilators-blood-glucos....
MeSH terms
Substances
LinkOut - more resources
Full Text Sources
Medical

