. 2022 Feb;24(2):181-193.
doi: 10.1038/s41556-021-00840-5. Epub 2022 Feb 14.

LONP-1 and ATFS-1 sustain deleterious heteroplasmy by promoting mtDNA replication in dysfunctional mitochondria

Affiliations

LONP-1 and ATFS-1 sustain deleterious heteroplasmy by promoting mtDNA replication in dysfunctional mitochondria

Qiyuan Yang et al. Nat Cell Biol. 2022 Feb.

Abstract

The accumulation of deleterious mitochondrial DNA (∆mtDNA) causes inherited mitochondrial diseases and ageing-associated decline in mitochondrial functions such as oxidative phosphorylation. Following mitochondrial perturbations, the bZIP protein ATFS-1 induces a transcriptional programme to restore mitochondrial function. Paradoxically, ATFS-1 is also required to maintain ∆mtDNAs in heteroplasmic worms. The mechanism by which ATFS-1 promotes ∆mtDNA accumulation relative to wild-type mtDNAs is unclear. Here we show that ATFS-1 accumulates in dysfunctional mitochondria. ATFS-1 is absent in healthy mitochondria owing to degradation by the mtDNA-bound protease LONP-1, which results in the nearly exclusive association between ATFS-1 and ∆mtDNAs in heteroplasmic worms. Moreover, we demonstrate that mitochondrial ATFS-1 promotes the binding of the mtDNA replicative polymerase (POLG) to ∆mtDNAs. Interestingly, inhibition of the mtDNA-bound protease LONP-1 increased ATFS-1 and POLG binding to wild-type mtDNAs. LONP-1 inhibition in Caenorhabditis elegans and human cybrid cells improved the heteroplasmy ratio and restored oxidative phosphorylation. Our findings suggest that ATFS-1 promotes mtDNA replication in dysfunctional mitochondria by promoting POLG-mtDNA binding, which is antagonized by LONP-1.


Conflict of interest statement

Competing Interests Statement

The authors declare no competing interests.

Figures

Extended Data Fig. 1
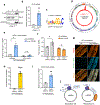
Extended Data Fig. 1. OXPHOS dysfunction increases mtDNAs
a, Quantification of total mtDNA in wildtype and nduf-7(et19) worms. n = 3, biologically independent samples (Each sample contains 40–60 animals; every dot stands for averaged value from 3 technical replicates; data shown represent mean ± S.E.M.). **P = 0.0015, Two-tailed Student’s t test. b, POLG immunoblot of wildtype worms following fractionation into total lysate (T), post-mitochondrial supernatant (S), and mitochondrial pellet (M). Tubulin (Tub) and the OXPHOS protein (NDUFS3) serve as loading controls. Representative immunoblots from four biological repeats. c, POLG immunoblot of lysates from wildtype worms raised on control(RNAi) or polg(RNAi). Tubulin (Tub) serves as a loading control. Representative immunoblots from seven biological repeats.
Extended Data Fig. 2
Extended Data Fig. 2. atfs-1-dependent transcription is impaired in atfs-1nuc(−) worms.
a, Schematic highlighting the R (Arginine) to A (Alanine) substitution to impair the nuclear localization sequence (NLS) within ATFS-1 yielding ATFS-1nuc(−) confirmed by Sanger sequencing. b, UPRmt signaling schematic highlighting the ATFS-1nuc(−) with an impaired NLS. c, Expression level of hsp-6 mRNA in wildtype and atfs-1nuc(−) worms raised on control(RNAi) or spg-7(RNAi) examined by qRT-PCR. n = 3, biologically independent samples. **P = 0.0028, One-way ANOVA. d-e, Photomicrographs of wildtype, atfs-1(et18) and atfs-1(et18)nuc(−);hsp-6pr::gfp worms (Scale bar 0.1 mm) (d); Quantification of fluorescence pixel intensity in wildtype (n = 117; Max: 12.51; Min: 1.87; Median: 5.12), atfs-1(et18) (n = 74; Max: 75.251; Min: 15.790; Median: 32.021) and atfs-1(et18)nuc(−) strains (n = 121; Max: 15.100; Min: 1.55; Median: 5.43). Box & whiskers plots Min to Max. ****P < 0.0001, One-way ANOVA. n means the number of sampling areas. Average pixel intensity signals were calculated from sampling areas at each condition in biological triplicates (e). f, hsp-6 mRNA expression in wildtype, atfs-1(et18) or atfs-1(et18)nuc(−) worms examined by qRT-PCR. n = 4 (wildtype), n = 5 (atfs-1(et18)), n = 3 (atfs-1(et18)nuc(−)), biologically independent samples. *P = 0.0114 (wildtype vs. atfs-1(et18)), *P = 0.0407 (atfs-1(et18) vs. atfs-1(et18)nuc(−)), one-way ANOVA. g, hsp-6 mRNA expression in wildtype and atfs-1nuc(−) worms raised on control(RNAi) or cco-1(RNAi) examined by qRT-PCR. n = 3, biologically independent samples. ***P = 0.0004, one-way ANOVA. h, polg mRNA expression in atfs-1nuc(−) worms raised on control(RNAi) or cco-1(RNAi) examined by qRT-PCR. n = 3, biologically independent samples. Two-tailed Student’s t test. i, POLG immunoblots of lysates from wildtype, atfs-1nuc(−) and atfs-1(null) worms raised on control or cco-1(RNAi). Representative immunoblots from four biological repeats. j, Immunoblots of lysates from wildtype and atfs-1nuc(−) worms raised on control or lonp-1(RNAi). ATFS-1 or ATFS-1nuc(−) are indicated with an arrowhead. Representative immunoblots from four biological repeats. In c, f-h, each dot represents the average from 3 technical replicates; data shown represent mean ± S.E.M.
Extended Data Fig. 3
Extended Data Fig. 3. LONP-1 inhibition promotes mtDNA content via ATFS-1
a, FLAG immunoblots of lysates from wildtype and LONP-1FLAG wildtype worms. Tubulin (Tub) serves as a loading control. Representative immunoblots from four biological repeats. b, Images of wildtype or LONP-1FLAG worms 48 hours after synchronization indicating worms expressing LONP-1FLAG at the endogenous locus develop normally (Scale bar 1 mm). Representative images from four biological repeats. c, Fluorescent photomicrographs of wildtype hsp-6pr::gfp or lonp-1FLAG;hsp-6pr::gfp worms 48 hours after synchronization indicating worms expressing LONP-1FLAG do not cause UPRmt activation (Scale bar 0.05 mm). Representative images from four biological repeats. d, Schematic of the putative ATFS-1 and LONP-1 binding sites within the mtDNA non-coding region (NCR) highlighting the proximity of both sites (~200 base pairs). e, POLG Immunoblots of lysates from wildtype worms raised on control or lonp-1(RNAi). Representative images from four biological repeats. f, Total mtDNA quantification in wildtype homoplasmic atfs-1nuc(−) worms raised on control(RNAi) or lonp-1(RNAi). n = 5, biologically independent samples. ***P = 0.0004, Two-tailed Student’s t test). g, Total mtDNA quantification in wildtype homoplasmic atfs-1mts(−);nuc(−) worms raised on control(RNAi) or lonp-1(RNAi). n = 3, biologically independent samples. Two-tailed Student’s t test. In f and g, each biologically independent sample contained 40–60 animals; every dot stands for averaged value from 3 technical replicates; data shown represent mean ± S.E.M. *p<0.05, **p<0.01, ****p<0.0001.
Extended Data Fig. 4
Extended Data Fig. 4. Mitochondrial ATFS-1 is required to maintain ΔmtDNA in heteroplasmic worms.
a, Crossing strategy of atfs-1(null);pdr-1(tm598);uaDf5 strain. b. TMRE quantification of heteroplasmic (ΔmtDNA) worms raised on control(RNAi) (n = 475; Max: 1.052; Min: 0.21; Median: 0.618), or wildtype worms raised on control (n = 232; Max: 1.318; Min: 0.725; Median: 0.995) or spg-7(RNAi) (n = 114; Max: 0.798; Min: 0.134; Median: 0.402). Box & whiskers plots Min to Max. n means the number of sampling areas. Average pixel intensity signals were calculated from sampling areas at each condition in biological triplicates. c,d, Photomicrographs of uaDf5 and atfs-1nuc(−);uaDf5;hsp-6pr::gfp worms (Scale bar 0.1 mm) (c); Quantification of fluorescence pixel intensity in uaDf5 (n = 199; Max: 30.89; Min: 3.430; Median:11.590) and atfs-1nuc(−);uaDf5;hsp-6pr::gfp (n = 234; Max: 15.640; Min: 2.540; Median: 6.915). Box & whiskers plots Min to Max. n means the number of sampling areas. Average pixel intensity signals were calculated from sampling areas at each condition in biological triplicates (d). e, ΔmtDNA quantification as determined by qPCR in heteroplasmic uaDf5 worms, atfs-1(null);uaDf5 worms and atfs-1nuc(−);uaDf5 worms. n = 3, biologically independent samples. f, ΔmtDNA quantification as determined by qPCR in heteroplasmic atfs-1nuc(−);uaDf5 worms and atfs-1mts(−);nuc(−);uaDf5. n = 3 (atfs-1nuc(−);uaDf5) and n = 4 (atfs-1mts(−);nuc(−);uaDf5), biologically independent samples. ***P = 0.0007. g, Quantification of total mtDNA following POLG ChIP-mtDNA in homoplasmic wildtype or uaDf5 worms. n = 4 (wildtype) and n = 3 (uaDf5), biologically independent samples. *P = 0.0229. In e and f, each biologically independent sample contained 40–60 animals; in g, each biologically independent sample contained about 150,000 animals; each dot stands for averaged value from 3 technical replicates in f,g; Two-tailed Student’s t test was used in d, f and g, One-way ANOVA was used in b; data shown represent mean ± S.E.M. *p<0.05, **p<0.01, ****p<0.0001.
Extended Data Fig. 5
Extended Data Fig. 5. ATFS-1 and POLG primarily interact with ΔmtDNAs in heteroplasmic worms.
a, Overview of the qPCR strategy to quantify the ΔmtDNA percentage in heteroplasmic worms or heteroplasmic cells. Plasmids containing a sequence specific to the ΔmtDNA or wildtype mtDNA were created. Standard curves were generated using the indicated concentration of each plasmid harboring sequences specific to either wildtype or ΔmtDNAs. Both PCR reactions were carried out simultaneously in the same qPCR machine. b, Scatter plots (b) and results (c) of 3D digital PCR quantification of wildtype mtDNA and ΔmtDNA following ATFS-1 ChIP-mtDNA in heteroplasmic uaDf5 worms. n = 4, biologically independent samples. d-e, Scatter plots (d) and results (e) of 3D digital PCR quantification of wildtype mtDNA and ΔmtDNA following POLG ChIP-mtDNA in heteroplasmic uaDf5 worms. n = 4, biologically independent samples. f, HMG-5/TFAM immunoblot of wildtype worms following fractionation into total lysate (T), post-mitochondrial supernatant (S), and mitochondrial pellet (M). Tubulin (Tub) and the OXPHOS component (NDUFS3) serve as loading controls. Representative immunoblots from two biological repeats. g, HMG-5/TFAM immunoblots of lysates from wildtype worms raised on control or hmg-5/tfam(RNAi). Tubulin (Tub) serves as a loading control. Representative immunoblots from three biological repeats. Each biologically independent sample contained 150,000 animals in c,e; data shown represent mean ± S.E.M.
Extended Data Fig. 6
Extended Data Fig. 6. Inhibition of LONP-1 improves the deleterious heteroplasmy ratio
a, LONP-1 immunoblots of lysates from wildtype worms raised on control(RNAi) or lonp-1(RNAi). Tubulin (Tub) serves as a loading control. Representative immunoblots from four biological repeats. b, ChIP-mtDNA using ATFS-1 or LONP-1 antibodies in wildtype worms followed by quantification of total mtDNA. n = 3, biologically independent samples. **P = 0.0042. c, ChIP-mtDNA using LONP-1 antibodies in wildtype or heteroplasmic worms followed by quantification of total mtDNA (both wildtype and ΔmtDNA). n = 3, biologically independent samples. d, ΔmtDNA quantification in atfs-1nuc(−);uaDf5 worms raised on control(RNAi) or lonp-1(RNAi). n = 3, biologically independent samples. *P = 0.0168. e, The brood size of heteroplasmic worms raised on control or lonp-1(RNAi). n = 9 worms. f, ΔmtDNA and wildtype mtDNA quantification following HMG-5/TFAM ChIP-mtDNA in uaDf5 heteroplasmic worms raised on lonp-1(RNAi) indicating that the binding of HMG-5/TFAM to wildtype mtDNAs or ΔmtDNAs is similar the input ratio. n = 4, biologically independent samples. g, wildtype mtDNA quantification in uaDf5 heteroplasmic worms raised on control(RNAi) or cco-1(RNAi). n = 3, biologically independent samples. **P = 0.0075. h, wildtype mtDNA quantification in uaDf5 or clk-1(qm30);uaDf5 heteroplasmic worms. n = 3, biologically independent samples. **P = 0.0029. In b,c and f, Each biologically independent sample contained 150,000 animals; in d,g,h each biologically independent sample contained 40–60 animals; every dot stands for averaged value from 3 technical replicates in b-d and f-h; Two-tailed Student’s t test was used; data shown represent mean ± S.E.M.
Extended Data Fig. 7
Extended Data Fig. 7. Pharmacological inhibition of LONP1 improves heteroplasmy and OXPHOS function in heteroplasmic cybrid cells
a, Mutant (G6930A) mtDNA ratio confirmation by sanger sequencing in CoxI G6930A cells treated by CDDO. b, Oxygen consumption rates (OCR) of 143B (wildtype) cells treated with DMSO (ctrl), 0.1 μM or 0.25 μM CDDO for 3 days. n = 22 (ctrl) and n = 24 (0.1 μM and 0.25 μM CDDO), biologically independent samples. c, Cell viability of 143b (WT) and KSS ΔmtDNA cells exposed to various concentrations of CDDO for 72 hours. n = 3, biologically independent samples. d, Basal respiration of KSS heteroplasmic cells treated with DMSO (ctrl), 0.1 μM or 0.25 μM CDDO for 4 or 13 weeks. n = 14 (ctrl) and n = 16 (0.1 μM and 0.25 μM CDDO), biologically independent samples. ****P <0.0001, Two-tailed Student’s t test. Data shown represent mean ± S.E.M.
Fig. 1 |
Fig. 1 |. OXPHOS dysfunction increases mtDNAs through ATFS-1.
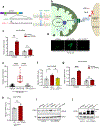
a, ATFS-1/UPRmt signaling schematic in healthy cells. b, Comparison of wildtype and uaDf5 deletion (ΔmtDNA) mtDNAs. c, Photomicrographs of hsp-6pr::gfp and hsp-6pr::gfp;uaDf5 worms (Scale bar 0.1 mm). Representative images from four biological repeats. d, Quantification of total mtDNA in homoplasmic wildtype, uaDf5 worms and uaDf5 worms raised on atfs-1(RNAi). n = 3, biologically independent samples. *P = 0.0176, **P = 0.0034. e, Photomicrographs of hsp-6pr::gfp worms raised on control (ctrl), cco-1 or cyc-1(RNAi). Representative images from four biological repeats. f, Photomicrographs of wildtype, isp-1(qm150) and clk-1(qm30);hsp-6pr::gfp worms. (Scale bar 0.1 mm). Representative images from four biological repeats. g, Quantification of total mtDNA in homoplasmic wildtype and atfs-1(null) worms raised on control(RNAi), cco-1(RNAi), or cyc-1(RNAi). n = 3, biologically independent samples. *P = 0.0128, **P = 0.002, ***P = 0.0005, ****P < 0.0001. h, Quantification of mtDNA in wildtype, isp-1(qm150), clk-1(qm30) or nduf-2.1(fc21) mutant worms raised on control(RNAi) or atfs-1(RNAi). n = 3 (WT, isp-1(qm150), isp-1(qm150) atfs-1(RNAi)), biologically independent samples. ***P = 0.0001 and 0.0005 (WT vs. isp-1(qm150) and isp-1(qm150) vs. isp-1(qm150) atfs-1(RNAi)). n = 4 (WT, clk-1(qm30)), n = 3 (clk-1(qm30) atfs-1(RNAi)), biologically independent samples. *P = 0.0443, **P = 0.0016 (WT, clk-1(qm30) and clk-1(qm30) atfs-1(RNAi)). n = 3 (WT, nduf-2.1(fc21) and nduf-2.1(fc21) vs. nduf-2.1(fc21) atfs-1(RNAi), biologically independent samples. *P = 0.0151 and 0.011 (WT vs. nduf-2.1(fc21) and nduf-2.1(fc21) vs. nduf-2.1(fc21) atfs-1(RNAi)). Each biologically independent sample contained 40–60 animals and every dot stands for averaged value from 3 technical replicates in d,g and h; One-way ANOVA was used in d,g and h; data shown represent mean ± S.E.M. *P < 0.05, **P < 0.01, ***P < 0.001, ****P < 0.0001.
Fig. 2 |
Fig. 2 |. Defective OXPHOS impedes the degradation of ATFS-1 and facilitates mitochondrial-localized ATFS-1 and POLG binding to mtDNAs.
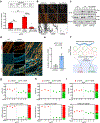
a, ATFS-1 immunoblots of wildtype worms raised on control or cco-1(RNAi) after fractionation into total lysate (T), post-mitochondrial supernatant (S), and mitochondrial pellet (M). Tubulin (Tub) and the OXPHOS component (NDUFS3) are used as loading controls. Arrow is mitochondrial-localized ATFS-1. Representative immunoblots from three biological repeats. b, atfs-1pr::atfs-1::gfp transgenic animals raised on control(RNAi) or cco-1(RNAi) with TMRE staining (Scale bar 5μm). Representative images from three biological repeats. c, Quantification of mtDNA following ATFS-1 ChIP-mtDNA in homoplasmic wildtype worms and homoplasmic atfs-1(null) worms raised on control or cco-1(RNAi). n = 4, biologically independent samples. *P = 0.0121. d, POLG immunoblots of wildtype worms raised on control or cco-1(RNAi) after mitochondrial fractionation. Representative immunoblots from three biological repeats. e, Quantification of total mtDNA following POLG ChIP-mtDNA in wildtype or atfs-1(null) homoplasmic worms. n = 3, biologically independent samples. ****P < 0.0001. f, Quantification of mtDNA following ATFS-1 ChIP-mtDNA in homoplasmic atfs-1nuc(−) worms and homoplasmic atfs-1(null) worms raised on control or cco-1(RNAi). n = 3, biologically independent samples. *P = 0.0363. g, Quantification of total mtDNA following POLG ChIP-mtDNA in homoplasmic atfs-1nuc(−) and atfs-1(null) worms raised on control or cco-1(RNAi). n = 3, biologically independent samples. *P = 0.0113. h, Quantification of total mtDNA in atfs-1nuc(−) homoplasmic worms raised on control(RNAi) or cco-1(RNAi). n = 3, biologically independent samples. **P = 0.0033. i, Quantification of total mtDNA in wildtype, clk-1(qm30) and clk-1(qm30);atfs-1nuc(−) homoplasmic wildtype worms. n = 4, biologically independent samples. **P = 0.0081, ***P = 0.0004, One-way ANOVA. Each biologically independent sample contained about 150,000 animals in c,e-g; contained 40–60 animals in h,i; every dot stands for averaged value from 3 technical replicates); Two-tailed Student’s t test was used in c and e-i; data shown represent mean ± S.E.M.
Fig. 3 |
Fig. 3 |. LONP-1 limits ATFS-1 binding to wildtype mtDNAs and impairs replication.
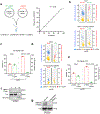
a, FLAG immunoblots of LONP-1FLAG worms following fractionation into total lysate (T), post-mitochondrial supernatant (S), and mitochondrial pellet (M). Tubulin (Tub) and the OXPHOS component NDUFS3 are loading controls. Representative immunoblots from four biological repeats. b, Quantification of mtDNA from homoplasmic LONP-1FLAG worms following ChIP-mtDNA using FLAG or control (Mock) antibody. n = 3, biologically independent samples. **P = 0.0018. c, LONP-1 consensus binding motif within mtDNA. d, ChIP-seq profile of mtDNA from homoplasmic LONP-1FLAG worms raised on control(RNAi) using FLAG antibody (red). e, Quantification of total mtDNA following ATFS-1 ChIP-mtDNA in wildtype or atfs-1(null) homoplasmic worms raised on control(RNAi) or lonp-1(RNAi). n = 3, biologically independent samples. *P = 0.0132. f, Quantification of mtDNA in homoplasmic wildtype and atfs-1(null) worms raised on control(RNAi) or lonp-1(RNAi). n = 4, biologically independent samples. *P < 0.05. g-h, atfs-1pr::atfs-1::gfp transgenic animals raised on control(RNAi) or lonp-1(RNAi) with TMRE staining (Scale bar 5μm) (g); Percentage of mitochondria with co-localized TMRE and ATFS-1::GFP. n = 10 ctrl(RNAi) and n = 11 lonp-1(RNAi), biologically independent samples. ****P < 0.0001 (h). i, Quantification of total mtDNA following POLG ChIP-mtDNA in wildtype homoplasmic worms raised on control(RNAi) or lonp-1(RNAi). n = 3, biologically independent samples. **P = 0.0012. j, Schematic of the relationship between LONP-1 activity, mitochondrial ATFS-1 accumulation and mtDNA replication. Each biologically independent sample contained about 150,000 worms in b,e,i; each sample contained 40–60 animals in f; every dot stands for averaged value from 3 technical replicates in b,e,f and i; Two-tailed Student’s t test was used; data shown represent mean ± S.E.M.
Fig. 4 |
Fig. 4 |. ATFS-1 and POLG primarily interact with ΔmtDNAs in heteroplasmic worms.
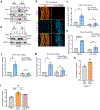
a, ΔmtDNA quantification as determined by qPCR in uaDf5 worms, atfs-1(null);uaDf5, pdr-1(tm598);uaDf5 and atfs-1(null);pdr-1(tm598);uaDf5 worms. n = 4 (uaDf5 and atfs-1(null);pdr-1(tm598);uaDf5) and n = 3 (atfs-1(null);uaDf5 and pdr-1(tm598);uaDf5) biologically independent samples. **P < 0.01 and ****P < 0.0001, One-way ANOVA. b, Images of TMRE-stained micrographs of heteroplasmic (ΔmtDNA) worms raised on control(RNAi), or wildtype worms raised on control or spg-7(RNAi). Scale bar, 10 μM. Representative images from four biological repeats. c, Immunoblots of wildtype worms raised on control or spg-7(RNAi) and heteroplasmic (ΔmtDNA) worms raised on control(RNAi) after fractionation into total lysate (T), post-mitochondrial supernatant (S), and mitochondrial pellet (M). Tubulin (Tub) and the OXPHOS component (NDUFS3) are used as loading controls. Arrow is mitochondrial-localized ATFS-1. Representative immunoblots from three biological repeats. d, atfs-1pr::atfs-1::gfp or atfs-1pr::atfs-1::gfp;uaDf5 transgenic animals with TMRE staining (Scale bar 5μm). Representative images from six biological repeats. e, Quantification of total mtDNA following ATFS-1 ChIP-mtDNA in homoplasmic wildtype or ΔmtDNA worms. n = 3 wildtype and n = 5 uaDf5 biologically independent samples. *P = 0.0226, two-tailed Student’s t test. f, Workflow of ATFS-1 or POLG ChIP-mtDNA and quantification of wildtype mtDNA and ΔmtDNA in heteroplasmic worms. g, Quantification of wildtype mtDNA and ΔmtDNA by qPCR following ATFS-1 ChIP-mtDNA in heteroplasmic worms. Post-lysis/Input ΔmtDNA ratio was 60%. n = 4, biologically independent samples. h, Quantification of wildtype mtDNA and ΔmtDNA by qPCR following POLG ChIP-mtDNA in heteroplasmic worms. Post-lysis/Input ΔmtDNA ratio was 54%. n = 3, biologically independent samples. i, Quantification of wildtype mtDNA and ΔmtDNA following TFAM IP-mtDNA in heteroplasmic worms. Post-lysis/Input ΔmtDNA ratio was 53%. n = 4, biologically independent samples. Each biologically independent sample contained 40–60 animals in a; each biologically independent sample contained about 150,000 worms in e,g-i; every dot stands for averaged value from 3 technical replicates in a,e and g-i; data shown represent mean ± S.E.M.
Fig. 5 |
Fig. 5 |. LONP-1 is required to maintain heteroplasmy.
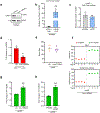
a, ΔmtDNA and wildtype mtDNA quantification by qPCR following LONP-1 ChIP-mtDNA in heteroplasmic worms. Post-lysis/Input ΔmtDNA ratio was 59%. n = 3, biologically independent samples. b, Quantification of wildtype mtDNA by qPCR in heteroplasmic worms raised on control(RNAi) or lonp-1(RNAi). n = 3, biologically independent samples. **P = 0.0041. c, Quantification of ΔmtDNA by qPCR in heteroplasmic uaDf5 worms raised on control(RNAi) or lonp-1(RNAi). n = 3, biologically independent samples. ****P < 0.0001. d, ΔmtDNA and wild-type mtDNA quantification by qPCR following ATFS-1 ChIP-mtDNA in heteroplasmic worms raised on control(RNAi) or lonp-1(RNAi). n = 4, biologically independent samples. e-f, atfs-1pr::atfs-1::gfp;uaDf5 transgenic animals raised on control(RNAi) or lonp-1(RNAi) with TMRE staining (Scale bar 5μm) (e); Percentage of mitochondria with co-localized TMRE and ATFS-1::GFP. n = 8 uaDf5 ctrl(RNAi) and n = 9 uaDf5 lonp-1(RNAi), biologically independent samples (f). g, ΔmtDNA and wild-type mtDNA quantification by qPCR following POLG ChIP-mtDNA in heteroplasmic worms raised on lonp-1(RNAi). Post-lysis/Input ΔmtDNA ratio was 25%. n = 4, biologically independent samples. Each biologically independent sample contained about 150,000 animals in a,d,g; each biological replicate contained 40–60 animals in b,c; every dot stands for averaged value from 3 technical replicates in a-d and g; Two-tailed Student’s t test was used in b,c and f; data shown represent mean ± S.E.M.
Fig. 6 |
Fig. 6 |. LONP1 inhibition improves heteroplasmy in cybrid cells.
a, Schematic comparing human wildtype, KSS deletion (ΔmtDNA) and CoxI G6930A mtDNAs. b, LONP1 immunoblots from KSS heteroplasmic cells treated with hLONP1 or control (NC) siRNA. Tubulin (Tub) serves as a loading control. Representative immunoblots from three biological repeats. c, WT mtDNA quantification in KSS cells treated with control or hLONP1 siRNA. n = 4, biologically independent samples. **P = 0.0021. d, Quantification of KSS ΔmtDNA in cells treated with control or hLONP1 siRNA. n = 4, biologically independent samples. *P = 0.0185. e, Chemical structure of CDDO. f, Quantification of G6930A mtDNA percentage following treatment with DMSO, 0.1 μM CDDO, or 0.25 μM CDDO at the indicated time points up to 130 days. n = 3, biologically independent samples. *P < 0.05. g, ΔmtDNA quantification in KSS heteroplasmic cells treated with DMSO, 0.1 μM CDDO, or 0.25 μM for 4 or 13 weeks. h, Cell viability of 143b (WT) and CoxI G6930A cells exposed to the indicated concentration of CDDO for 72 hours. n = 3 in 143b(WT) cell or CoxI G6930A cell, biologically independent samples. Every dot stands for averaged value from 3 technical replicates in c,d; Two-tailed Student’s t test was used in c,d and f; data shown in c, d and h represent mean ± S.E.M.
Fig. 7 |
Fig. 7 |. Pharmacological inhibition of LONP1 improves heteroplasmy and OXPHOS function in cybrid cells.
a, Percentage of CoxI G6930A mtDNA in cells treated with DMSO, 0.1 μM or 0.25 μM CDDO for 3, 5, 10 or 18.5 weeks. n = 3, biologically independent samples. These data are extracted from Fig. 6f. b, Oxygen consumption rates (OCR) of CoxI G6930A cells treated with DMSO, 0.1 μM or 0.25 μM CDDO for 3, 5, 10 or 18.5 weeks. c, Quantification of basal respiration. In 3 weeks, n = 10 (ctrl), n = 16 (0.1 μM) and n = 16 (0.25 μM), biologically independent samples. **P = 0.0028, ****P <0.0001. In 5 weeks, n = 24 (ctrl), n = 24 (0.1 μM) and n = 22 (0.25 μM), biologically independent samples. ****P < 0.0001. In 10 weeks, n = 16 (ctrl), n = 10 (0.1 μM) and n = 15 (0.25 μM), biologically independent samples. ****P < 0.0001. In 18.5 weeks, n = 16 (ctrl, 0.1 μM and 0.25 μM), biologically independent samples. ****P < 0.0001. d, Quantification of respiratory capacity. In 3 weeks, n = 10 (ctrl), n = 16 (0.1 μM) and n = 16 (0.25 μM), biologically independent samples. **P = 0.0086, ***P = 0.0002. In 5 weeks, n = 24 (ctrl), n = 24 (0.1 μM) and n = 22 (0.25 μM), biologically independent samples. ****P < 0.0001. In 10 weeks, n = 16 (ctrl), n = 10 (0.1 μM) and n = 15 (0.25 μM), biologically independent samples. ****P < 0.0001. In 18.5 weeks, n = 16 (ctrl, 0.1 μM and 0.25 μM), biologically independent samples. ****P < 0.0001. Every dot stands for averaged value from 4 technical replicates in c,d; Two-tailed Student’s t test was used in c,d; data shown in b-d represent mean ± S.E.M..

Comment in

References

    1. Baker BM & Haynes CM Mitochondrial protein quality control during biogenesis and aging. Trends in biochemical sciences 36, 254–261 (2011). - PubMed
    1. Wai T, Teoli D & Shoubridge EA The mitochondrial DNA genetic bottleneck results from replication of a subpopulation of genomes. Nature genetics 40, 1484–1488 (2008). - PubMed
    1. Gorman GS et al. Prevalence of nuclear and mitochondrial DNA mutations related to adult mitochondrial disease. Annals of Neurology 77, 753–759 (2015). - PMC - PubMed
    1. Srivastava S & Moraes CT Manipulating mitochondrial DNA heteroplasmy by a mitochondrially targeted restriction endonuclease. Human molecular genetics 10, 3093–3099 (2001). - PubMed
    1. Tanaka M et al. Gene therapy for mitochondrial disease by delivering restriction endonucleaseSmaI into mitochondria. Journal of biomedical science 9, 534–541 (2002). - PubMed

Publication types

MeSH terms