. 2022 Feb;24(2):148-154.
doi: 10.1038/s41556-021-00837-0. Epub 2022 Feb 14.

Metabolic determination of cell fate through selective inheritance of mitochondria

Affiliations

Metabolic determination of cell fate through selective inheritance of mitochondria

Julia Döhla et al. Nat Cell Biol. 2022 Feb.

Abstract

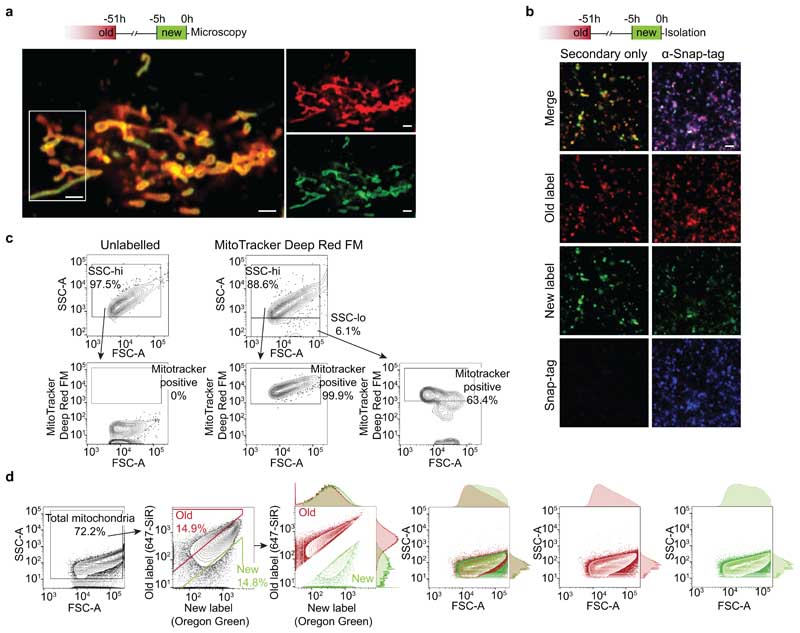
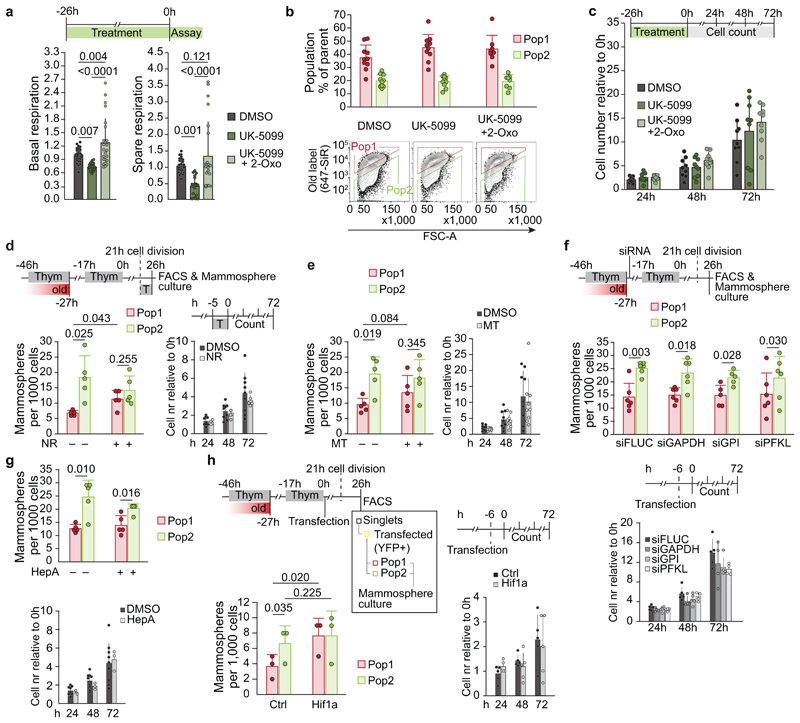
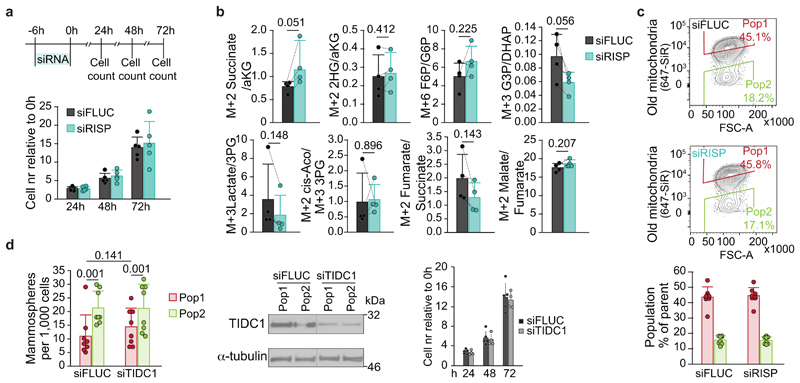
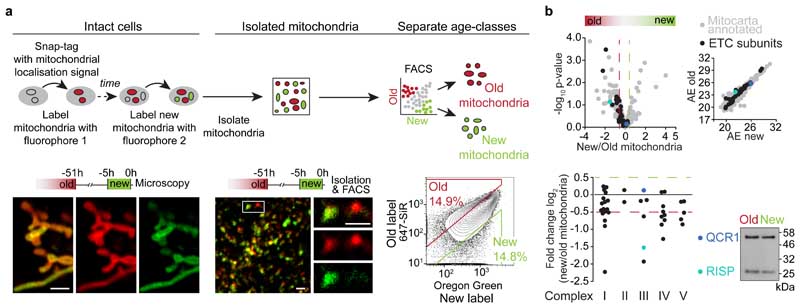
Metabolic characteristics of adult stem cells are distinct from their differentiated progeny, and cellular metabolism is emerging as a potential driver of cell fate conversions1-4. How these metabolic features are established remains unclear. Here we identified inherited metabolism imposed by functionally distinct mitochondrial age-classes as a fate determinant in asymmetric division of epithelial stem-like cells. While chronologically old mitochondria support oxidative respiration, the electron transport chain of new organelles is proteomically immature and they respire less. After cell division, selectively segregated mitochondrial age-classes elicit a metabolic bias in progeny cells, with oxidative energy metabolism promoting differentiation in cells that inherit old mitochondria. Cells that inherit newly synthesized mitochondria with low levels of Rieske iron-sulfur polypeptide 1 have a higher pentose phosphate pathway activity, which promotes de novo purine biosynthesis and redox balance, and is required to maintain stemness during early fate determination after division. Our results demonstrate that fate decisions are susceptible to intrinsic metabolic bias imposed by selectively inherited mitochondria.


Conflict of interest statement

Competing interests

The authors declare no competing interests.

Figures

Extended Data Figure 1
Extended Data Figure 2
Extended Data Figure 3
Extended Data Figure 4
Extended Data Figure 5
Extended Data Figure 6
Extended Data Figure 7
Extended Data Figure 8
Extended Data Figure 9
Extended Data Figure 10
Figure 1
Figure 1. Mitochondrial maturation with chronological age.
a, Experimental setup for age-specific mitochondrial labelling, isolation and separation of old and new mitochondria. Images show age-specifically labelled mitochondria in an intact living cell (left), after isolation (centre), and during age-selective single-organelle sorting (right). Microscopy images show a single confocal plane, and the FACS plot illustrates selection of mitochondria used for further analyses. Scale bars, 1.5 μm. b, Proteomic analysis of isolated old and new mitochondria (n = 3 isolations). Relative enrichment (log2 fold change) and average expression (AE) (upper) of mitochondrial proteins , in old and new mitochondria (shown in grey, with electron transport chain (ETC) subunits and selected proteins highlighted). Cut-off-values for enrichment, > 0.5 and < -0.5, were chosen based on the mean coefficient of variation for new and old mitochondrial samples (0.37 and 0.38, respectively). Relative enrichment (lower) of ETC subunits in old and new mitochondria, with proteins grouped by complex. Immunoblot validation is shown for QCR1 (unchanged) and RISP (enriched in old mitochondria). Statistical testing details in Supplementary Data Table 1. Numerical source data are available in Source Data Table 1 and unprocessed blots are available in Source Data Figure 1.
Figure 2
Figure 2. Age of inherited mitochondria predicts progeny cell metabolism.
a, Membrane potential, representative TMRM FACS plots in isolated old and new mitochondria and quantitation of median fluorescence intensity (FI). Mean ± s.d. of three experiments. OG: Oregon Green b, Mitochondrial superoxide in mitochondrial domains enriched for old (arrow) or new (arrowhead) mitochondria label within intact cells. Maximum intensity projection of 1.2 μm (live cell imaging). Scale bars 1.5 μm. Quantitation of MitoSOX relative FI in individual mitochondria, 546 segmented mitochondrial domains from seven cells comparing mitochondria enriched for new (below first quartile of old/new ratio) and old label (above third quartile). c, Old mitochondria and MitoSOX during cytokinesis. Maximum intensity projection of two planes (live cell imaging). Scale bar 5 μm. Distribution of total fluorescence as fraction per cell within a cell pair (P1 and P2) in division from 58 pairs in five experiments. 25 pairs were asymmetric for of old mitochondria inheritance. Asymmetry cut-off: 1.5-fold enrichment of old mitochondria (P1/P2 ratio > 60/40 %). d, Oxygen consumption rate (OCR) of Pop1 and Pop2 cells FACS-sorted by inheritance of old mitochondria. Representative FACS plot and OCR curves from one experiment (Pop1 seven, Pop2 five repeats). Bar graphs show data (pmol/min) from three experiments (Pop1 14, Pop2 13 repeats). Mean ± s.d.. e, Redox balance in Pop1 and Pop2 cells FACS-sorted by inheritance of old mitochondria. NAD+/NADH and GSSG/GSH ratio in Pop1 cells compared to Pop2 cells from the same experiment, mean ± s.d. of five (NAD+/NADH) and seven (GSSG/GSH) biological replicates. f, Mammosphere formation (left) after treatment with UK-5099 for 26h alone or in combination with 2-Oxo, or DMSO prior to FACS-sorting by inheritance of old mitochondria. Mean ± s.d. of UK-5099 18, UK-5099 + 2-Oxo 11 and DMSO 13 biological replicates. Representative OCR curves (right) for cells treated with UK-5099 (seven replicates), UK-5099 and 2-Oxo (eleven replicates), or DMSO (seven replicates) from two experiments. Treatments were maintained during the assay. Mean ± s.d. UK-5099: 10 μM, 2-Oxo: 400 μM. Statistical testing details in Supplementary Data Table 1. Numerical source data are available in Source Data Table 2.
Figure 3
Figure 3. Inherited metabolic cell fate bias is dependent on the pentose phosphate pathway.
a-b LC-MS/MS analysis of TCA cycle (1st turn) and glycolysis metabolites tracing from a one or two-hour pulse of U-13C glucose. Data shown as log2 metabolite levels (peak area/relative cell number) in a, Pop2/Pop1 cells (four biological repeats per time point) from the same experiment. Green lines indicate mean, b, cells treated with 10 μM UK-5099 for 24h (three biological replicates) relative to the mean of DMSO treated samples (four biological replicates). Black lines indicate mean. Empty circles denote metabolites undetected or below background level. Schematics show experimental strategy and 13C-labelling patterns in the TCA cycle and in glycolysis. c, Cumulative lactate production during the first 20 hours after FACS-sorting. Data are mean ± s.d. of six biological replicates. d, IMP M+5 relative to Ru5P M+5 derived from the pentose phosphate pathway in Pop1 and Pop2 cells. Data are mean ± s.d of eight biological replicates. e, LC-MS/MS analysis of M+1 and M+2 lactate in media secreted from Pop1 and Pop2 cells treated with a one-hour pulse of 1,2-13C glucose after FACS-sorting. Ratio, mean ± s.d., of M+1 to M+2 isotopomers derived via the pentose phosphate pathway (M+1) or directly from glycolysis (M+2) in six biological replicates. f, Mammosphere forming capacity of cells pre-treated with a five-hour pulse of PPP inhibitor 10 μM (6-AN) or DMSO. Data are mean ± s.d. of four biological replicates. g, Reconstitution efficiency (left) of the mammary epithelium in cleared fat pads transplanted with MMECs pre-treated with 500 μM 6-AN or DMSO for 24 hours before transplantation. Bar graphs show reconstitution efficiency as percentage of glands reaching 25, 50, 75, or 100 percent reconstitution. n shows the number of successful transplants out of 14 mice transplanted with DMSO- and 6-AN-treated cells to contralateral sides: 5/14 and 8/14, not significantly different. Whole-mounts of carmine-alumn stained mammary glands (right) with 100 (DMSO) and 25 (6-AN) percent reconstitution. Scale bar is 5mm. Statistical testing details in Supplementary Data Table 1. Numerical source data are available in Source Data Table 3.
Figure 4
Figure 4. RISP is required for oxidative metabolism and reduced stemness of cells inheriting more old mitochondria.
a, Microscopy images show RISP immunofluorescent staining in mitochondrial domains enriched for old or new label. A representative area of a confocal image (maximum intensity projection) is shown. Scale bar, four left panels 5 μm, four right panels 2 μm. b, Quantitation of immunofluorescent staining for QCR1 and RISP in mitochondrial domains enriched for old or new label within intact cells. Pooled analysis of segmented mitochondrial domains from 4 cells each, comparing relative staining intensity in mitochondria enriched for new (below first quartile of old/new label ratio) and old label (above third quartile). c, Western blot showing RISP expression in Pop1 and Pop2 cells, one out of eight biological replicates presented also in f. Cells treated with the indicated siRNAs two days prior to FACS-sorting by inheritance of old mitochondria according to the schematic. d, Oxygen consumption rate (OCR) relative to cell number for cells treated with the indicated siRNAs. Representative OCR curves from one experiment (siFLUC: six, siRISP: five repeats), and spare respiratory capacity, pmol/min/relative cell number, (siFLUC: 25 repeats, siRISP: 28 repeats from four experiments). Data are mean ± s.d.. e, LC-MS/MS analysis of TCA cycle (1st turn) and glycolysis metabolites tracing from a two-hour pulse of U-13C glucose in cells transfected with the indicated siRNAs. Data shown as log2 metabolite levels (left) in siRISP cells relative to siFLUC cells from the same experiment. Blue lines indicate mean of four biological replicates. IMP M+5 relative to Ru5P M+5 (right) derived from the pentose phosphate pathway in cells transfected with siRNA for RISP or FLUC. Data are mean ± s.d. of four experiments. f, Mammosphere forming capacity of Pop1 and Pop2 cells treated with indicated siRNAs two days prior to FACS-sorting by inheritance of old mitochondria according to the schematic on top. Data are mean ± s.d. of eight biological replicates. Details of statistical analysis in Supplementary Data Table 1. Numerical source data are available in Source Data Table 4 and unprocessed blots are available in Source Data Figure 4.

Comment in

References

    1. Folmes CDL, Dzeja PP, Nelson TJ, Terzic A. Metabolic plasticity in stem cell homeostasis and differentiation. Cell Stem Cell. 2012;11:596–606. - PMC - PubMed
    1. Vacanti NM, Metallo CM. Exploring metabolic pathways that contribute to the stem cell phenotype. Biochim Biophys Acta - Gen Subj. 2013;1830:2361–2369. - PubMed
    1. Chandel NS, Jasper H, Ho TT, Passegué E. Metabolic regulation of stem cell function in tissue homeostasis and organismal ageing. Nat Cell Biol. 2016;18:823–832. - PubMed
    1. Shyh-Chang N, Ng HH. The metabolic programming of stem cells. Genes Dev. 2017;31:336–346. - PMC - PubMed
    1. Ron-Harel N, et al. Mitochondrial Biogenesis and Proteome Remodeling Promote One-Carbon Metabolism for T Cell Activation. Cell Metab. 2016;24:104–117. - PMC - PubMed

Publication types

MeSH terms

LinkOut - more resources