. 2022 Feb;24(2):168-180.
doi: 10.1038/s41556-022-00843-w. Epub 2022 Feb 14.

Mitochondrial fission links ECM mechanotransduction to metabolic redox homeostasis and metastatic chemotherapy resistance

Affiliations

Mitochondrial fission links ECM mechanotransduction to metabolic redox homeostasis and metastatic chemotherapy resistance

Patrizia Romani et al. Nat Cell Biol. 2022 Feb.

Abstract

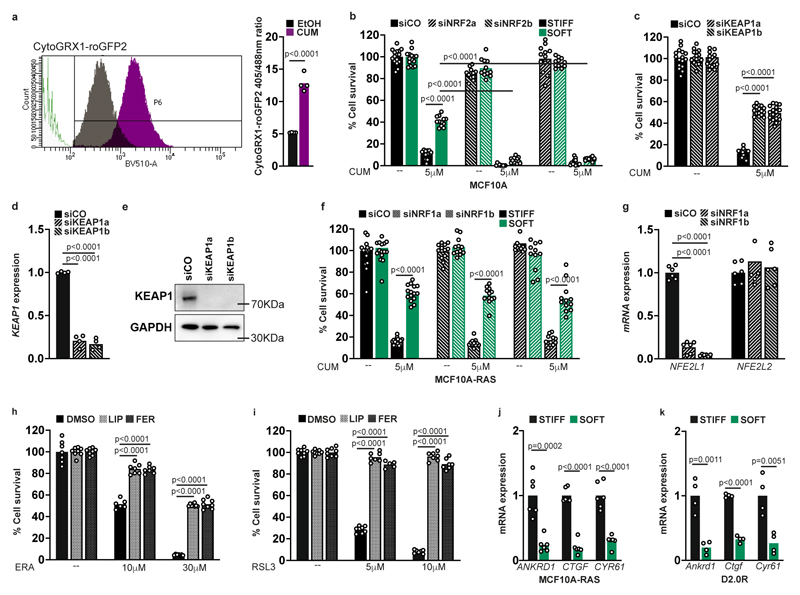
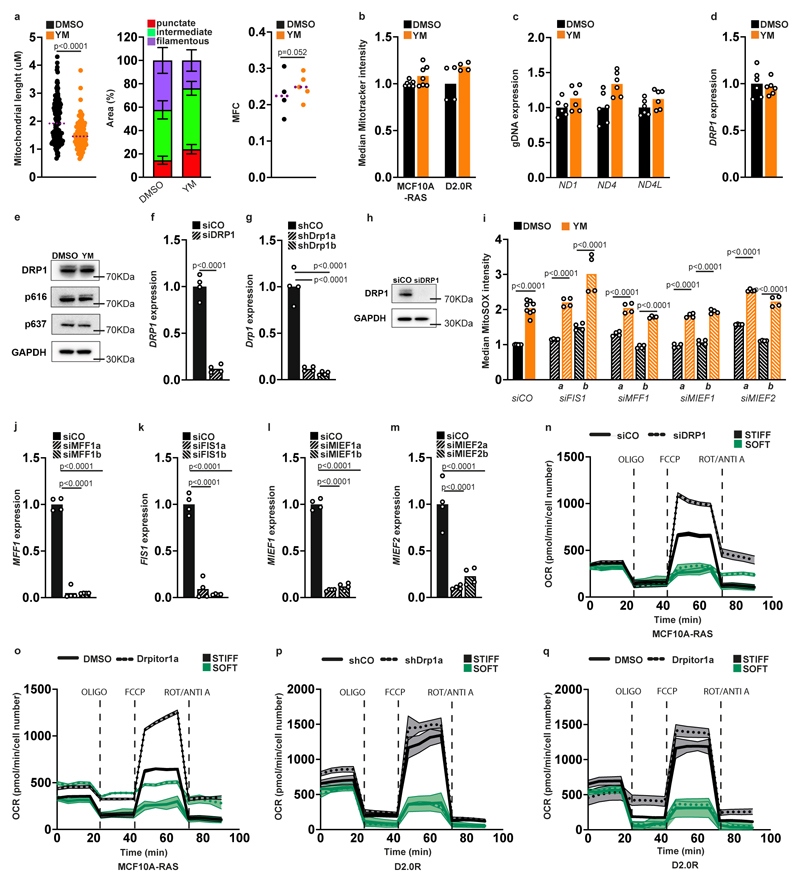
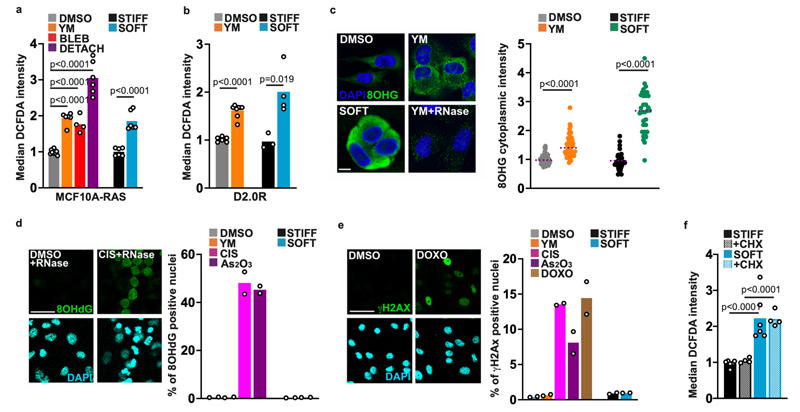
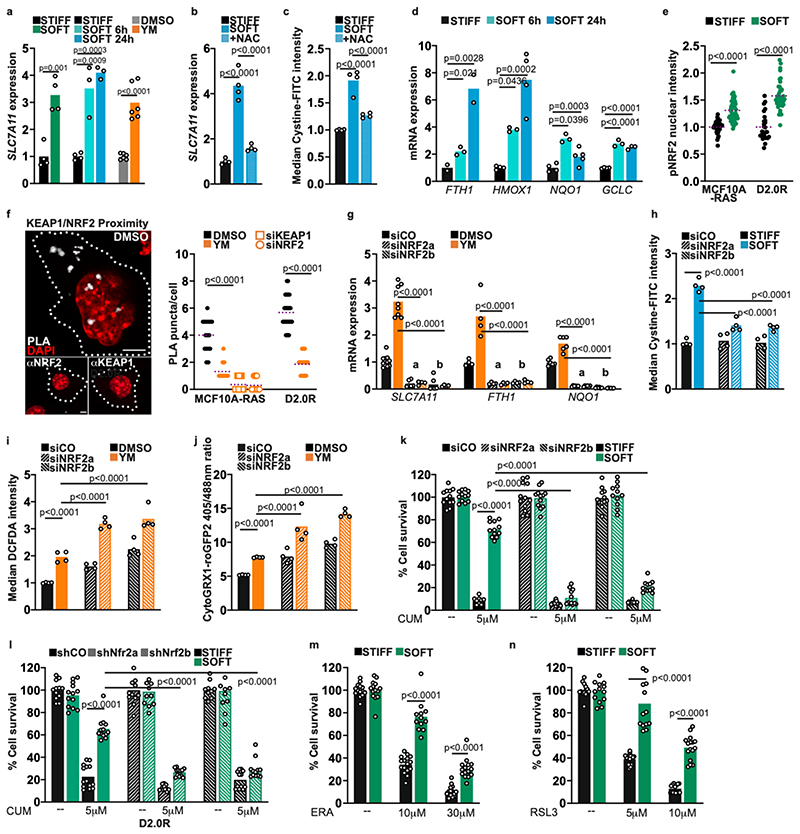
Metastatic breast cancer cells disseminate to organs with a soft microenvironment. Whether and how the mechanical properties of the local tissue influence their response to treatment remains unclear. Here we found that a soft extracellular matrix empowers redox homeostasis. Cells cultured on a soft extracellular matrix display increased peri-mitochondrial F-actin, promoted by Spire1C and Arp2/3 nucleation factors, and increased DRP1- and MIEF1/2-dependent mitochondrial fission. Changes in mitochondrial dynamics lead to increased production of mitochondrial reactive oxygen species and activate the NRF2 antioxidant transcriptional response, including increased cystine uptake and glutathione metabolism. This retrograde response endows cells with resistance to oxidative stress and reactive oxygen species-dependent chemotherapy drugs. This is relevant in a mouse model of metastatic breast cancer cells dormant in the lung soft tissue, where inhibition of DRP1 and NRF2 restored cisplatin sensitivity and prevented disseminated cancer-cell awakening. We propose that targeting this mitochondrial dynamics- and redox-based mechanotransduction pathway could open avenues to prevent metastatic relapse.


Conflict of interest statement

Competing interests

The invention of Drpitor1a is the subject of a US Patent Application 20200323829 from D.W. and S.L.A. The remaining authors declare no competing interests.

Figures

Fig. 7
Fig. 7. A soft ECM increases resistance to Cisplatin and As2O3 chemotherapy through NRF2 and DRP1.
a,b, Cell survival in D2.0R cells treated for 48 h with the indicated concentrations of Cisplatin (a) or As2O3 (b), in combination with N-Acetyl-L-cysteine (NAC) (n=16 all conditions). c,d. Cell survival in D2.0R cells cultured on stiff or soft Matrigel substrata, and treated for 48 h with the indicated concentrations of Cisplatin (c) or As2O3 (d) (in c n=10 (VEHICLE STIFF and SOFT) n=14 all other conditions; in d n=12 (VEHICLE STIFF and SOFT) n=11 (As2O3 STIFF) n=14 all other conditions). e,f. Cell survival in D2.0R cells stably expressing control shRNA or two independent NRF2 shRNAs. Cells were cultured and treated as above (in e n=9 (shNrf2a VEHICLE and shNrf2b VEHICLE) n=11 (shNrf2a SOFT and shNrf2b SOFT) n=16 (shCO CISPLATIN STIFF) n=13 all other conditions; in f n=8 (shNrf2b VEHICLE STIFF and SOFT) n=9 (shCO VEHICLE SOFT and shCO As2O3 STIFF) n=10 (shNrf2b As2O3 STIFF and SOFT) n=11 (shNrf2a VEHICLE STIFF and SOFT, shNrf2a As2O3 STIFF) n=12 (shCO VEHICLE STIFF, shCO As2O3 SOFT and shNrf2a VEHICLE STIFF)). g,h. Cell survival in D2.0R cells stably expressing control shRNA, two independent DRP1 shRNAs, or treated with the Drpitor1a DRP1 inhibitor. Cells were cultured and treated as above (in g n=6 (shDrp1a STIFF CISPLATIN and shDRP1b STIFF CISPLATIN); n=12 (DRPITOR); n=8 all the other conditions; in h n=6 (shCO SOFT As2O3, shDrp1a SOFT As2O3 and shDRP1b SOFT As2O3); n=8 all the other conditions). All experiments normalized to mean cell number in controls. ‘n’ refers to the number of biologically independent samples across two independent experiments each bar. Data are mean and single points with Dunnet’s tests. See Source Data Table 7.
Fig. 8
Fig. 8. A soft metastatic niche protects dormant breast cancer cells from chemotherapy.
a, Immunofluorescence on D2.0R cells cultured on soft Matrigel for 2 (EARLY) or 14 days (LATE). Collagen-I, Phalloidin (F-actin) and nuclear YAP/TAZ are indicative of increased ECM stiffness at 14 days (see Extended Data Fig. 8a). Scale bars = 10 μm. b, secondary ROS adducts in D2.0R cells cultured on stiff Matrigel (24h), soft Matrigel (24h, 48h, 7d) and stiffened soft Matrigel (14d, LATE). Samples normalized to the mean intensity in the controls (8OHG n=63 (STIFF) n=59 (SOFT 24h) n=79 (SOFT 48h) n=109 (SOFT 7d and SOFT 14d); 4HNE n=51 (STIFF) n=60 (SOFT 24h) n=30(SOFT 48h and SOFT 7d) n=60 (SOFT l4d)). c, Cell survival in D2.0R cells cultured as in b for the indicated time-points and then treated for 48 h with Cisplatin l0μM (n=120). d, tissue stiffness by atomic force microscopy on mouse mammary glands, primary D2.0R mammary tumors (1.5 months) and normal lungs, using fresh tissue vibratome sections (n=16 (MAMMARY and LUNG) n= 19 (MAMMARY TUMOR) samplings from 4 sections coming from two mice). e,f, ROS adducts (e) and glutathione redox analysis (f) in D2.0R cells cultured on mouse lung decellularized ECM slices that had been previously incubated with Ribose (RIB), or obtained from fibrotic lungs (FIB) (8OHG n=99 (LUNG ECM and LUNG ECM+RIB) n=148 (LUNG ECM) n=123 (LUNG ECM +FIB); 4HNE n= 99 (LUNG ECM and LUNG ECM+RIB) n=133 (LUNG ECM) n=108 (LUNG ECM+FIB)). g, qPCR in D2.0R cells cultured on plastics, infiltrated into normal or fibrotic (FIB) decellularized lung ECM scaffolds. mRNA expression relative to GAPDH normalized to control (n=8 biologically independent samples pooled across two independent experiments for PLASTIC and LUNG ECM; n=2 biologically independent samples from one experiment for LUNG ECM+FIB). h, tissue stiffness by atomic force microscopy on normal lungs (WT), lungs with early quiescent (14 days, EARLY) and late relapsing (1.5 months, LATE) disseminated D2.0R cells, using frozen tissue microtome sections (n=7 (WT) n=16 (EARLY) n=15 (LATE) sections coming from two mice). i, Immunofluorescence on D2.0R cells disseminated in the mouse lung at early (14 days) and late (1.5 months) time-points. Scale bars = 10 μm. j,k, ROS adducts (j) and glutathione redox analysis (k) in D2.0R cells disseminated in the mouse lung at early and late time-points (in j 8OHG n=25 (EARLY and LATE); 4HNE n=25 (EARLY and LATE; in k n=33 (EARLY and LATE)). l,m. Bioluminescent intravital quantification of lung metastatic burden by GFP/Fluc D2.0R cell lines expressing control or NRF2 shRNAs (l) or DRP1 shRNAs. (m), and treated with Cisplatin at early time-points (see Extended Data Fig. 9a). Total photon flux (photons/s) for each mouse at day 0 (injection) was set to 1, and all other time-points are relative to this (n=6 mice for each condition). In l.m mice were sacrificed at humane endpoint. Images in a,i are representative of two independent experiments or mice with similar results Data are mean and single points, except l,m (mean). ‘n’ refers to cells pooled across two independent experiments (b,c,e,f) and cells pooled across three mice (j,k) Unpaired two-tailed Student’s t-tests for (e,f,j,k,l,m), Dunnet’s tests for (b,c,d,h). See Source Data Table 8.
Extended Data Fig. 1
Extended Data Fig. 1. ECM stiffness regulates cystine metabolism and glutathione oxidation.
a, A simplified scheme depicting the major metabolic intermediates of the glutathione synthesis pathway, together with the enzymes mediating each reaction. In blue, the intermediates increased in MCF10A-RAS cells cultured in conditions of decreased actomyosin contractility. b, Representative gating scheme for quantification of FITC-labeled cystine uptake by flow cytometry. Cells without stain were used as negative control (outlined white area). Cells treated with Y27632 and ML7 (YM - orange) display increased uptake compared to DMSO (grey), while treatment with the sulfasalazine (SAS - purple) inhibitor of the cystine transporter inhibits uptake. Scale bar, 50 μm. On the right: quantification of FITC-labeled cystine uptake. Data are mean and single points relative to DMSO (black bar). P-values by Dunnet’s test from a sample size of n=4 biologically independent samples pooled across two independent experiments for each bar. c,d, Glutathione redox analysis using the mitochondrial mito-Grx1-roGFP2 sensor in MCF10A-RAS cells treated with YM (c), or cultured on stiff or soft Matrigel substrata (d). Data are mean and single cells. P-values by Dunnet’s test or Student’s t-test from a sample size of n=21 in c and n=31 in d cells pooled across two independent experiments for each bar. e-g, Direct quantification of reduced (GSH, e) and oxidised (GSSH, f) glutathione in extracts from MCF10A-RAS cells treated with YM for 24 h. The ratio of reduced to oxidized glutathione was calculated in g. Data are mean and single points. n=2 independent experiments. Images in b,c are representative of two independent experiments with similar results. See Source Data Extended Data Fig. 1.
Extended Data Fig. 2
Extended Data Fig. 2. ECM stiffness regulates ROS levels.
a, NADPH redox analysis using the iNap1 sensor in MCF10A-RAS cells treated with YM. Co-treatment with Diamide (DIA) and the G6PD inhibitor DHEA serves as positive control for NADPH depletion. iNapC is a NADP-insensitive and pH-sensitive control sensor (n=35 cells pooled across two independent experiments for each bar; unpaired two-tailed Student’s t-test). b,c, Representative gating schemes and quantifications of DCFDA (b) and MitoSOX (c) oxidation by flow cytometry. Cells without stain were used as negative control (outlined white area). Cells treated with the positive control cumene hydroperoxide (CUM - purple) display increased uptake compared to DMSO (grey). Median intensity in the controls were set to 1, and other samples are relative to these (n=6 biologically independent samples pooled across three independent experiments for each bar; unpaired two-tailed Student’s t-test). d-i, Quantification of reactive-oxygen species by the DCFDA and MitoSOX reagents in MCF10A, MCF10A-RAS and D2.0R cells. Median intensity in the controls were set to 1, and other samples are relative to these (in d n=4 (STIFF) and n=5 (all other conditions); in e n=11 (DMSO) n=6 (YM and SOFT) n=5 (BLEBBI) n=8 (STIFF); in f n=4 (STIFF) n=5 (all other conditions); in g n=4 (DMSO and YM) n=6 (STIFF and SOFT); in h n=6 (DMSO, YM6h and YM 24h) n=4 (YM1h and YM 3h); in i n=5 (YM 1h) and n=6 (all other conditions) biologically independent samples pooled across two independent experiments; unpaired two-tailed Student’s t-test or Dunnet’s test). j, Representative gating scheme and quantification of C11-Bodipy-581/591 lipid peroxidation by flow cytometry. Cells without C11-Bodipy-581/591 were used as negative control (outlined white area). Cells treated with cumene hydroperoxide (CUM - dark purple) or with the GPX4 lipid hydroperoxide glutathione peroxidase inhibitor RSL3 (blue) for 3 h were used as positive controls. Mean intensity in the controls were set to 1, and other samples are relative to these (n=4 biologically independent samples pooled across two independent experiments for each bar; Dunnet’s test). k, l, Quantification of C11-Bodipy-581/591 lipid peroxidation in MCF10A-RAS and D2.0R cells treated with YM for 3 h or cultured on Fibronectin-coated stiff or soft acrylamide hydrogels. Median intensity in the controls were set to 1, and other samples are relative to these (n=4 biologically independent samples pooled across two independent experiments for each bar; unpaired two-tailed Student’s t-test). m, Immunofluorescence of 4-hydroxy-2-nonenal (4HNE) lipid peroxidation adducts in MCF10A-RAS cells cultured on stiff or soft Matrigel substrata for 24 h. Images are representative of at two experiments with similar results. Scale bar, 5 μm. Mean intensity in the controls were set to 1, and other samples are relative to these (n=36 (STIFF) n=34 (SOFT) cells pooled across two independent experiments; unpaired two-tailed Student’s t-test). Data are mean and single points. See Source Data Extended Data Fig. 2.
Extended Data Fig. 3
Extended Data Fig. 3. ECM stiffness regulates NRF2 activity.
a,b, qPCR for established NRF2 target genes in D2.0R and MCF10A cells treated with YM for 6 h (in a FTH1 n=2 (DMSO) n=4 (YM); HMOX1 n=2 (DMSO) n=4 (YM); NQO1 n=2 (DMSO) n=4 (YM); GCLC n=2 (DMSO) n=4 (YM); SLC7A11 n=7 (DMSO) n=5 (YM) independent samples pooled across two independent experiments; in b HMOX1 n=8; FTH1 n=8 (DMSO) n=7 (YM); GCLC n=8 (DMSO) n=6 (YM); GCLM n=8 (DMSO) n=6 (YM); SLC7A11 n=8 (DMSO) n=6 (YM) independent samples pooled across two independent experiments; unpaired two-tailed Student’s t-tests. c qPCR for established NRF2 target genes in D2.0R cells cultured on Matrigel substrata of different stiffness. (Fth1 n=7(STIFF) n=5 (SOFT); Hmox1 n=4; Nqo1 n=7; Gclm n=4; SLC7A11 n=6 (STIFF) n=5 (SOFT) independent samples pooled across two independent experiments; unpaired two-tailed Student’s t-tests. d qPCR for established NRF2 target genes in MCF10A-RAS (FTH1 n=4; HMOX1 n=6 (DMSO and YM) n=4 (Ki696); NQO1 n=6 (DMSO and YM) n=4 (ki696); GCLC n=6 (DMSO and YM) n=4 (ki696) independent samples pooled across two independent experiments; unpaired two-tailed Student’s t-tests. e-g, qPCR for established YAP/TAZ targets in D2.oR (e) and NRF2 and YAP/TAZ target genes in MCF10A-RAS (f,g). YAP/TAZ targets serve as internal positive controls.(in e n=4, in f n=4, in g n=10 samples pooled across two independent experiments for each bars; unpaired two-tailed Student’s t-tests). h, qPCR for established NRF2 target genes in MCF10A cells cultured on soft (E≈0.2kPa) or stiff (E≈50kPa) CollagenI-coated hydrogels of different stiffness (n=4 samples pooled across two independent experiments for each bars; unpaired two-tailed Student’s t-tests). i, Quantification of active nuclear S40-phosphorylated NRF2 (pNRF2) intensity from immunofluorescence stainings of MCF10A-RAS and D2.0R cells cultured on stiff or soft Matrigel substrata. KI696 is a KEAP1 inhibitor used as a positive control. Mean levels in the controls were set to 1, and other samples are relative to these (n=59 (DMSO) n=60 (YM and ki696) cells were imaged for each condition, pooled across two independent experiments; unpaired two-tailed Student’s t-tests). j, qPCR to control for efficient knockdown of NE2L2 (encoding for NRF2) in MCF10A-RAS (n=10 (siCO) n=8 (siNRF2a and siNRF2b) samples pooled across two independent experiments for each bars; unpaired twotailed Student’s t-tests). k, Immunoblotting for endogenous NRF2 from extracts of MCF10A-RAS cells transfected with the indicated siRNAs. Equal total proteins were loaded in each lane, and GAPDH was used as loading control. Images are representative of two independent experiments with similar results. Unprocessed blots in Source Data Extended Data Fig. 3. j, qPCR to control for efficient knockdown of NE2L2 in D2.0R cells (n=5 (shCO) n=6 (shNrf2a and shNrf2b) samples pooled across two independent experiments for each bars; unpaired two-tailed Student’s t-tests). Data are mean and single points. mRNA expression data are relative to GAPDH levels; mean level in the control was set to 1, and other samples are relative to this. See Source Data Extended Data Fig. 3.
Extended Data Fig. 4
Extended Data Fig. 4. Activation of NRF2 gene signatures in response to a soft ECM in published datasets.
a, Gene-Set Enrichment Analysis (GSEA) was performed on genes upregulated by culturing MCF10A cells on stiff 2D Matrigel-coated plates (red) or soft 3D Matrigel gels (blue). NRF2 signatures: KEAP/SFN (normalized enrichment score NES=-1.53 P<0.0001 false discovery rate FDR=0.038), LIST (NES=-1.91 P<0.0001 FDR<0.0001), PANIERI (NES=-1.75 P<0.0001 FDR=0.0006), HER2 (NES=-1.80 P<0.001 FDR=0.0005). YAP/TAZ (NES=2.01 P<0.0001 FDR<0.0001) and SREBP (NES=-1.47 P<0.017 FDR 0.06) serve as positive controls for gene signatures regulated by ECM stiffness. b, GSEA was performed on genes upregulated by culturing D2.0R cells on stiff Matrigel+Collagen-I gels (red) or soft Matrigel gels (blue). NRF2 signatures: KEAP/SFN (NES=-2.11 P<0.0001 FDR<0.0001), LIST (NES=- 2.11 P<0.0001 FDR<0.0001), HER2 (NES=-1.86 P<0.001 FDR=0.0008). YAP/TAZ (NES=1.64 P=0.004 FDR=0.009) and SREBP (NES=-1.77 P<0.0001 FDR=0.0026) serve as positive controls for gene signatures regulated by ECM stiffness. c, GSEA was performed on genes upregulated by culturing human MDA-MB-453 breast cancer cells on stiff (red) Fibronectin-coated plates or soft (blue) acrylamide hydrogels. NRF2 signatures: KEAP/SFN (NES=-3.25 P<0.001 FDR<0.001), LIST (NES=-3.60 P<0.001 FDR<0.001), HER2 (NES=-4.50 P<0.001 FDR<0.001). The YAP/TAZ signature (NES=1.71 P=0.025 FDR=0.048 Zhao NES=2.43 P<0.001 FDR<0.001) serves as positive control for genes regulated by ECM stiffness. d, Heatmap of NRF2 target genes in RNAseq data of mouse MMTV-PyMT breast cancer cells cultured ex vivo on Fibronectin-coated plates, stiff or soft acrylamide hydrogels. Each column is an independent biological sample (n=4 for each condition); each line is a single gene. Expression levels for each gene were normalized relative to the mean expression on plates, which was set to 1 (white). Black and blue indicate downregulation and upregulation (P<0.05), respectively. YAP/TAZ target genes serve as positive controls. e, GSEA was performed on genes regulated in matched cases of pre-treatment fine-needle aspiration (PRE, red) and the respective post neoadjuvant treatment operative sample (POST, blue) of primary breast cancer patients. Neoadjuvant treatment is known to reduce tumor stiffness. NRF2 signatures: KEAP/SFN (NES=-1.32 P=0.012 FDR=0.096), LIST (NES=-1.34 P=0.11 FDR=0.088), PANIERI (NES=-1.34 P=0.093 FDR=0.087). SREBP (NES=-1.94 P<0.001 FDR<0.001) and YAP/TAZ (NES=2.56 P<0.001 FDR<0.001) serve as positive controls for gene signatures regulated by ECM stiffness. f, Heatmap of NRF2 and YAP target levels in n=7 patient-matched stiff keloid tissue or soft normal skin. Each column represents -log2(keloid/skin) values for a single patient; each line is a single gene probe; genes ranked according to expression in patient #1. Black and blue indicate downregulation and upregulation (P<0.05), respectively. YAP target genes serve as positive controls. g, h, qPCR for established HSF1 target genes in MCF10A cells cultured on Fibronectin-coated stiff or soft hydrogels (g), or transfected on plastics with control (siCO) or with YAP/TAZ siRNAs (h). Data are mean and single points. mRNA expression data are relative to GAPDH levels; mean level in the control was set to 1, and other samples are relative to this (n=2 biologically independent samples from one experiment). See Source Data Extended Data Fig. 4.
Extended Data Fig. 5
Extended Data Fig. 5. ECM stiffness regulates resistance to oxidative stress.
a, Representative gating scheme for quantification of cyto-Grx1-roGFP2 by flow cytometry. Cells without cyto- Grx1-roGFP2 expression were used as negative control (outlined white area). Cells treated with cumene hydroperoxide (CUM, purple) for 10 min. to induce glutathione oxidation were used as positive control (n=4 biologically independent samples pooled across two independent experiments for each bar; unpaired twotailed Student’s t-test). b, Cell survival by the resazurin assay in MCF10A cells with the indicated knockdowns, plated on stiff or soft Matrigel substrata, and treated for 48 h with Cumene hydroperoxide (CUM). Mean cell number in controls was set to 100%, and all other samples are relative to this (n=12 biologically independent samples pooled across two independent experiments for each bar; Dunnet’s tests). c, Cell survival of MCF10A-RAS cells transfected with the indicated KEAP1 siRNAs and treated for 48 h with Cumene hydroperoxide (CUM). Mean cell number in Stiff controls was set to 100%, and all other samples are relative to this (n=12 biologically independent samples pooled across two independent experiments for each bar; Dunnet’s test). d, qPCR to control for efficient knockdown of KEAP1 in MCF10A-RAS. mRNA expression data are relative to GAPDH levels; mean level in the control was set to 1, and other samples are relative to this (n=4 biologically independent samples from two independent experiments; Dunnet’s test) e, Immunoblotting for endogenous KEAP1 from extracts of MCF10A-RAS cells transfected with the indicated siRNAs. Equal total proteins were loaded in each lane, and GAPDH was used as loading control. Images are representative of two independent experiments with similar results. Unprocessed blots in Source Data Extended Data Fig. 5. f, Cell survival of MCF10A-RAS cells transfected with the indicated NRF1 siRNA, plated on stiff or soft Matrigel substrata, and treated for 48 h with Cumene hydroperoxide (CUM). Mean cell number in Stiff controls was set to 100%, and all other samples are relative to this (n=12 biologically independent samples pooled across two independent experiments for each bar; unpaired two-tailed Student’s t-tests). g, qPCR for NFE2L1 (encoding for NRF1) and NFE2L2 (encoding for NRF2) expression levels in MCF10A-RAS transfected with NRF1 siRNAs. mRNA expression data are relative to GAPDH levels; mean level in the control was set to 1, and other samples are relative to this (n=6 biologically independent samples from two independent experiments; Dunnet’s test). h, i, Cell survival of MCF10A-RAS cells treated for 48 h with Erastin (ERA, g) or RSL3 (h) alone and together with the anti-ferroptosis compounds Liproxstatin-1 (LIP) or Ferrostatin (FER). Mean cell number in Stiff controls was set to 100%, and all other samples are relative to this (in h n=7 (VEHICLE DMSO, ERASTIN 10μM FER, ERASTIN 10μM LIP, ERASTIN 30μM DMSO) n=6 (ERASTIN 10μM DMSO) n=8 (all other conditions) biologically independent samples pooled from a single experiment; in i n=8 (VEHICLE) n=6 (RSL3 5 μ M LIP) n=7 (all other conditions) biologically independent samples pooled from a single experiment; Dunnet’s tests). j, qPCR for YAP/TAZ targets in MCF10A-RAS cells used as a control for differential stiffness of the Matrigel substrata within the extracellular flux analyzer plates (see Fig. 4f). mRNA expression data are relative to GAPDH levels; mean level in the control was set to 1, and other samples are relative to this (n=6 biologically independent samples from three independent experiments; unpaired two-tailed Student’s t-tests). k, qPCR for YAP/TAZ targets in D2.0R cells used as a control for differential stiffness of the Matrigel substrata within the extracellular flux analyzer plates (see Fig. 4g). mRNA expression data are relative to GAPDH levels; mean level in the control was set to 1, and other samples are relative to this (n=4 biologically independent samples from two independent experiments; unpaired two-tailed Student’s t-tests). Data are mean and single points. See Source Data Extended Data Fig. 5.
Extended Data Fig. 6
Extended Data Fig. 6. ECM stiffness regulates mitochondrial fission through DRP1.
a, Quantification of mitochondria length in D2.0R cells transfected with mito-RFP and treated with YM (n=128 (DMSO) n=117(YM) mitochondria pooled across 10 cells per condition in two independent experiments for each bar; unpaired two-tailed Student’s t-tests). The same set of images was analyzed by automated classification of mitochondrial length (centre) and by MFC analysis (right). Data are mean and single mitochondria (left), mean and s.d. (centre) and mean and single pictures (right). b, Quantification of mitochondria content by MitoTracker staining in MCF10A-RAS and D2.oR cells treated with YM. Median level in the control was set to 1, and other samples are relative to this (n=7 biologically independent samples pooled across three independent experiments for MCF10A-RAS; n=4 biologically independent samples pooled across two independent experiments for D2.0R). c, Quantification of mitochondrial DNA content in MCF10A-RAS cells treated with YM, based on qPCR for three different mtDNA loci. mtDNA levels are relative to genomic DNA (gDNA) levels; mean level in the control was set to 1, and other samples are relative to this (n=6 biologically independent samples from two independent experiments). d, qPCR for DRP1 in MCF10A cells treated with YM. mRNA expression data are relative to GAPDH levels; mean level in the control was set to 1, and other samples are relative to this (n=6 biologically independent samples from three independent experiments). e, Immunoblotting for endogenous total and phosphorylated DRP1 (p616, p637) from extracts of MCF10A-RAS cells treated with ROCK/MLCK inhibitors. Equal total proteins were loaded in each lane, and GAPDH was used as loading control. f, g. qPCR to control for efficient knockdown of DRP1 in MCF10A-RAS (f) or in D2.0R (g). mRNA expression data are relative to GAPDH levels; mean level in the control was set to 1, and other samples are relative to this (n=4 biologically independent samples from two independent experiments for each bar; unpaired two-tailed Student’s t-test in MCF10A-RAS, Dunnet’s test in D2.0R). h. Immunoblotting for endogenous DRP1 from extracts of MCF10A-RAS cells transfected with the indicated siRNAs. Equal total proteins were loaded in each lane, and GAPDH was used as loading control. i. Quantification of mtROS in MCF10A-RAS cells with knockdown of the indicated fission factors, and treated with YM. Median intensity in the control were set to 1, and other samples are relative to these (n=8 biologically independent samples pooled across four independent experiments for siCO bars; n=4 biologically independent samples pooled across two independent experiments for other bars; unpaired two-tailed Student’s t-tests). j-m. qPCR in MCF10A-RAS to control for efficient knockdown of the FIS1, MFF, MIEF1 and MIEF2 fission factors. mRNA expression data are relative to GAPDH levels; mean level in the control was set to 1, and other samples are relative to this (n=4 biologically independent samples from two independent experiments for each bar; Dunnet’s tests). n. Oxygen Consumption Rate (OCR) analysis performed on monolayers of MCF10A-RAS cells transfected with control (siCO) or DRP1 siRNA and plated on stiff or soft Matrigel substrata (n=20 biologically independent samples pooled across two independent experiments). o. OCR analysis on cells were treated with Drpitor1a (n=20 biologically independent samples pooled across two independent experiments). p. OCR analysis performed on monolayers of D2.0R cells stably expressing control (shCo.) or DRP1a shRNA and cultured on stiff or soft Matrigel substrata (n=20 biologically independent samples pooled across two independent experiments). q. OCR analysis on cells were treated with Drpitor1a (n=20 biologically independent samples pooled across two independent experiments). Images in e,h are representative of two independent experiments with similar results. Unprocessed blots in Source Data Extended Data Fig. 6. Data are mean and single points, except n-q (mean and s.d. - shaded areas). See Source Data Extended Data Fig. 6.
Extended Data Fig. 7
Extended Data Fig. 7. A soft ECM increases resistance to Cisplatin and As2O3 chemotherapy through NRF2 and DRP1 in MCF10A-RAS cells.
a,b, Cell survival of MCF10A-RAS cells treated for 48 h with the indicated concentrations of Cisplatin (a) or As2O3 (b), in the absence or presence of the antioxidant N-Acetyl-L-cysteine (NAC, 5mM) (in a n=14 (VEHICLE) n=13 (VEHICLE NAC) n=15 (CISPLATIN 5μM) n=16 (CISPLATIN 20 μM) biologically independent samples pooled across two independent experiments; in b n=22 (VEHICLE and As2O3 20 μM) n=19 (VEHICLE NAC) n=21 (As2O3 5μM) biologically independent samples pooled across two independent experiments; Dunnet’s tests). c,d, Cell survival assay in MCF10A-RAS cells cultured on stiff Matrigel-coated plates or soft Matrigel gels, and treated for 48 h with the indicated concentrations of Cisplatin (c) or As2O3 (d) (n=16 biologically independent samples pooled across two independent experiments for each bar; Dunnet’s test). e, Cell survival assay in MCF10A-RAS cells treated for 48 h with the indicated concentrations of Doxorubicin (DOXO), in the absence or presence of N-Acetyl-L-cysteine (NAC, 5mM) (n=16 biologically independent samples pooled across two independent experiments for each bar). f, Cell survival assay in MCF10A-RAS cells cultured on stiff Matrigel-coated plates (black) or soft Matrigel gels (green), and treated for 48 h with the indicated concentrations of Doxorubicin (DOXO) (n=14 biologically independent samples pooled across two independent experiments for each bar). g, Cell survival of MCF10A-RAS cells transiently transfected as indicated and cultured on stiff Matrigel-coated plates or soft Matrigel gels, and treated for 48 h with the indicated concentration of Cisplatin. (n=8 (siCO and siNRF2b CISPLATIN SOFT) n=6 (all other conditions) biologically independent samples pooled across two independent experiments; Dunnet’s test). h, Cell survival of MCF10A-RAS cells transiently transfected as indicated, cultured on stiff Matrigel-coated plates or soft Matrigel gels, and treated for 48 h with the indicated concentration of Cisplatin. Where indicated cells were also treated with the DRP1 inhibitor Drpitor1a. (n=14 (siCO) n=12 (siDRP1) n=16 (Drpitor1a) biologically independent samples pooled across two independent experiments; Dunnet’s test). Data are mean and single points. Mean expression in untreated controls were set to 100%, and all other samples are relative to this. See Source Data Extended Data Fig. 7.
Extended Data Fig. 8
Extended Data Fig. 8. Controls to experiments shown in main Fig. 8.
a, A simplified model of the mechanical conditions used throughout Fig. 8. Cells are seeded in a soft microenvironment (wavy lines: in vitro BM ECM, ex vivo decellularized lung ECM, in vivo lung tissue) or directly in stiff conditions (straight bold lines: lung ECM slices treated with Ribose or derived from fibrotic mice). Cancer cells remodel the ECM, such that they stiffen their microenvironment at late time-points (LATE: 14 days in vitro, 1.5 months in vivo). b, Quantification of tissue stiffness by atomic force microscopy on mouse mammary glands and normal lungs, using frozen tissue microtome sections. Data are mean and single points (n=4 and n=3 tissue sections from two mice). c, YAP/TAZ immunofluorescence in D2.0R cells cultured on normal and Ribose-stiffened (RIB) lung ECM slices. Images are representative of two independent experiments with similar results. Scale bars, 25 μm. d, Collagen-I and YAP/TAZ immunofluorescence in D2.0R cells cultured on normal and fibrosis-stiffened (FIB) lung ECM slices. Images are representative of two independent experiments with similar results. Scale bars, 25 μm. e, qPCR to control for efficient regulation of YAP/TAZ in D2.0R cells infiltrated into normal or fibrotic (FIB) lung ECM scaffolds. Data are mean and single points; mRNA expression data are relative to GAPDH levels; mean level in the control was set to 1, and other samples are relative to this (n=7 biologically independent samples from two independent experiments for bars 1 and 2; n=2 biologically independent samples from one single experiment for bars 3). See Source Data Extended Data Fig. 8.
Extended Data Fig. 9
Extended Data Fig. 9. Controls to in vivo experiments shown in main Fig. 8.
a, Experimental set-up to study D2.0R metastatic cell behavior in mice. D2.0R cells expressing GFP and Firefly-luciferase (GFP/Fluc) were injected via the tail vein to induce metastatic dissemination into the lungs and their initial cell number was quantified by intravital bioluminescence imaging (BLI). After letting cells settle for one week, mice were injected i.p. with Cisplatin or with the equivalent volume of vehicle (1xPBS) for four consecutive rounds. Cell growth was monitored after every injection and then every 11 days. b, GFP/Fluc D2.0R cells expressing the indicated shRNAs were injected via the tail vein mixed at a 1:1 ratio together with RFP D2.0R cells to induce metastatic spread into the lungs. After three days, the ratio of red/green cells in the lung parenchyma was quantified to measure extravasation efficiency. Scale bars, 20 μm. Images are representative of three mice with similar results. Data are mean and single points (n=3 mice for each condition). c, Intravital imaging of mice with lung metastases from GFP/Fluc D2.0R cells quantified in Fig. 8l, taken at day 90. The rainbow LUT was used to visualize the radiance. Images are representative of six mice with similar results per condition. d, Quantification of activated Caspase-3 in D2.0R cells disseminated to the mouse lung after treatment with two doses of Cisplatin (see scheme above) (n=2 mice). On the right, an immunofluorescent picture with spectral unmixing showing GFP-positive D2.0R cells (cyan) disseminated into the lung parenchyma and one example of a double-positive Caspase-3/GFP cell (yellow). Tissue sections were also stained with CD31 (magenta) to visualize blood vessels. Scale bar, 20 μm. e, Intravital imaging of mice with lung metastases from GFP/Fluc D2.0R cells quantified in Fig. 8m, taken at day 75. The rainbow LUT was used to visualize the radiance. Images are representative of six mice with similar results per condition. Data are mean and single points. See Source Data Extended Data Fig. 9.
Extended Data Fig. 10
Extended Data Fig. 10. Proposed model.
A simplified model that recapitulates the main findings of the manuscript, ordered in time after shifting cells to a soft microenvironment. On a soft ECM, cells develop reduced actomyosin tension, which is associated with increased formation of peri-mitochondrial F-actin, increased DRP1-dependent mitochondrial fission and enhanced mtROS production. mtROS activate a NRF2-dependent antioxidant metabolic response which includes increased cysteine uptake and glutathione synthesis. Functionally, this response has two main outcomes: it keeps redox balance in the face of increased ROS and glutathione oxidation (upward facing arrow), and it results in a better ability of cells to resist exogenous oxidative stress and ROS-dependent chemotherapy (downward facing arrow), compared to cells in a stiff microenvironment. mt is an abbreviation for mitochondria.
Fig. 1
Fig. 1. ECM stiffness regulates cystine metabolism and glutathione oxidation.
a-c Levels of intracellular metabolites in MCF10A-RAS cells treated with vehicle (DMSO, n=4 biologically independent samples) or with the Y27632 ROCK inhibitor and ML7 MLCK inhibitor (hereafter YM, n=6 biologically independent samples) as measured by mass spectrometry. Data from one single metabolomics experiment. Welch's two-sample t-tests. d-f, Uptake of FITC-labeled Cystine by flow cytometry in MCF10A-RAS (d), MCF10A (e) and mouse D2.0R cells (f) treated with YM, with the Blebbistatin (BLEBBI) NMII myosin inhibitor for 6 h, or cultured on stiff (E≈15kPa) or soft (E≈0.5kPa) Fibronectin-coated acrylamide hydrogels. Normalized to mean intensity in control (in d n=11 biologically independent samples pooled across three independent experiments for DMSO; n=6 (YM) n=9 (BLEBBI) n= 4 (STIFF) n=6 (SOFT) biologically independent samples pooled across two independent experiments. In e n=5 biologically independent samples pooled across two independent experiments for DMSO, YM and BLEBBI; n=2 (STIFF) and n=4 (SOFT) biologically independent samples pooled across two independent experiments; Dunnet’s tests). g-h, Levels of reduced (GSH, g) and oxidized (GSSG, h) glutathione in MCF10A-RAS cells treated and analyzed as in a. i, Glutathione redox analysis with the cytoplasmic Grx1-roGFP2 genetically-encoded sensor in MCF10A-RAS treated with YM (n=32 (DMSO) n=20 (YM3h) n=29 (YM6h) n=24 (YM24h) cells pooled across two independent experiments; Dunnet’s test). j, Glutathione redox analysis in MCF10A-RAS cells cultured on stiff Matrigel-coated plates (E≈GPa) or soft Matrigel thick gels (E≈2o0Pa) (n=31 (STIFF) n=32 (SOFT) cells pooled across two independent experiments; unpaired two-tailed Student’s t-test). Data are mean and single points. See Source Data Table 1.
Fig. 2
Fig. 2. ECM stiffness regulates reactive-oxygen species (ROS) levels.
a,b, Quantification of ROS by flow cytometry in MCF10A-RAS (a) and D2.0R cells (b), treated with YM, with the Blebbistatin (BLEBBI) NMII myosin inhibitor for 6 h, or cultured on stiff (E≈15kPa) or soft (E≈0.5kPa) Fibronectin-coated acrylamide hydrogels. Cells kept in suspension (DETACH) were included for comparison. Normalized to mean intensity in control (in a n=10 (DMSO) n=6 (YM and DETACH) n=4 (BLEBBI) n=6 (STIFF and SOFT) biologically independent samples pooled across two independent experiments; in b n=6 (DMSO) n=8 (YM) n=4 (STIFF and SOFT) biologically independent samples pooled across two independent experiments; Dunnet’s tests). c, Immunofluorescence of cytoplasmic 8-hydroxy-guanosine (8-OHG) in MCF10A-RAS cells treated and cultured as above. YM+RNase treatment is a control for cytoplasmic nucleic acid adducts. Normalized to mean intensity in control (n=45 (DMSO) n=52 (YM) n= 39 (STIFF) n=33 (SOFT) cells pooled across two independent experiments; unpaired two-tailed Student’s t-tests). d, Immunofluorescence of nuclear 8-hydroxy-deoxy-guanosine (8-OHdG) in MCF10A-RAS treated with YM, cultured on stiff or soft hydrogels, or treated with genotoxic doses of Cisplatin (CIS) and As2O3 (n=4840 (DMSO) n=5195 (YM) n= 4333 (CIS) n=4249 (As2O3) n=2133 (STIFF) n=2344 (SOFT) cells pooled across two independent experiments per condition; Dunnet’s test). e, Immunofluorescence of γH2AX in MCF10A-RAS cells treated as in d. Doxorubicin (DOXO) is a control for DNA damage (n=5873 (DMSO) n=2912 (YM) n= 4015 (CIS) n=3702 (As2O3) n=5378 (DOXO) n=3145 (STIFF) n=2198 (SOFT) cells pooled across two independent experiments per condition; Dunnet’s test). f, Quantification of ROS in MCF10A-RAS treated with cycloheximide (CHX) to inhibit de novo protein synthesis. Normalized to mean intensity in control (n=6 (DMSO and SOFT) n=4 (STIFF+CHX and SOFT+CHX) biologically independent samples pooled across two independent experiments; Dunnet’s test). Images in c,d,e, are representative of at least two independent experiments with similar results. Scale bars, 25 μm, except for c (5 μm). Data are mean and single points. See Source Data Table 2.
Fig. 3
Fig. 3. NRF2 activation on soft ECM potentiates cell resistance to exogenous oxidative stress.
a, qPCR for SLC7A11 in MCF10A-RAS cells cultured on stiff Matrigel-coated plates or soft Matrigel thick gels (green), on stiff (E≈10kPa) or soft (E≈0.5kPa - blue) Fibronectin-coated hydrogels, or treated with YM for 6 h (n=4 (STIFF and SOFT); n=6 (DMSO and YM)). b, qPCR for SLC7A11 in MCF10A-RAS cells cultured on a soft hydrogel and treated with N-acetyl-L-cysteine (NAC) (n=4). c Uptake of FITC-Cystine in MCF10A-RAS cells cultured on a soft hydrogel and treated with NAC. Normalized to mean intensity in control (n=4). d, qPCR for established NRF2 target genes in MCF10A-RAS cells cultured on stiff (E≈50kPa) or soft (E≈0.5kPa) Fibronectin-coated acrylamide hydrogels (n=4). e, Quantification of active nuclear S40-phosphorylated NRF2 in MCF10A-RAS and D2.0R cells cultured on stiff or soft Matrigel. Normalized to mean intensity in control (MCF10A-RAS n=32 (STIFF) n= 50 (SOFT) D2.0R n=27 (STIFF) n= 41 (SOFT)). f, Proximity ligation assays (PLA) between endogenous NRF2 and KEAP1 in MCF10A-RAS cells treated with YM. αNRF2, αKEAP1: a single ab was used. White dotted lines indicate the cell contours. Scale bars = 5 μm. Images are representative of at least two independent experiments with similar results. Knockdown of KEAP1 and NRF2 (siKEAP1, siNRF2) as specificity control (MCF10A-RAS n=28 (DMSO and YM) n= 17 (siKEAP and siNRF2) and D2.0R n=16 (DMSO and YM)). g, qPCR for NRF2 targets in MCF10A-RAS cells transfected with control siRNA (siCO) or two independent NRF2 siRNAs (indicated by a and b), and treated with YM (n=8 and n=6 for SLC7A11 and FTH1, respectively; n=4 for NQO1). h, Uptake of FITC-labeled Cystine in MCF10A-RAS cells transfected with siRNAs and plated on stiff or soft Fibronectin-coated hydrogels. Normalized to mean intensity in control (n=4). i, Quantification of ROS in MCF10A-RAS as in j. Normalized to mean intensity in control (n=4). j, Glutathione redox analysis by flow cytometry in MCF10A-RAS cells transfected and treated as in j (n=4). k,l Cell survival by the resazurin assay in MCF10A-RAS (k) and D2.0R (l) cells with the indicated knockdowns, plated on stiff or soft Matrigel, treated for 48 h with Cumene hydroperoxide (CUM). Mean cell number in controls was set to 100%, (solid black) and all other samples are relative to this (n=12). m,n, Cell survival in MCF10A-RAS cells cultured on stiff or soft Matrigel and treated for 48 h with Erastin (ERA) or RSL3. Normalized to mean cell number in control (n=12). In a,b,d,g mRNA expression is relative to GAPDH levels normalized to control. ‘n’ refers to the number of biologically independent samples (a-d, g-n) or cells (e, f) analyzed across two independent experiments, except for SLC7A11 and FTH1 in g, where the samples were pooled from three independent experiments. Dunnet’s tests in b-d and f-n, and unpaired two-tailed Student’s t-tests in a and e. Data are mean and single points. See Source Data Table 3.
Fig. 4
Fig. 4. Mitochondrial ROS (mtROS) initiate the antioxidant response induced by ECM stiffness.
a,b, Quantification of ROS by flow cytometry in MCF10A-RAS cells treated with YM for 3 h (a), or cultured on stiff (E≈10kPa) or soft (E≈0.5kPa) Fibronectin-coated acrylamide hydrogels for 6 h (b), in combination with inhibitors of ROS production. Normalized to mean intensity in control (n=10 (VEHICLE) n=8 (wortmannin) n=6 (TUDCA) all other conditions n=4 for each bar). c, Quantification of mtROS in MCF10A-RAS cells cultured on stiff or soft Fibronectin-coated hydrogels for 6 h. Where indicated, cells were treated with TUDCA or the mitochondrial antioxidant MitoTEMPO (MITO). Normalized to mean intensity in control (n=8 (VEHICLE and MITO); n=4 (TUDCA)). d, qPCR for NRF2 targets in MCF10A-RAS cells cultured as in c 24 h. mRNA expression data are relative to GAPDH levels normalized to control (HMOX1 n=6 (STIFF and SOFT+MITOTEMPO) n=8 (SOFT); NQO1 n=6 (STIFF and SOFT+MITOTEMPO) n=7 (SOFT); GCLC n=4 (STIFF) n=5 (SOFT) n=6 (SOFT+MITOTEMPO)). e, Uptake of FITC-labeled Cystine in MCF10A-RAS cells cultured as in d. Normalized to mean intensity in control (n=4 for each bar). f,g, Oxygen Consumption Rate (OCR) analysis performed with an extracellular flux analyzer on monolayers of MCF10A-RAS (f) D2.0R cells (g) cultured on stiff or soft Matrigel substrata. Oligomycin (OLIGO 0.8 μM), FCCP (900 nM), Rotenone (ROT 1 μM) plus Antimycin A (ANTI A 1 μM) were used to determine basal respiration, ATP-coupled respiration, maximal respiratory capacity and non-mitochondrial oxygen consumption. (MCF10A-RAS n=20 (STIFF and SOFT) D2.0R n=20 (STIFF and SOFT)). In a-g, ‘n’ refers to the number of biologically independent samples analyzed across two independent experiments, except for VEHICLE and MITO in c (four independent experiments), HMOX1 and NQO1 in d (three independent experiments). Dunnet’s tests in d,e and f-n, and unpaired two-tailed Student’s t-tests in a-c and e-g. Data are mean and single points except from f,g (mean and s.d. - shaded areas). See Source Data Table 4.
Fig. 5
Fig. 5. ECM stiffness regulates mitochondrial fission through DRP1.
a, Mitochondrial network morphology in MCF10A-RAS cells treated with YM, cultured on stiff or soft Matrigel, or on stiff (E≈10kPa) or soft (E≈0.5kPa) Fibronectin-coated acrylamide hydrogels. FCCP induces the formation of toroidal mitochondria. Scale bars = 5 μm. (n=158 (DMSO) n=242 (YM) n=127 (STIFF) n=118 (SOFT) n=164 (STIFF and SOFT hydrogels)). b, Transmission electron microscope images of mitochondria in MCF10A-RAS cells on stiff or soft Fibronectin-coated hydrogels (n=40). Scale bars = 500 nm. c, Classification of mitochondrial network morphology and mitochondrial fragmentation count (MFC) analysis in MCF10A-RAS cells treated with YM (n=7). Scale bar = 25 μm. d, Endogenous Drpi puncta in MCF10A-RAS cells transfected with mito-RFP and plated on stiff or soft Matrigel substrata (n=35). Scale bar =5 μm. e, Quantification of endogenous puncta of S6i6-phosphorylated DRPi as in d (n=47). f, 3D reconstructions of ER-mitochondrial contacts visualized with the short range (8-10 nm) GFP complementation SPLICs sensor in MCF10A-RAS cells (n=20). Scale bars =10 μm. g, Mitochondrial length in MCF10A-RAS cells plated on soft Matrigel (n=118 (siCO) n=i48 (s1DRP1)). h, Mitochondrial network morphology analysis in MCF10A-RAS cells in response to YM treatment and DRP1 inhibition (n=7). i, Quantification of mtROS in MCF10A-RAS cells plated on stiff or soft Fibronectin-coated acrylamide hydrogels. Where indicated, cells were treated with the MDIVI1 or Drpitor1a DRP1 inhibitors. Normalized to mean intensity in control (n=10 (siCO); all other bars n=4). j, Quantification of mtROS in MCF10A-RAS cells with knockdown of the MIEF1 and MIEF2 (siMIEF1/2), and treated with YM. Normalized to mean intensity in control (n=4 each bar). k,l, qPCR for established NRF2 targets in MCF10A-RAS (k) or D2.oR cells (l) with knockdown of DRP1 and plated on stiff or soft Fibronectin-coated hydrogels. Expression relative to GAPDH normalized to control (MCF10A-RAS: n=6 each bar; D2.0R: n=4 each bar). m. Heatmap of NRF2- and DRP1-dependent genes activated on soft (E≈0.2kPa) compared to stiff (E≈50kPa) Collagen-I-coated acrylamide hydrogels based on RNAseq of D2.oR cells. Each column is an independent biological sample; each line is a single gene. Downregulation and upregulation relative to Z-score (P<0.05) (n=3 independent biological samples from a single experiment each condition). n. Uptake of FITC-Cystine in MCF10A-RAS cells as in i. Normalized to mean intensity in control (siCO n=8; all other bars n=4). o,p, Cell survival in MCF10A-RAS (o) D2.oR (p) plated on stiff or soft Matrigel, and treated for 48 h with Cumene hydroperoxide (CUM). Normalized to mean cell number in Stiff controls (in o n=6 (siCO CUMENE SOFT and siDRP1 VEHICLE STIFF) n=8 all other conditions; in p n=8 (shCO VEHICLE STIFF and shCO CUMENE STIFF) n=6 all other conditions). Images in a,b,c,d,h are representative of two independent experiments with similar results. ‘n’ refers to number of mitochondria (a,b,g) from 10 cells pooled from two independent experiments; number of cells (d,e,f) across two independent experiments each condition; number of pictures (c,h) pooled from two independent experiments each condition; number of biologically independent samples (i,j,n,o,p) across two independent experiments each bar, except siCO in i and n (four independent experiments), MCF10A RAS in k,l (three independent experiments). Unpaired two-tailed Student’s t-tests in a-e,g,h,j; Dunnet’s tests for f,i,k,l,n,o,p. Data are mean and single points, except for c,g (mean and s.d.). See Source Data Table 5.
Fig. 6
Fig. 6. ECM stiffness regulates fission via Spire1c- and Arp2/3-dependent peri-mitochondrial F-actin.
a, Left: colocalization of transfected WT but not R62D monomeric mutant Flag-Actin with phalloidin in MCF10A-RAS cells. Centre: PLA (proximity ligation assay) between Flag-Actin and TOMM20. No probes: absence of secondary antibodies (ab). αTOMM20, αFLAG: only one primary ab was used. Cells were treated with YM alone and in combination with LatrunculinA (LATA) or Arp2/3 inhibitor (CK666). Scale bars = 2 μm (n=20). b, PLA between endogenous filamentous actin and TOMM20 in MCF10A-RAS cells treated as in a. αTOMM20; Bio-Phalloidin + αBio: only one primary ab was used as specificity control. Scale bars = 5 μm (n=20). c, Co-localization of F-Actin/mitochondria PLA with DRP1-GFP puncta in MCF10A-RAS cells. Scale bar = 5 μm. d, Quantification of endogenous DRP1 puncta in MCF10A-RAS cells cultured on soft or stiff Matrigel and treated with LatrunculinA (LATA) or Arp2/3 inhibitor (CK666) (n=35). e, Quantification of DRP1-GFP puncta in D2.0R cells treated as in a. Scale bars = 10 μm. (n=35). f, Mitochondrial length in MCF10A-RAS cells expressing dominant-negative Spire1C isoforms (n=141). g, Quantification of mtROS in MCF10A-RAS cells expressing dominant-negative Spire1C isoforms and plated on stiff or soft hydrogels for 6 h. Normalized to median intensity in the control (n=4). h, Quantification of mitochondrial ROS in MCF10A-RAS cells depleted of total INF2 (siINF2) or of the mitochondrial splice isoform (siINF2-CAAX), and treated with YM. Normalized to mean intensity in control (n=4). i,j, qPCR in MCF10A-RAS for total (i) or of the mitochondrial splice isoform (j) of INF2. mRNA expression data are relative to GAPDH levels normalized to control (n=4). Images in a,b,c,e, are representative of at least two independent experiments with similar results. ‘n’ refers to number of cells (a,b,d,e) across two independent experiments each condition; number of mitochondria (f) from 10 cells across two independent experiments each condition; number of biologically independent samples (g-j) across two independent experiments each bar. Unpaired two-tailed Student’s t-tests in a and b; Dunnet’s tests in d-j Data are mean and single points. See Source Data Table 6.

Comment in

Similar articles

Cited by

References

    1. Min E, Schwartz MA. Translocating transcription factors in fluid shear stress-mediated vascular remodeling and disease. Exp Cell Res. 2019;376:92–97. - PMC - PubMed
    1. Petridou NI, Spiró Z, Heisenberg C-P. Multiscale force sensing in development. Nature Cell Biology. 2017;19:581–588. - PubMed
    1. Tschumperlin DJ, Ligresti G, Hilscher MB, Shah VH. Mechanosensing and fibrosis. J Clin Invest. 2018;128:74–84. - PMC - PubMed
    1. Vining KH, Mooney DJ. Mechanical forces direct stem cell behaviour in development and regeneration. Nature Reviews Molecular Cell Biology. 2017;18:728–742. - PMC - PubMed
    1. Humphrey JD, Dufresne ER, Schwartz MA. Mechanotransduction and extracellular matrix homeostasis. Nat Rev Mol Cell Biol. 2014;15:802–812. - PMC - PubMed

Publication types

MeSH terms