. 2022 Jun;32(6):530-542.
doi: 10.1038/s41422-022-00627-9. Epub 2022 Feb 14.

Defined tumor antigen-specific T cells potentiate personalized TCR-T cell therapy and prediction of immunotherapy response

Affiliations

Defined tumor antigen-specific T cells potentiate personalized TCR-T cell therapy and prediction of immunotherapy response

Jingjing He et al. Cell Res. 2022 Jun.

Abstract

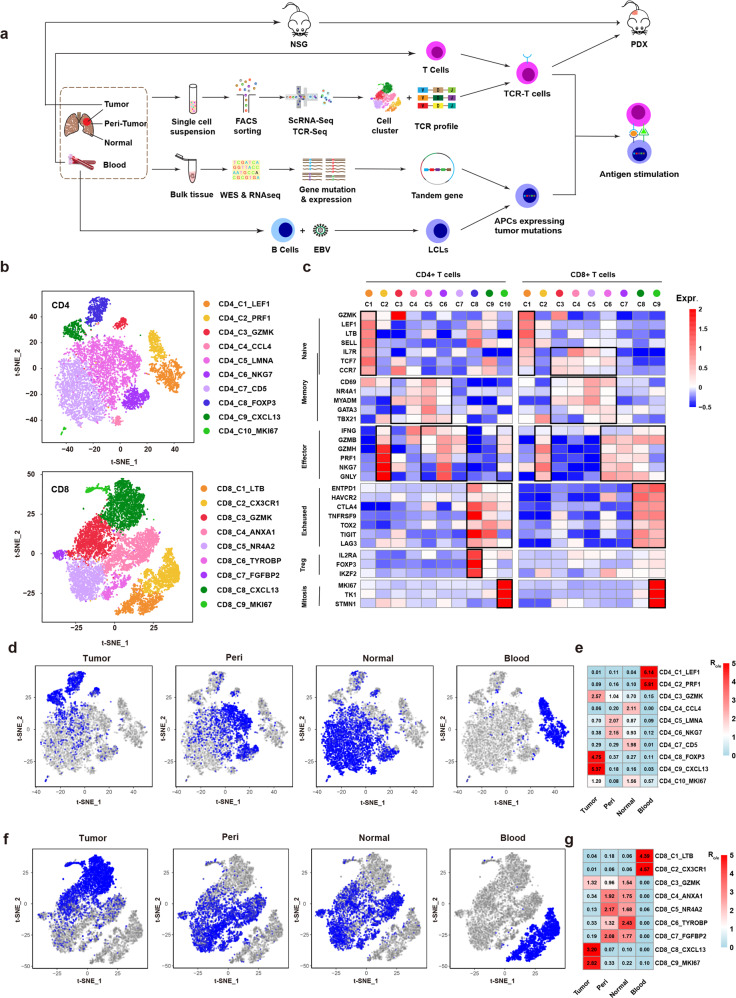
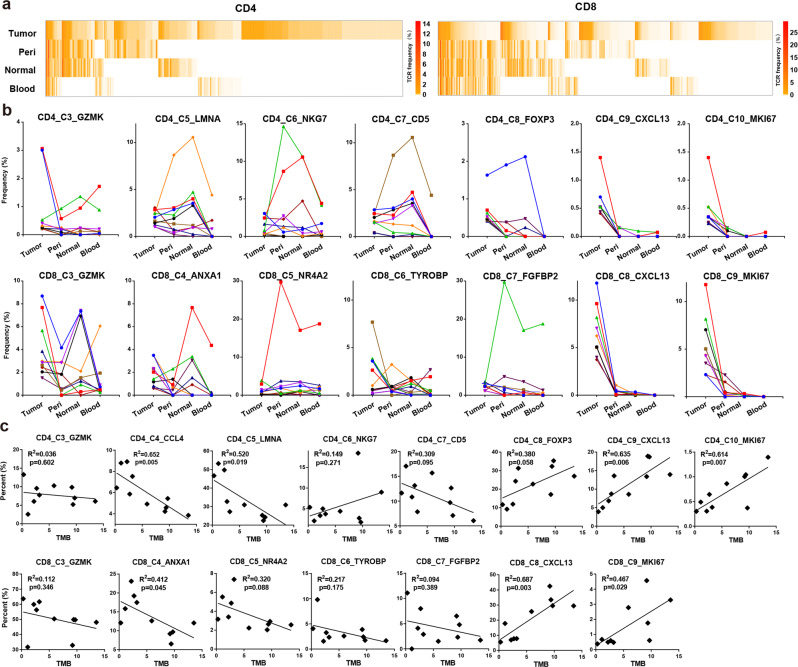
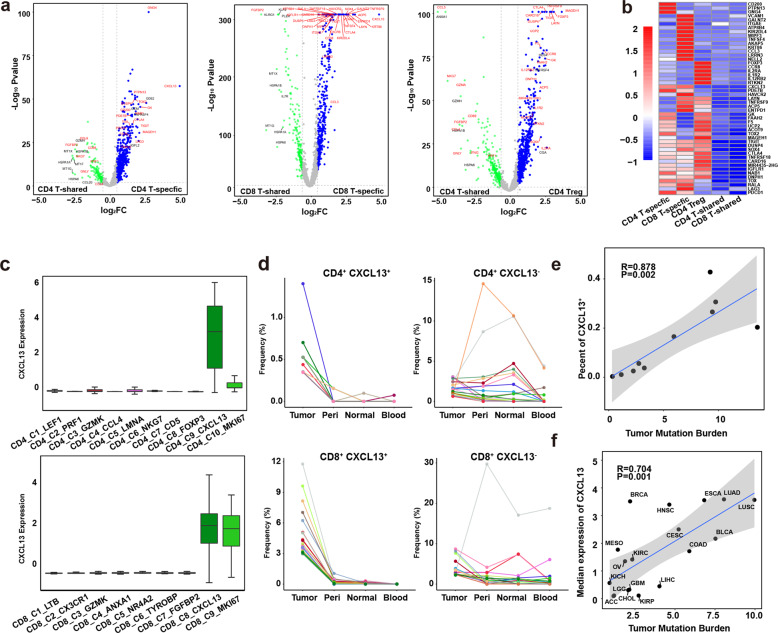
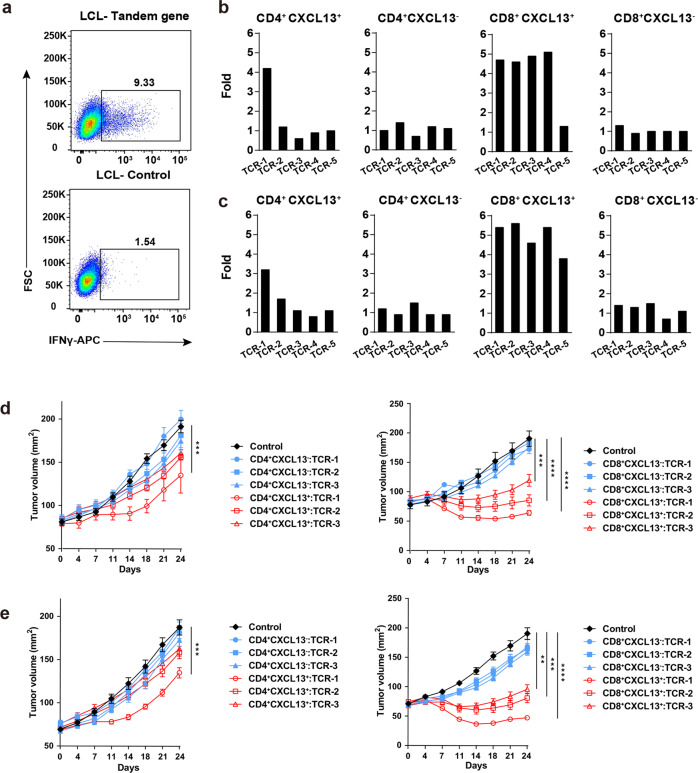
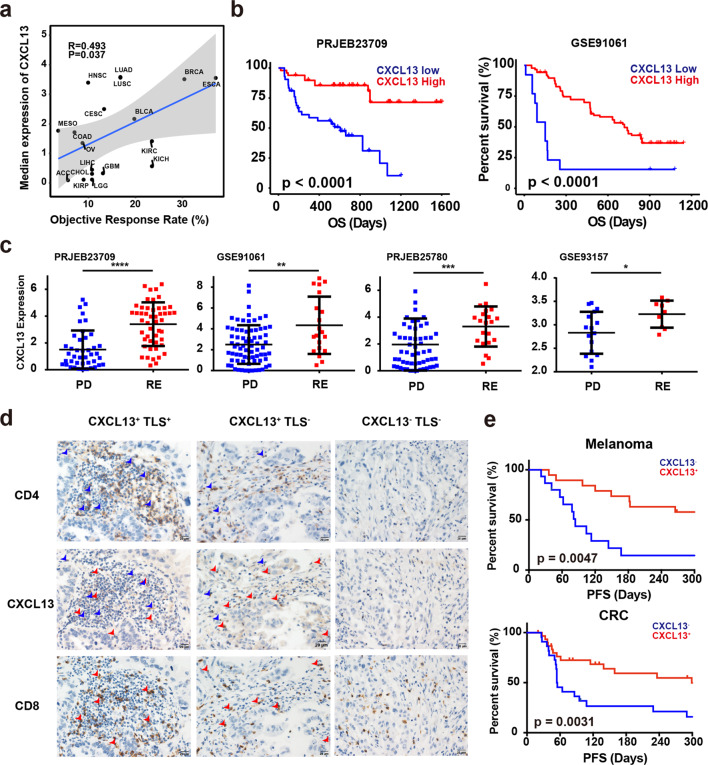
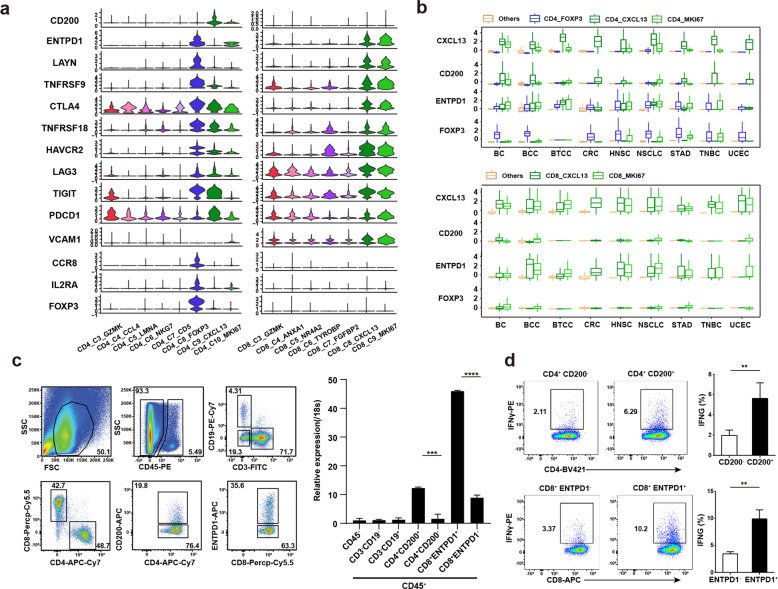
Personalized immunotherapy targeting tumor-specific antigens (TSAs) could generate efficient and safe antitumor immune response without damaging normal tissues. Although neoantigen vaccines have shown therapeutic effect in clinic trials, precise prediction of neoantigens from tumor mutations is still challenging. The host antitumor immune response selects and activates T cells recognizing tumor antigens. Hence, T cells engineered with T-cell receptors (TCRs) from these naturally occurring tumor antigen-specific T (Tas) cells in a patient will target personal TSAs in his/her tumor. To establish such a personalized TCR-T cell therapy, we comprehensively characterized T cells in tumor and its adjacent tissues by single-cell mRNA sequencing (scRNA-seq), TCR sequencing (TCR-seq) and in vitro neoantigen stimulation. Compared to bystander T cells circulating among tissues, Tas cells were characterized by tumor enrichment, tumor-specific clonal expansion and neoantigen specificity. We found that CXCL13 is a unique marker for both CD4+ and CD8+ Tas cells. Importantly, TCR-T cells expressing TCRs from Tas cells showed significant therapeutic effects on autologous patient-derived xenograft (PDX) tumors. Intratumoral Tas cell levels measured by CXCL13 expression precisely predicted the response to immune checkpoint blockade, indicating a critical role of Tas cells in the antitumor immunity. We further identified CD200 and ENTPD1 as surface markers for CD4+ and CD8+ Tas cells respectively, which enabled the isolation of Tas cells from tumor by Fluorescence Activating Cell Sorter (FACS) sorting. Overall, our results suggest that TCR-T cells engineered with Tas TCRs are a promising agent for personalized immunotherapy, and intratumoral Tas cell levels determine the response to immunotherapy.


Conflict of interest statement

C.B., X.L., H.L. are current employee of FineImmune. The other authors declare that they have no competing interests.

Figures

Fig. 1
Fig. 1. ScRNA-seq identified tumor-enriched T cell clusters.
a Scheme of overall study design. b t-SNE projection of the expanded CD4+ and CD8+ T cells. Cells are color-coded for clusters. c Mean expression of genes associated with T cell subtypes in each cluster. d Cells from tumor, peri-tumor, normal and blood tissues (left to right panels) are highlighted with blue color in the t-SNE plot of the expanded CD4+ T cells, respectively. e Tissue prevalence estimated by Ro/e score in expanded CD4+ T cells. f Cells from tumor, peri-tumor, normal and blood tissues (left to right panels) are highlighted with blue color in the t-SNE plot of the expanded CD8+ T cells, respectively. g Tissue prevalence estimated by Ro/e score in expanded CD8+ T cells.
Fig. 2
Fig. 2. Tumor-enriched T cells were expanded by tumor antigens.
a Heatmap showing the frequency of each TCR in the four tissues. The top 200 TCRs in expanded CD4+ and CD8+ T cells from tumor were presented. Columns represent different clonotypes, and rows represent different tissues. Color key represents the frequency of each TCR in every tissue. b Line chart showing the frequency of each TCR in the four tissues. The top 10 TCRs of expanded tumor CD4+ (top) and CD8+ (bottom) T cells in each cluster were presented. Each line represents a TCR. c Scatter plot showing the correlation between TMB and the percent of tumor CD4+ (top) of CD8+ (bottom) T cell from each cluster in the total tumor CD4+ or CD8+ T cells in 10 patients, respectively.
Fig. 3
Fig. 3. Identification of specific markers for Tas cells.
a Volcano plots showing differentially expressed genes between CD4+ T-shared and T-specific cells, CD8+ T-shared and T-specific cells, and CD4+ T-shared cells and CD4+ Treg cells. Blue dots represent significantly upregulated genes in CD4+ T-specific, CD8+ T-specific and CD4+ Treg cells respectively (|log2(FC)| > 0.58, P < 0.05). b Heatmap showing the expression of selected genes in CD4+ T-specific, CD8+ T-specific and CD4+ Treg cells, CD4+ T-shared and CD8+ T-shared cells (right panel); c Box plot showing the expression of CXCL13 in CD4+ (top panel) and CD8+ T cell clusters (bottom panel). d Line chart showing the frequency of each TCR in the four tissues. The top 20 TCRs of CD4+CXCL13+, CD4+CXCL13, CD8+CXCL13+, and CD8+CXCL13 T cells were presented. Each line represents a TCR. e The correlation between the percents of CXCL13+ T cells in tumor T cells and the TMB of each tumor. f The correlation between the median expression of CXCL13 and TMB of each cancer type.
Fig. 4
Fig. 4. T cells from tumor-enriched clusters recognize neoantigens.
a FACS plots showing the IFNγ expression in TCR-T cells stimulated with LCLs expressing tandem minigenes of tumor mutations and control. b, c Bar plots showing the fold change of IFNγ expression in each TCR-T cell line stimulated with LCLs expressing tandem minigenes compared to the stimulation with control LCLs (right panel); The top five tumor TCRs in each group of P4 (b) and P5 (c) were presented. d, e Growth of P4 (d) and P5 (e) PDX tumors treated with TCR-T cells expressing top three TCRs indicated in groups in (b, c); Non-tranduced T cells were used as control. Representative of two independent experiments (n = 5 mice/group, each value represents means ± SEM, **P < 0.01 by two-sided t-test).
Fig. 5
Fig. 5. Expression of CXCL13 predicts response to ICB.
a The correlation between the median expression of CXCL13 and objective response rate of each cancer type. b Kaplan–Meier overall survival curves comparing high and low CXCL13 expression in patients from dataset PRJEB23709 (left) and GSE91061 (right). c Box plots showing the CXCL13 expression in clinical non-responders (progressive disease) versus responders (stable disease, partial response and complete response) in PRJEB23709, GSE93517, GSE91061 and PRJEB25780 datasets. (*P < 0.05; **P < 0.01; ***P < 0.001; ****P < 0.0001 by two-sided Mann–Whitney U test). d Representative IHC images of CXCL13+TLS+, CXCL13+TLS, and CXCL13TLS tumor sections stained with CXCL13, CD8, and CD4. Scale bars, 20 μm. Red arrows show cells co-expressing CD8 and CXCL13. Blue arrows show cells co-expressing CD4 and CXCL13. e Kaplan–Meier curves of PFS comparing CXCL13+ to CXCL13 in melanoma (up) and CRC (bottom) patients. P value was calculated by the log-rank test.
Fig. 6
Fig. 6. Identification of surface markers for Tas cells.
a Violin plot showing the expression of selected genes in tumor T cells of each cluster. b Box plot showing the expression of selected marker genes of CD4+ and CD8+ Tas cells, and CD4+ Tregs in clusters identified in CD4+ (top panel) and CD8+ T cells (bottom panel) from nine different cancer types. c FACS plot showing the gating strategy of CD4+ and CD8+ Tas cells sorting from tumor (left panel); Representative bar plot of five independent experiments showing the expression of CXCL13 in different groups of immune cells and tumor cells by qPCR (right panel). d CD4+ and CD8+ Tas cells sorted from tumors were activated with anti-CD3/CD28 antibodies for 2 days followed by culture in IL-2 for 7 days, and then stimulated with autologous tumor cells for 24 h. FACS plot showing the expression of IFNγ detected by intracellular staining (left panel); Representative bar plot of five independent experiments showing the percentages of IFNγ+ cells (right panel).

Comment in

Similar articles

Cited by

References

    1. Rapoport AP, et al. NY-ESO-1-specific TCR-engineered T cells mediate sustained antigen-specific antitumor effects in myeloma. Nat. Med. 2015;21:914–921. doi: 10.1038/nm.3910. - DOI - PMC - PubMed
    1. Kageyama S, et al. Adoptive transfer of MAGE-A4 T-cell receptor gene-transduced lymphocytes in patients with recurrent esophageal cancer. Clin. Cancer Res. 2015;21:2268–2277. doi: 10.1158/1078-0432.CCR-14-1559. - DOI - PubMed
    1. Morgan RA, et al. Cancer regression in patients after transfer of genetically engineered lymphocytes. Science. 2006;314:126–129. doi: 10.1126/science.1129003. - DOI - PMC - PubMed
    1. O’Rourke DM, et al. A single dose of peripherally infused EGFRvIII-directed CAR T cells mediates antigen loss and induces adaptive resistance in patients with recurrent glioblastoma. Sci. Transl. Med. 2017;9:eaaa0984. doi: 10.1126/scitranslmed.aaa0984. - DOI - PMC - PubMed
    1. Maude SL, et al. Tisagenlecleucel in children and young adults with B-cell lymphoblastic leukemia. N. Engl J. Med. 2018;378:439–448. doi: 10.1056/NEJMoa1709866. - DOI - PMC - PubMed

Publication types

Substances