. 2022 Mar;603(7903):885-892.
doi: 10.1038/s41586-021-04369-3. Epub 2022 Feb 14.

A human brain vascular atlas reveals diverse mediators of Alzheimer's risk

Affiliations

A human brain vascular atlas reveals diverse mediators of Alzheimer's risk

Andrew C Yang et al. Nature. 2022 Mar.

Abstract

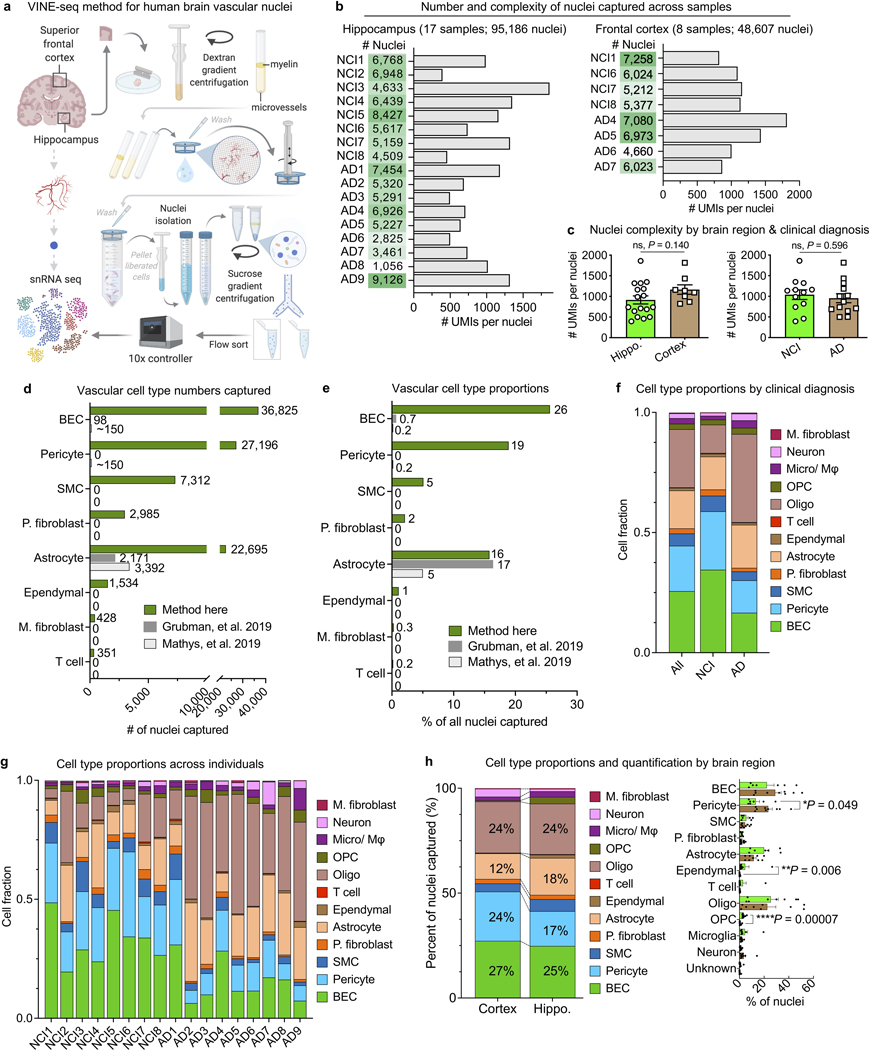
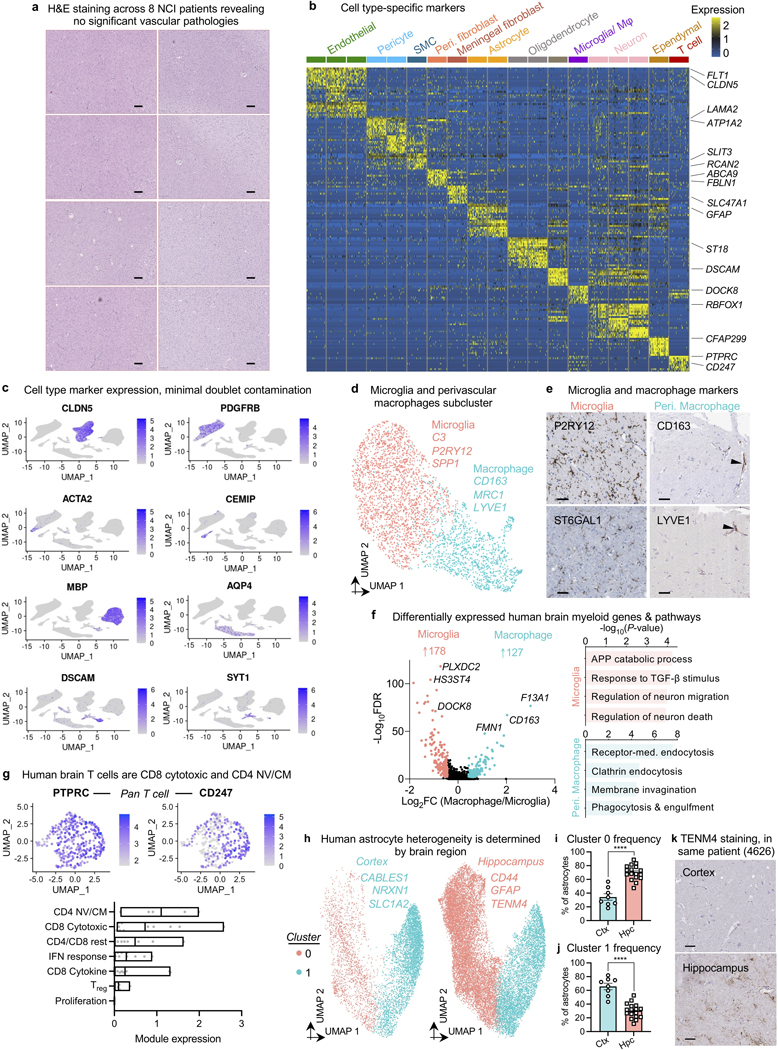
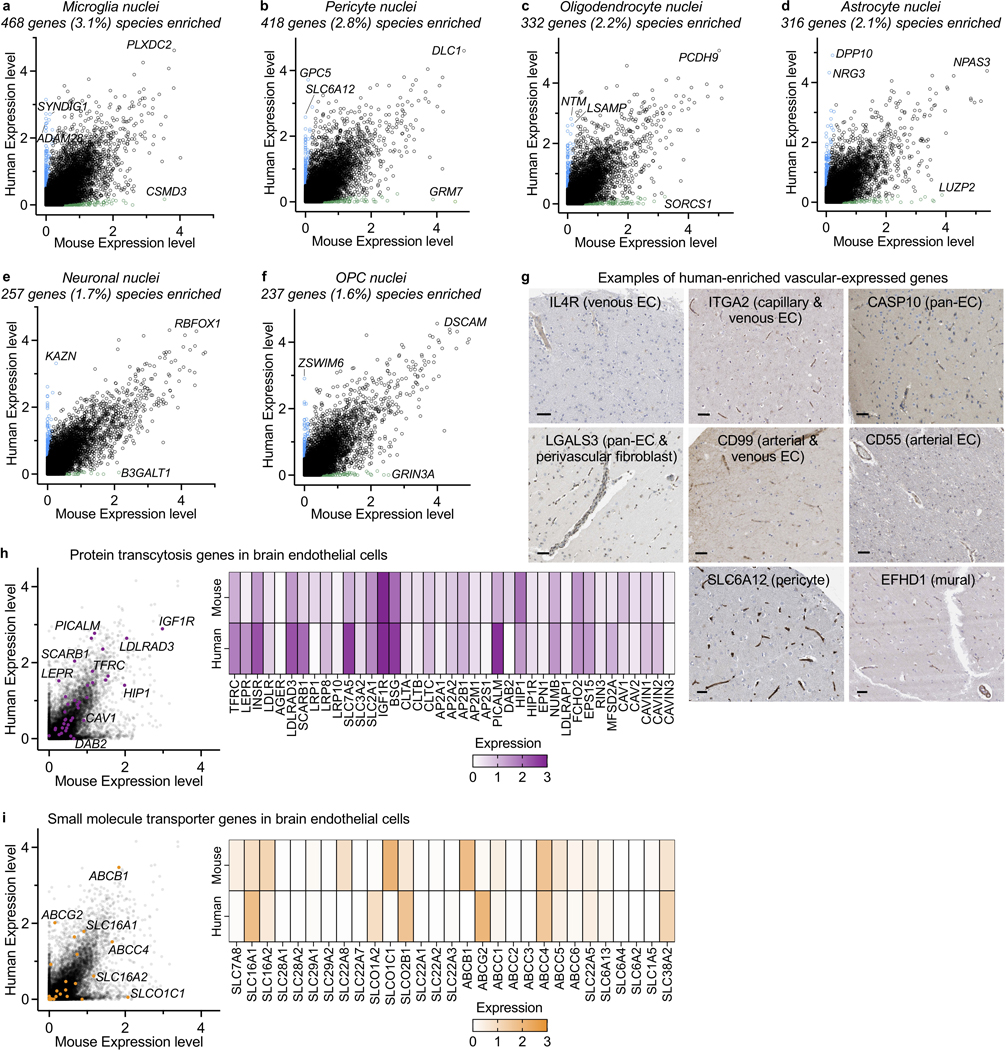
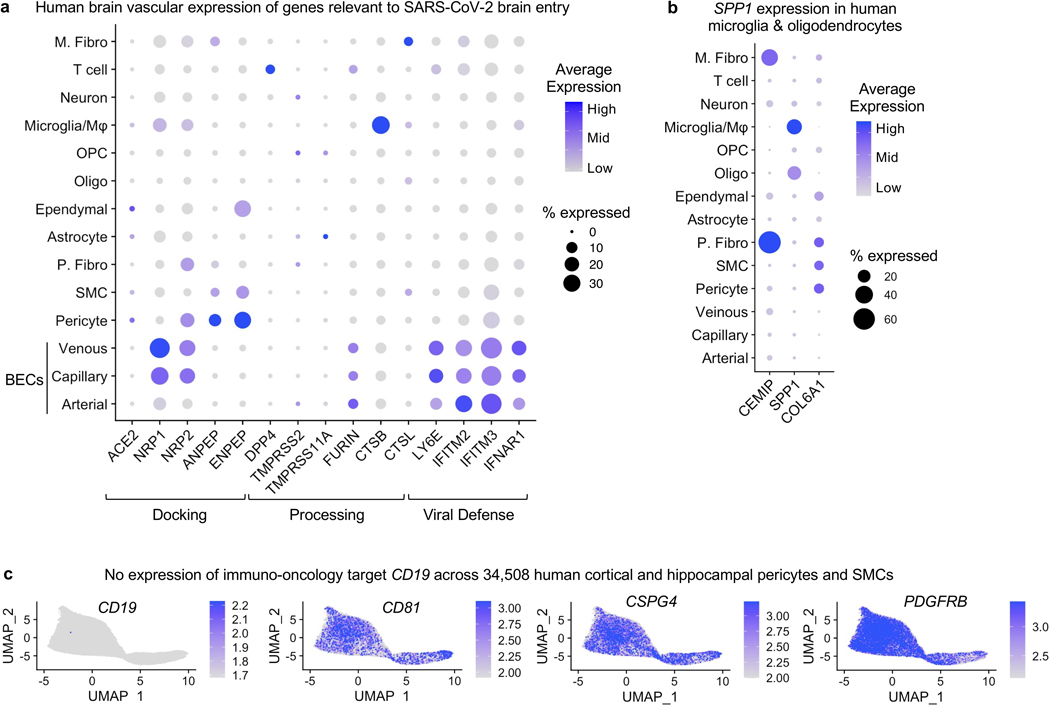
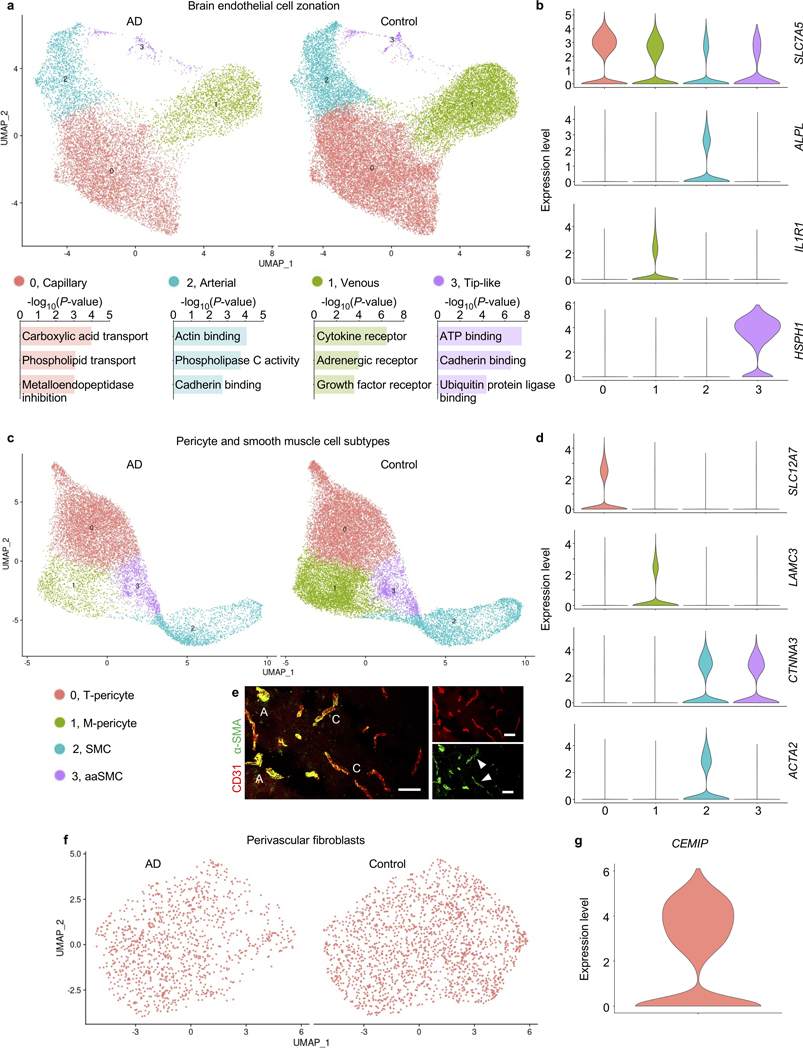
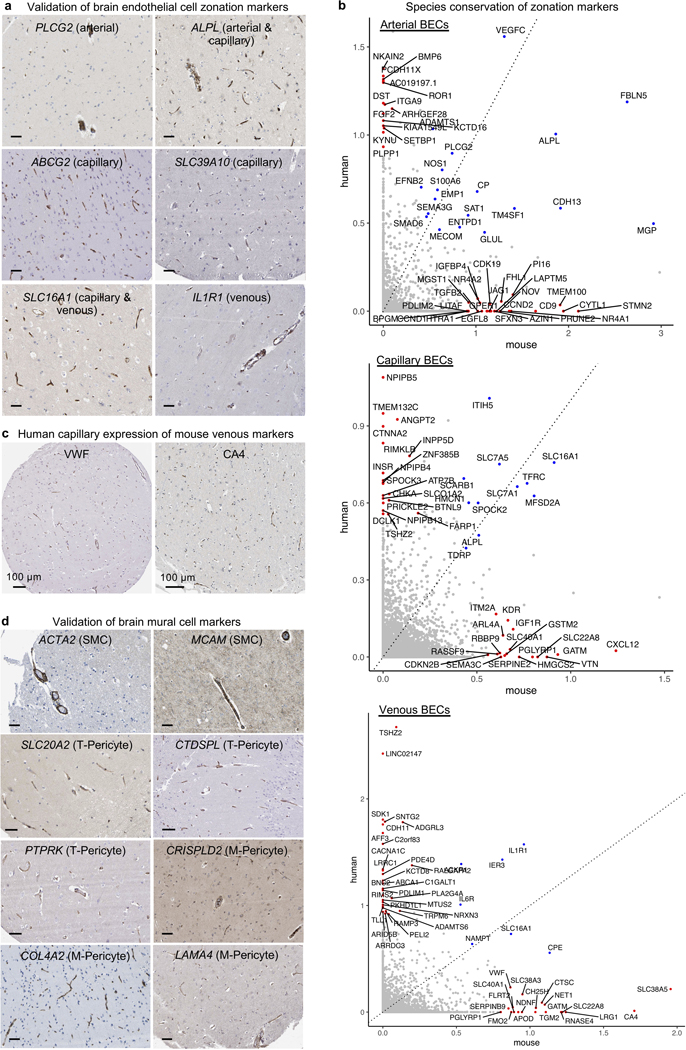
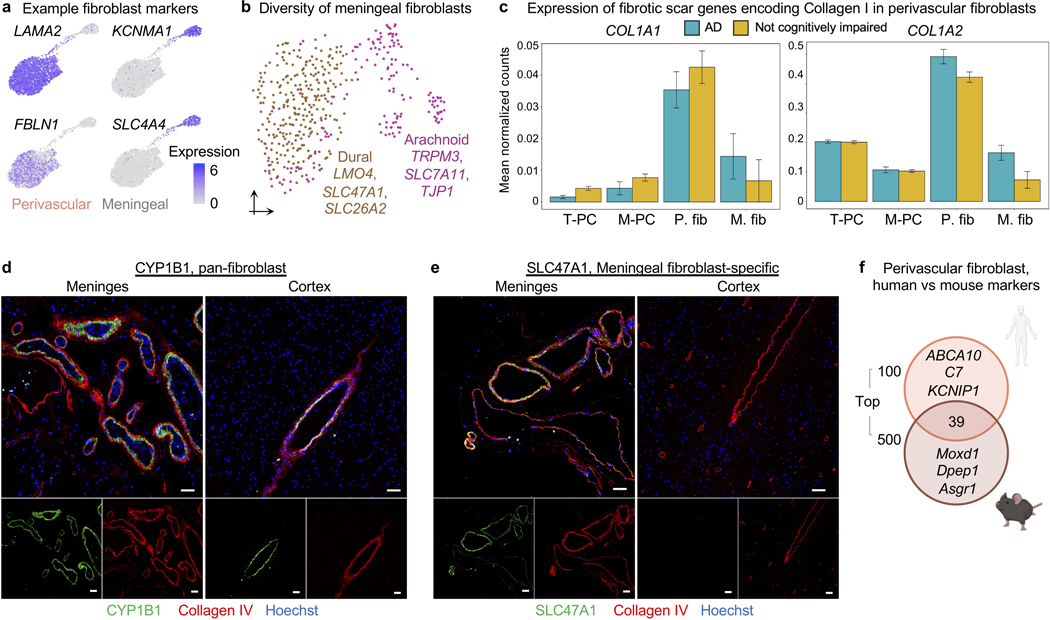
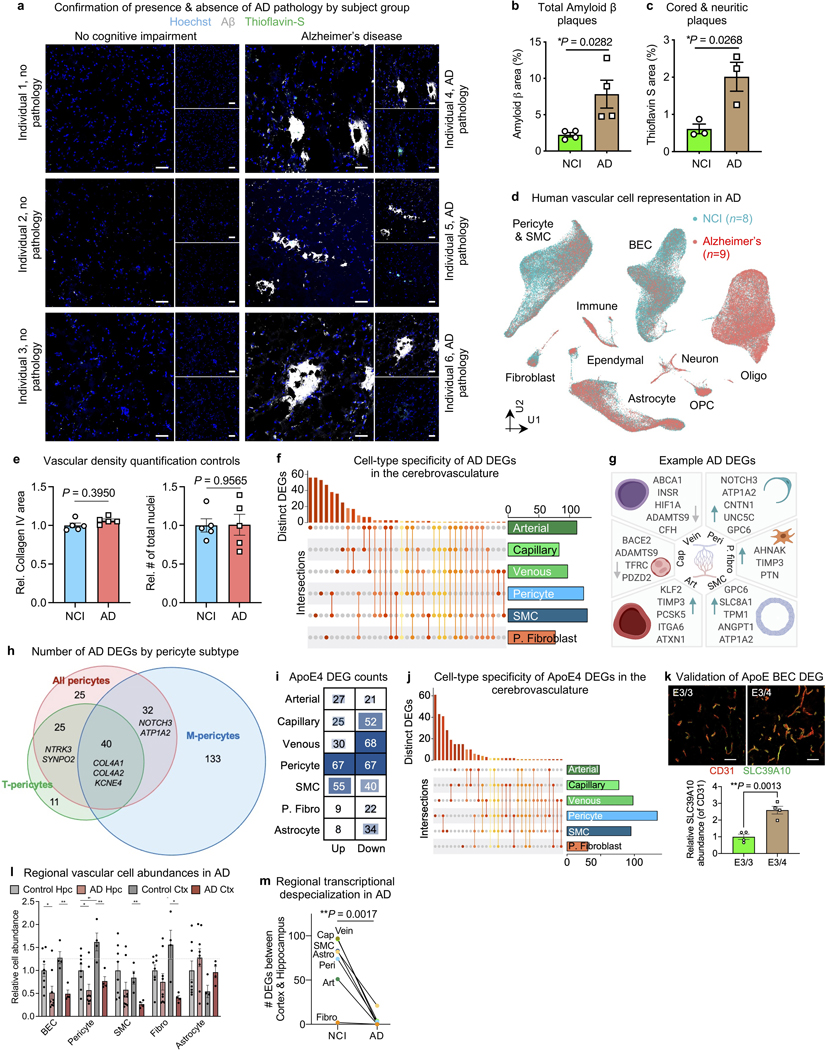
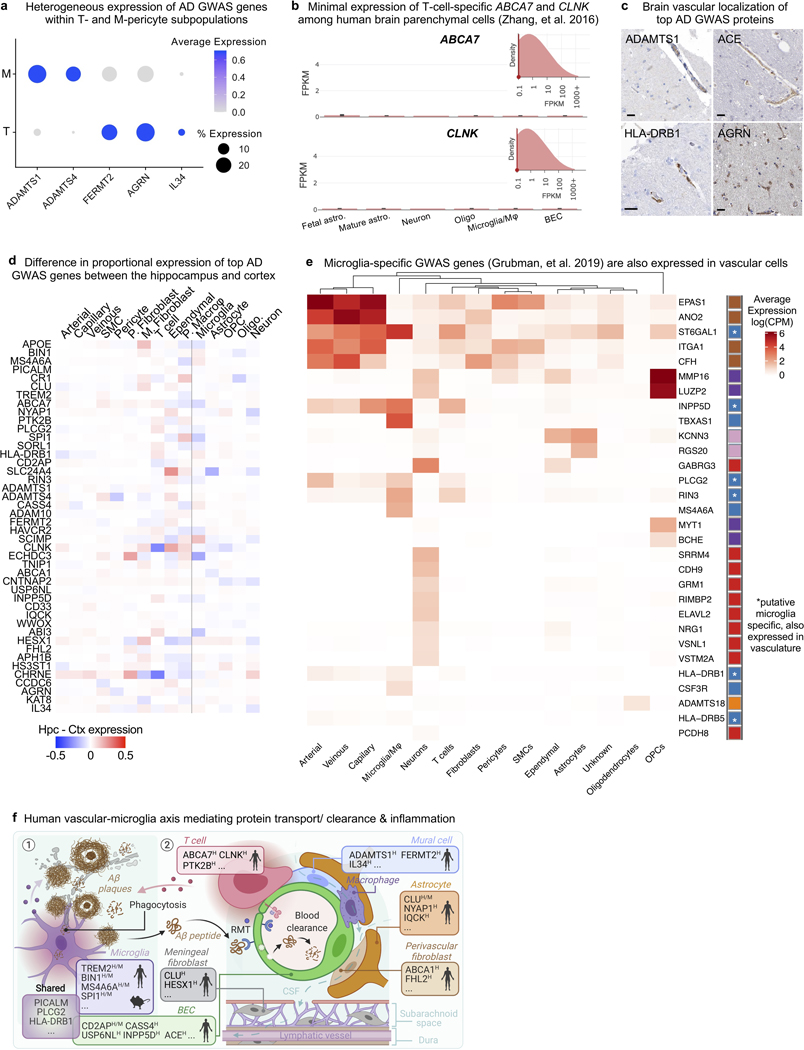
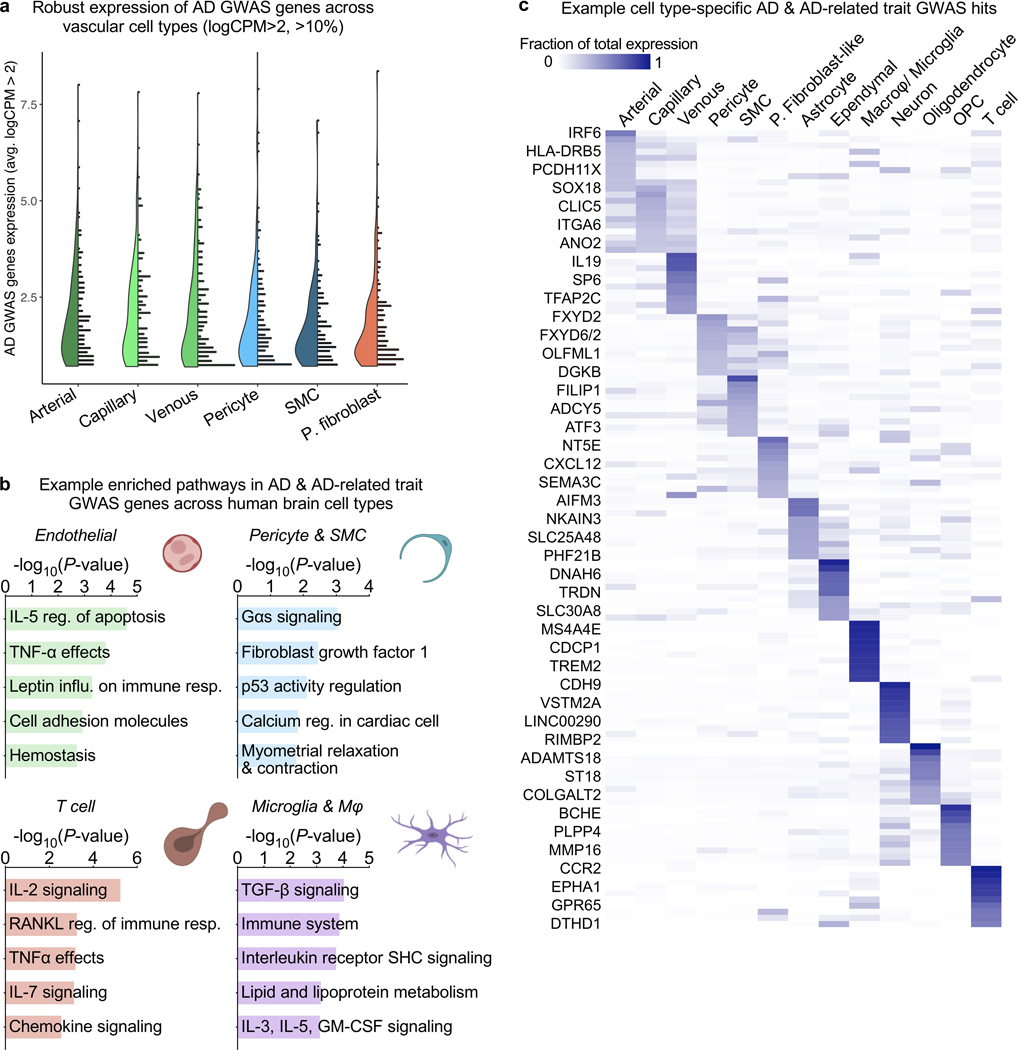
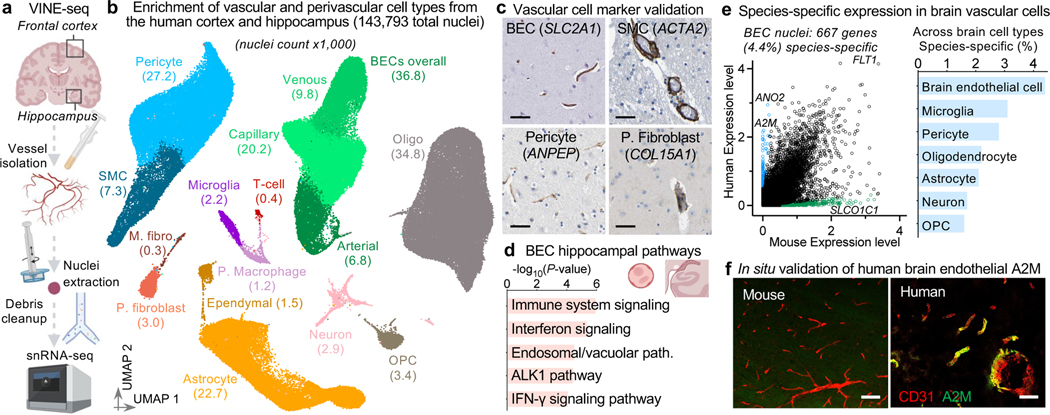
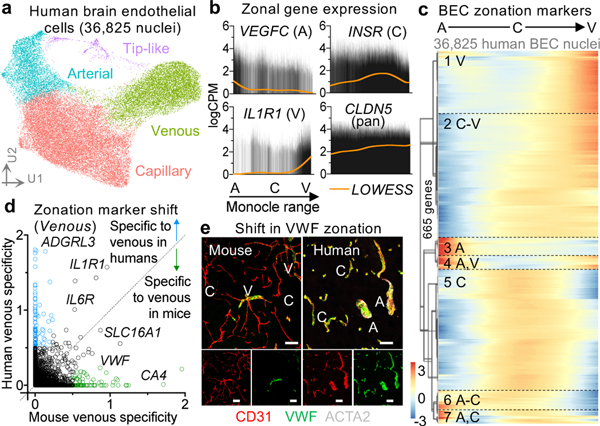
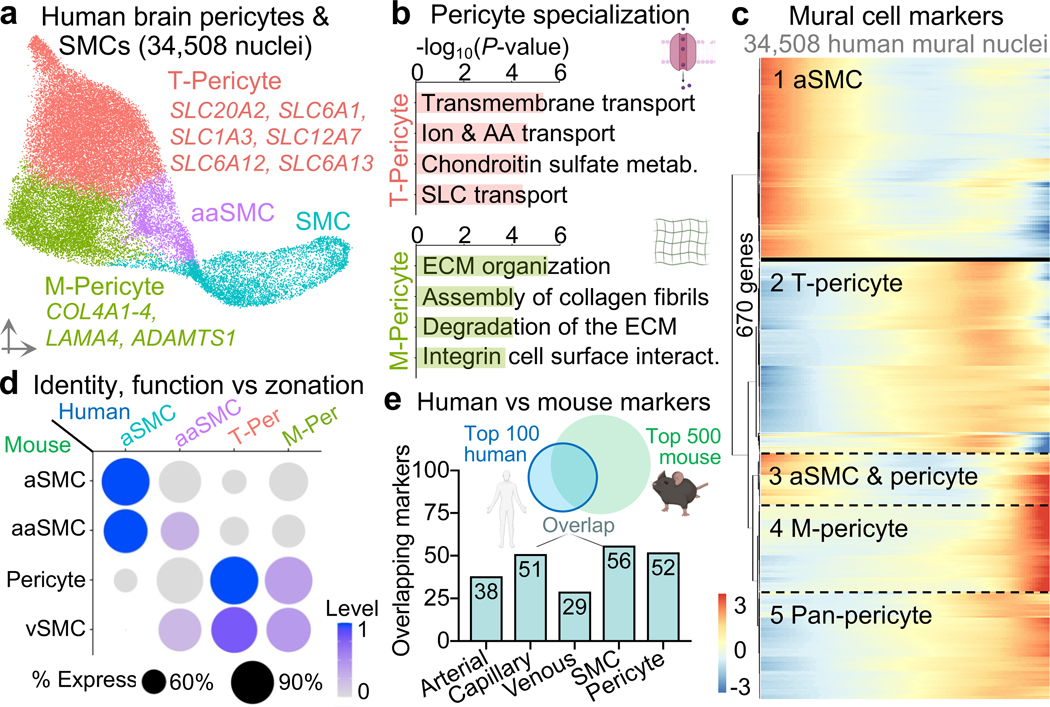
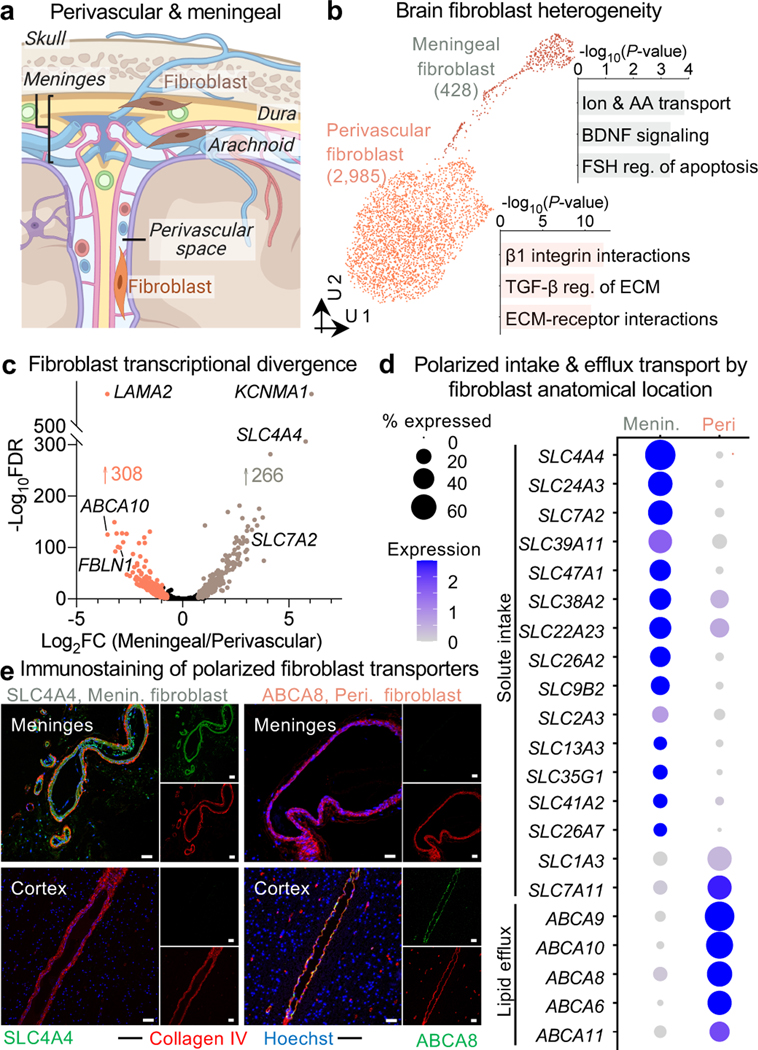
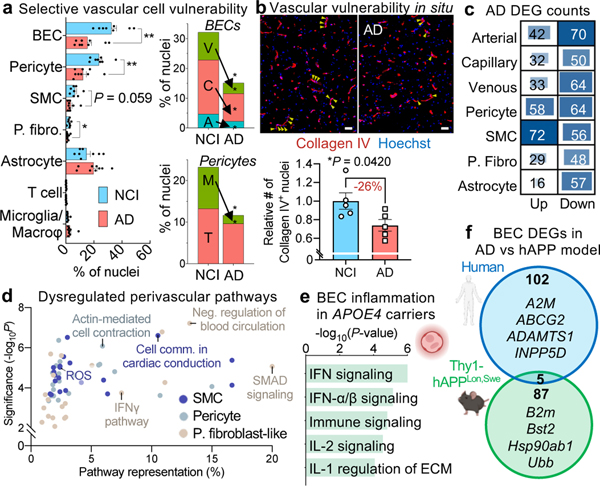
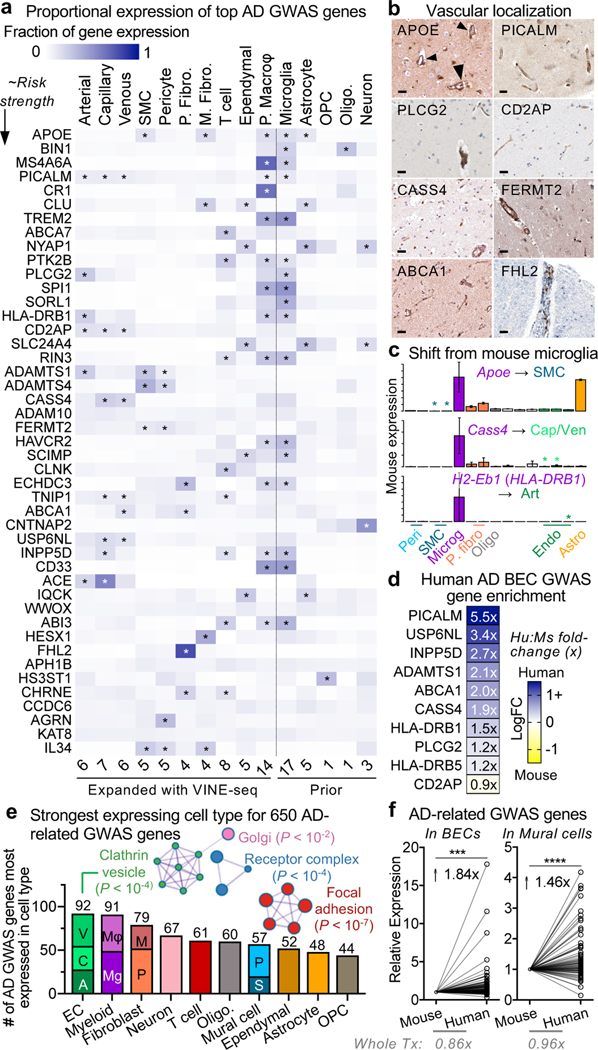
The human brain vasculature is of great medical importance: its dysfunction causes disability and death1, and the specialized structure it forms-the blood-brain barrier-impedes the treatment of nearly all brain disorders2,3. Yet so far, we have no molecular map of the human brain vasculature. Here we develop vessel isolation and nuclei extraction for sequencing (VINE-seq) to profile the major vascular and perivascular cell types of the human brain through 143,793 single-nucleus transcriptomes from 25 hippocampus and cortex samples of 9 individuals with Alzheimer's disease and 8 individuals with no cognitive impairment. We identify brain-region- and species-enriched genes and pathways. We reveal molecular principles of human arteriovenous organization, recapitulating a gradual endothelial and punctuated mural cell continuum. We discover two subtypes of human pericytes, marked by solute transport and extracellular matrix (ECM) organization; and define perivascular versus meningeal fibroblast specialization. In Alzheimer's disease, we observe selective vulnerability of ECM-maintaining pericytes and gene expression patterns that implicate dysregulated blood flow. With an expanded survey of brain cell types, we find that 30 of the top 45 genes that have been linked to Alzheimer's disease risk by genome-wide association studies (GWASs) are expressed in the human brain vasculature, and we confirm this by immunostaining. Vascular GWAS genes map to endothelial protein transport, adaptive immune and ECM pathways. Many are microglia-specific in mice, suggesting a partial evolutionary transfer of Alzheimer's disease risk. Our work uncovers the molecular basis of the human brain vasculature, which will inform our understanding of overall brain health, disease and therapy.


Figures

Extended Data Fig. 1.
Extended Data Fig. 1.. Enhanced capture and characterization of human brain vascular nuclei.
a, Detailed schematic of the VINE-seq method to capture human brain vascular and immune cell types for single-nucleus sequencing. b, Total number of nuclei, median number of unique molecular identifiers (UMI), and median number of genes for each human sample sequenced from hippocampus and superior frontal cortex. c, Quantification of the median number of genes detected per nuclei across subject groups (n=17 hippocampus and n=8 cortex; n=8 NCI and n=9 AD, two-sided t-test; mean +/− s.e.m.). d, e, Quantification of the number (d) and proportion (e) of cerebrovascular cell types captured via the VINE-seq method introduced here compared to recent snRNA-seq studies,. f, Summary quantification of the proportion of captured cell types by NCI and AD individuals. g, Quantification of the proportion of captured cell types across individuals. h, Summary (left) and quantification (right) of the proportion of captured cell types by brain region (n=17 hippocampus and n=8 cortex; n=8 NCI and n=9 AD, two-sided t-test; mean +/− s.e.m.).
Extended Data Fig. 2.
Extended Data Fig. 2.. Diversity and heterogeneity of human brain vascular cell types.
a, Representative H&E images used by two neuropathologists to evaluate NCI cortical and hippocampal tissue for vascular pathology. No significant vascular pathology was observed. Scale bar = 200 μM. b, Discovery of the top cell type-specific marker genes across the major classes of cells captured. The color bar indicates gene expression from low (blue) to high (yellow). c, Validation of cell type annotations and confirmation of minimal doublet contamination using established cell type markers. d, UMAP projection of captured myeloid cells, forming two distinct clusters corresponding to parenchymal microglia and brain barrier macrophages. Example marker genes listed. e, Immunohistochemical validation of microglial and perivascular macrophage markers. Scale bar = 50 microns. Image credit: Human Protein Atlas (http://www.proteinatlas.org),. f, Global view of differentially expressed genes comparing human brain macrophages and microglia (left, MAST, Benjamini Hochberg correction; FDR < 0.01 and logFC>0.5 [log2FC>0.72] to be colored significant). Pathways enriched in microglia versus macrophages (right), recapitulating interesting biology such as the unique TGF-β molecular signature in microglia. g, Expression of top gene markers for various T cell subtypes (top), and quantification of their expression as a module (bottom). Brain T cells exhibit highest expression of markers corresponding to CD8 cytotoxic and CD4 Naive/Central memory (NV/CM) T cells. h, UMAP projection of captured astrocytes, forming two distinct clusters, and split by brain region. Example marker genes listed. i-j, Quantification of astrocyte cluster 0 (b) and 1 (c) frequency in the cortex and hippocampus (n=8 cortex and n=17 hippocampus, Mann-Whitney t-test; mean +/− s.e.m.). k, Immunohistochemical validation of the brain region-specific astrocyte marker TENM4. Scale bar = 50 microns.
Extended Data Fig. 3.
Extended Data Fig. 3.. Species-specific gene expression across brain cell types and their pharmacological relevance.
a-f, Identification of species-specific genes. Both mouse and human transcriptomes were generated and analyzed similarly via single-nucleus RNA-sequencing. Mice were 19 months of age to match the average age of our human cohort. Species-specific/enriched are colored. g, Immunohistochemical confirmation of genes predicted to be enriched or specific to human cerebrovascular cells compared to mouse (isolated mouse nuclei and per Vanlandewijck, et al., 2018), in terms of overall expression or zonation. In parenthesis is the cell type predicted to be uniquely or exhibiting enriched expressed in human over mouse. Scale bar = 50 microns. Image credit: Human Protein Atlas (http://www.proteinatlas.org),. h-i, Mouse and human brain endothelial cell expression of genes mediating protein transcytosis (h) and small molecule influx and efflux (i).
Extended Data Fig. 4.
Extended Data Fig. 4.. Human brain vascular expression of genes relevant to disease.
a, Brain vascular expression of genes relevant to SARS-CoV-2 brain entry, as summarized in Iadecola, et al. 2020. b, Expression of the mouse perivascular fibroblast-like gene Spp1 is instead specifically expressed in human myeloid cells and oligodendrocytes (SPP1, top). c, No expression of the immuno-oncology target CD19 and its chaperone CD81 across human adult brain pericytes and smooth muscle cells. Note: cells with any finite expression are ordered to the front to ensure all expression is visible, but this carries the potential to visually overestimate average expression
Extended Data Fig. 5.
Extended Data Fig. 5.. Brain endothelial and mural cell zonation and subpopulations.
a, UMAP projection of captured brain endothelial cells, organizing by arteriovenous zonation. Bottom, tip cell markers expressed in the tip-like/ proteostatic EC cluster. b, Validation of brain endothelial cell zonation clusters using established zonation markers. Violin plots are centered around the median, with their shape representing cell distribution. c, d, As in (a-b) but for pericytes and smooth muscle cells. Note that the anatomical locations of pericyte 0 and 1 have not yet been determined. e, Immunohistochemical validation of ACTA2 (α-SMA) expression in human smooth muscle cells and less so in capillary pericytes. A denotes arterial and C denotes capillary. Arrowheads specify capillary pericytes expressing ACTA2. Scale bar = 50 microns. f, g, As in (a-b) but for perivascular fibroblast-like cells, as recently discovered in mice.
Extended Data Fig. 6.
Extended Data Fig. 6.. Brain endothelial zonation and mural cell subtype markers.
a, Immunohistochemical validation of zonation and cell subtype markers in brain endothelial cells. Scale bar = 50 microns. Image credit: Human Protein Atlas (http://www.proteinatlas.org),. b, Comparison of the zonal specificity of genes in arterial, capillary, and venous cells. Axis plot a specificity score, as defined in the Methods. For example, specificity score for capillaries = avg(logFC(cap/ven), logFC(cap/art)). c, Immunohistochemical validation of capillary expression in human brains of the mouse venous-specific marker VWF and CA4, with similar patterns observed across multiple primary antibody clones. Scale bar = 100 microns. Image credit: Human Protein Atlas (http://www.proteinatlas.org),. d, Immunohistochemical validation of zonation and cell subtype markers in brain SMCs and pericytes. Scale bar = 50 microns. Image credit: Human Protein Atlas (http://www.proteinatlas.org),.
Extended Data Fig. 7.
Extended Data Fig. 7.. Specialization and functions of human brain fibroblasts.
a, Expression of example markers demarcating perivascular from meningeal fibroblasts. b, UMAP of 428 meningeal fibroblast nuclei, subclustering into anatomically segregated dural and arachnoid space fibroblasts. c, Expression of the genes constituting the major fibrotic scar component Collagen I in pericytes and fibroblasts. Collagen I is composed of two components, COL1A1 and COL1A2. Column annotations: T-PC = solute transport pericyte and M-PC = Extracellular matrix regulating pericyte, P. FB = Perivascular fibroblast, and M. FB = Meningeal fibroblast. d-e, Protein immunostaining validation of polarized expression of human brain meningeal and perivascular fibroblast pumps: the common marker CYP1B1 (a, serves as a control) and the meningeal fibroblast-specific influx pump SLC47A1 (b). Scale = 50 μM. f, Overlap between the top 100 perivascular fibroblast-like cell markers and those identified in mice. A more lenient set of 500 (instead of 100) mouse markers were used for comparison to ensure claims of species-specificity were robust. Note: the species-conservation of a cell type marker depends on speciesspecific changes in the given cell type and changes amongst the remaining background cell types.
Extended Data Fig. 8.
Extended Data Fig. 8.. Vascular cell-type specific perturbations in AD patients and ApoE4 carriers.
a, Immunohistochemistry with anti-β-amyloid antibody (D54D2, white), Thioflavin S (green), and Hoechst (blue) in the hippocampus of NCI and AD individuals. Scale bar = 40 microns. b, Quantification of β-amyloid immunostaining in (a) for overall β-amyloid (n=4 NCI and AD, two-sided t-test; mean +/− s.e.m.). c, As in (b) but for cored and neuritic β-amyloid plaques (n=3 NCI and AD, two-sided t-test; mean +/− s.e.m.). d, UMAP of 143,793 nuclei captured from 17 human hippocampus and superior frontal cortex samples, colored by Alzheimer’s disease (AD) diagnosis. e, Quantification controls for Fig. 5b. Quantification of Collagen IV+ vasculature (left) and number of total (regardless of Collagen IV+ overlap) Hoechst+ nuclei (n = 5 NCI and AD, nested two-sided t-test; mean +/− s.e.m.). f, Matrix layout for intersections of AD DEGs shared across and specific to each cell type. Circles in the matrix indicate sets that are part of the intersection, showing that most DEGs are cell type-specific. g, Example differentially expressed genes (DEGs) in AD: arterial (Art), capillary (Cap), venous (Vein), pericyte (Peri), perivascular fibro blast-like cell (P. fibro), and smooth muscle cell (SMC). Blue arrow indicates upregulated and grey arrow downregulated genes. h, Summary of the number of AD DEGs by pericyte class: T-, M-, and all pericytes combined to evaluate DEGs that could arise due to a disproportionate loss of M-pericytes in AD. i, Differentially expressed gene (DEG) counts for each cell type in ApoE4 carriers (n = 5 ApoE3/3, n = 11 ApoE3/4 or ApoE4/4): arterial (Art), capillary (Cap), venous (Vein), pericyte (Peri), perivascular fibro blast-like cell (P. fibro), and smooth muscle cell (SMC). The intensity of the blue color and the size of the squares are proportional to entry values. j, Matrix layout for intersections of ApoE4 DEGs shared across and specific to each cell type. Circles in the matrix indicate sets that are part of the intersection, showing that most DEGs are cell type-specific. k, Immunohistochemical validation of the predicted upregulated anti-inflammatory DEG SLC39A10 in venous BECs of ApoE4 carriers. Scale bar = 50 microns (n = 4 ApoE3/3 and ApoE4 carriers, nested two-sided t-test; mean +/− s.e.m.). l, Among patients with both hippocampus and superior frontal cortex profiled (n=4 NCI and n=4 AD), quantification of the relative abundance of major vascular cell types (NCI hippocampus set as reference, unpaired two-sided t-test; mean +/− s.e.m.). *BEC P = 0.0260, **BEC P = 0.0023, *Pericyte P (left) = 0.0357, *Pericyte P (mid) = 0.0237, **Pericyte P = 0.0077, **SMC P = 0.0075, *Fibroblast P = 0.0109, *Astrocyte P = 0.0357 m, As in (l), but comparison of the number of DEGs between brain regions for each cerebrovascular cell type. Analysis done separately for NCI and AD samples (n=7 cell types, unpaired two-sided t-test; mean +/− s.e.m.).
Extended Data Fig. 9.
Extended Data Fig. 9.. Re-evaluation and characterization of top AD GWAS genes expressed in the human brain vasculature.
a, Heterogeneous expression of AD GWAS genes across T- and M-pericyte subtypes. b, RNA-seq data of the predicted T cell-specific AD GWAS genes EPHA1 and ABCA7 in an independent dataset, corroborating minimal expression across resident/ parenchymal brain cells. c, Immunohistochemical confirmation of vascular localization of proteins encoded by 12 top AD GWAS genes from (a). Scale bar = 25 microns. Arrowheads in APOE point to signal around larger diameter vessels, consistent with predicted SMC expression. Image credit: Human Protein Atlas (http://www.proteinatlas.org),. d, Heatmap comparing expression patterns of top AD GWAS genes in the hippocampus and superior frontal cortex: e.g., several microglia-expressed GWAS genes like APOE, MS4A4A, and TREM2 are more highly expressed in hippocampal compared to cortical microglia/ macrophages. e, GWAS genes found to be expressed specifically in microglia among cells captured using the conventional nuclei isolation process (from Grubman, Chew, Ouyang, et al. 201917) are also expressed in vascular cells (asterisks). f, Summary of AD GWAS genes enriched in microglia and vascular cells mediating common pathways in protein clearance and inflammation. Mouse and human superscripts denote whether expression has been confirmed in that species for a given gene. Proposed model is described in Discussion.
Extended Data Fig. 10.
Extended Data Fig. 10.. Brain vascular and perivascular expression of AD and AD-related GWAS genes.
a, Expression of Alzheimer’s disease (AD) and AD-related GWAS risk genes (from Grubman, Chew, Ouyang, et al. 2019) across human vascular cells. b, Enriched biological pathways amongst AD and AD-related trait GWAS genes expressed in each cell type. c, For each cell type, the top 10 most specifically expressed AD and AD-related trait GWAS genes.
Figure 1.
Figure 1.. Cells of the human brain vasculature.
a, VINE-seq method to enrich vascular nuclei from postmortem human brain samples. b, Uniform Manifold Approximation and Projection (UMAP) of 143,793 nuclei from 25 human hippocampus and superior frontal cortex samples across 17 individuals, colored by cell type and labeled with nuclei numbers. c, Immunohistochemical validation of cell type-specific gene markers. Scale bar = 50 microns. Image credit: Human Protein Atlas (http://www.proteinatlas.org). d, Enriched biological pathways in BECs from the hippocampus compared to the superior frontal cortex, in not cognitive impairment (NCI) individuals (P value < 0.05, cumulative hypergeometric test). e, Scatter plot (left) depicting mRNA expression levels (logCPM) of mouse and human genes with one-to-one orthologs in BECs. Divergently expressed genes are colored (>10-fold difference, minimum 0.5 log2CPM expression). Proportion of each brain cell type’s transcriptome that is specific to human versus mouse (same thresholds, right). f, Immunohistochemical validation of A2M protein specifically in the human but not mouse vasculature. Scale bar = 50 microns.
Figure 2.
Figure 2.. Organizing principles of human brain endothelial cells.
a, UMAP of 36,825 human brain endothelial cell (BEC) nuclei, colored by zonation. b, Zonal expression of transcripts across human BECs ordered by Monocle pseudotime. LOWESS regression line (orange) and density of black lines (counts) correspond with expression levels. A = arterial, C = capillary, and V = venous. c, Heatmap of zonation-dependent gene expression in human BECs. d, Scatter plot depicting the specificity of transcripts for venous BECs in mice versus humans. Venous specificity score = avg(logFC(vein/cap), logFC(vein/art)). For example, VWF is predicted to be more specific to venous BECs in mice than it is in humans. See Extended Data Fig. 9 for arterial and capillary specificity plots. e, Immunohistochemical validation of VWF specificity to venous BECs in mice but not in humans. Scale bar = 50 microns.
Figure 3.
Figure 3.. Organizing principles of human brain mural cells.
a, UMAP of 34,508 human pericyte and smooth muscle cell nuclei, colored by cell subtype. aSMC = arterial smooth muscle cell (aSMC), aaSMC = arteriole SMCs, T-Pericyte = solute transport pericytes, and M-Pericyte = Extracellular matrix regulating pericytes. b, Enriched biological pathways in T- and M-pericytes compared to remaining SMC and pericyte populations (P value < 0.05, cumulative hypergeometric test). c, Heatmap of gene expression in human SMCs and pericytes. Solid line delineating aaSMC/aSMCs from pericytes reflects an abrupt transcriptomic transition. Note that unlike BECs, mural cell ordering does not reflect anatomical arteriovenous ordering. d, Mapping expression of mouse mural cell markers onto human mural cell types. The top 500 mouse markers were aggregated into four distinct modules (‘aSMCs’, ‘aaSMCs’, capillary ‘pericytes’, venous smooth muscle cells ‘vSMCs’) and their expression assessed in the four transcriptionally distinct human mural cell types. e, Overlap between the top 100 human endothelial and mural cell subtype markers and those identified in mice. A more lenient set of 500 mouse markers was used for comparison for robust results. Note that species-conservation of a cell type marker depends on species-specific changes in the given cell type and changes among remaining cell types.
Figure 4.
Figure 4.. Molecular definitions for brain perivascular and meningeal fibroblasts.
a, Anatomical reference of the human meninges (dura and arachnoid) and perivascular space, each with a resident fibroblast population. b, UMAP of 2,985 human perivascular fibroblast-like nuclei and 428 meningeal fibroblast nuclei. Enriched biological pathways derived from respective fibroblast cell type markers (Supplemental Table 2, P value < 0.05, cumulative hypergeometric test). c, Differentially expressed genes between perivascular (left, orange) and meningeal (right, brown) fibroblasts (MAST, Benjamini Hochberg correction; FDR < 0.01 and logFC>0.5 [log2FC>0.72] to be colored significant). d, Expression of all differentially expressed (from (c)) SLC and ABC family members across perivascular and meningeal fibroblasts. e, Immunostaining validation of polarized meningeal and perivascular fibroblast transporter expression: the meningeal fibroblast-specific influx pump SLC4A4 (left, green) stains selectively in the meninges but not cortical vasculature (red); and vice versa for the perivascular-specific efflux pump ABCA8 (right, green). Scale = 50 μM.
Figure 5.
Figure 5.. Vascular cell-type specific perturbations in Alzheimer’s disease.
a, Proportion of cell types captured in Alzheimer’s disease (AD) and no cognitive impairment individuals (NCI) (left). Proportion of BEC and pericyte subpopulations in AD and NCI (right) (n = 8 NCI, n = 9 AD, two-sided t-test; mean +/− s.e.m.). **BEC P = 0.002, **Pericyte P = 0.003, *P. fibroblast P = 0.0461. b, Immunohistochemical validation of a loss of vascular cell density in AD (number of Hoechst+ nuclei within Collagen IV+ vasculature). Scale bar = 50 microns (n = 5 NCI and AD, nested two-sided t-test; mean +/− s.e.m.). Yellow arrows denote example vascular nuclei. c, Differentially expressed gene (DEG) counts for each cell type in AD. The intensity of the blue color and the size of the squares are proportional to entry values. d, Enriched biological pathways from AD differentially expressed genes in pericytes, smooth muscle cells, and perivascular fibroblast-like cells, plotted by Pathway Representation (in a given pathway, what proportion of all members are DEGs) and Significance (-log10P) of pathway enrichment. e, Enriched biological pathways from genes upregulated in AD APOE4 carriers in capillary and venous endothelial cells (P value < 0.05, cumulative hypergeometric test). f, Venn diagram comparing DEG BECs in human AD samples compared to those from the Thy1-hAPP T41BLon,Swe amyloidosis mouse model. Note that only genes with human-mouse orthologs are shown, and that the absolute logFC threshold for calling DEGs in mouse APP BECs was lowered to 0.15 (by half) to ensure claims of limited overlap with human BECs were robust.
Figure 6.
Figure 6.. GWAS disease variants are enriched in the human brain vasculature.
a, Proportional expression of the top 45 AD GWAS genes across all major brain cell types. Expression values for a given gene sums to 1 across cell types using the EWCE method. Genes ordered in approximate risk strength–,. Asterisks denote strongest expressing cell types. Cells to the left of dashed line are from the vasculature, newly added here; to the right, parenchymal cells captured before. Numbers on the bottom summarize the number of GWAS genes enriched in a given cell type. Note: MSA46A represents the average expression of MS4A46A, MS4A4A, and MS4A4E; likewise, HLADRB1 averages HLA-DRB1 and HLA-DRB5. EPHA1 was not robustly detected. b, Immunohistochemical confirmation of vascular localization of proteins encoded by top AD GWAS genes from (a). Scale bar = 25 microns. Arrowheads in APOE point to signal around larger diameter vessels, consistent with SMC expression. Image credit: Human Protein Atlas (http://www.proteinatlas.org). c, Examples of genes expressed specifically in mouse microglia but then also expressed in human brain vascular cell types (n of ∼3,500 whole cell mouse transcriptomes, mean value +/− SEM). d, BEC heatmap of top AD GWAS genes colored by logFC(human/mouse) and labeled by the linear foldchange (human/mouse) value. e, Quantification of the number of AD and AD-related trait GWAS genes most expressed in a given cell type. 383 of 651 genes (59%) mapped to vascular or perivascular cell types. PPI network of GO Cellular Components (P value < 0.05, cumulative hypergeometric test). A = arterial, C = capillary, V = venous endothelial cell (EC). Mg = microglia, and Mφ = macrophage. In fibroblasts, M = meningeal and P = perivascular. In mural cells, S = SMC and P = pericyte. f, Human enrichment of AD-related trait GWAS genes highest expressed in BECs (left) and mural cells (right). In contrast to GWAS genes, the ratio of human to mouse expression across the overall transcriptome is less than or ∼1 for both cell types (bottom, paired two-sided t-test, ****P < 0.0001 and ***P = 0.0002).

Comment in

References

    1. Feigin VL et al. Global and regional burden of stroke during 1990–2010: Findings from the Global Burden of Disease Study 2010. Lancet 383(9913), 245–255. (2014). doi:10.1016/S0140-6736(13)61953-4. - DOI - PMC - PubMed
    1. Chow BW & Gu C. The Molecular Constituents of the Blood-Brain Barrier. Trends Neurosci. 38, 598–608 (2015). - PMC - PubMed
    1. Profaci CP, Munji RN, Pulido RS & Daneman R. The blood-brain barrier in health and disease: Important unanswered questions. J. Exp. Med. 217(4). (2020). doi:10.1084/jem.20190062. - DOI - PMC - PubMed
    1. Obermeier B, Daneman R & Ransohoff RM. Development, maintenance and disruption of the blood-brain barrier. Nature Medicine 19(12), 1584–1596. (2013). doi:10.1038/nm.3407. - DOI - PMC - PubMed
    1. Sweeney MD, Zhao Z, Montagne A, Nelson AR & Zlokovic BV. Blood-brain barrier: From physiology to disease and back. Physiological Reviews 99(1), 21–78. (2019). doi:10.1152/physrev.00050.2017. - DOI - PMC - PubMed