. 2022 Feb;4(2):190-202.
doi: 10.1038/s42255-022-00525-9. Epub 2022 Feb 14.

Impaired phosphocreatine metabolism in white adipocytes promotes inflammation

Affiliations

Impaired phosphocreatine metabolism in white adipocytes promotes inflammation

Salwan Maqdasy et al. Nat Metab. 2022 Feb.

Abstract

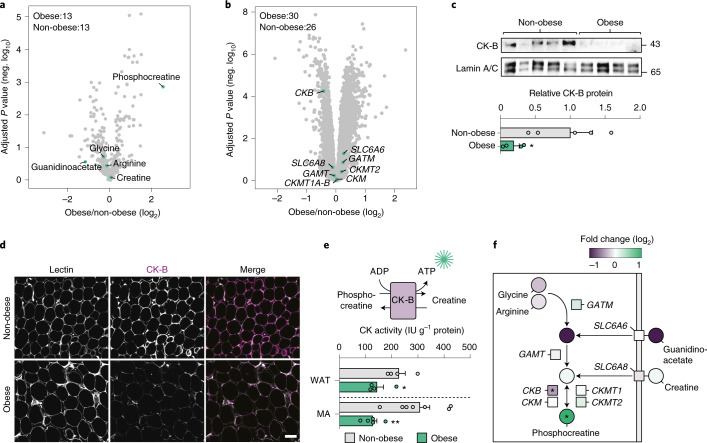
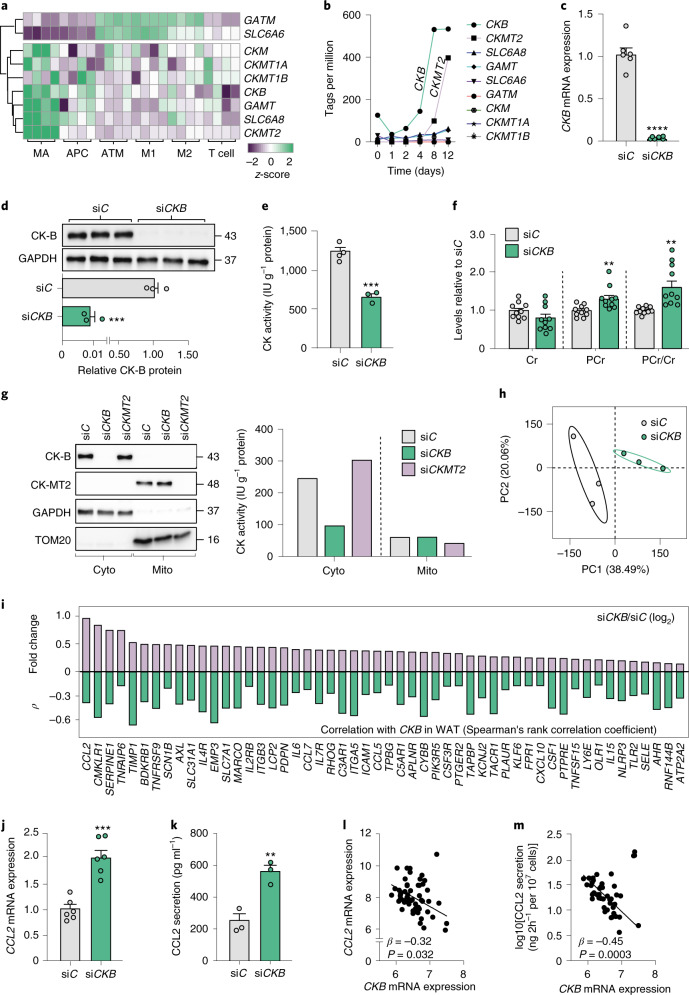
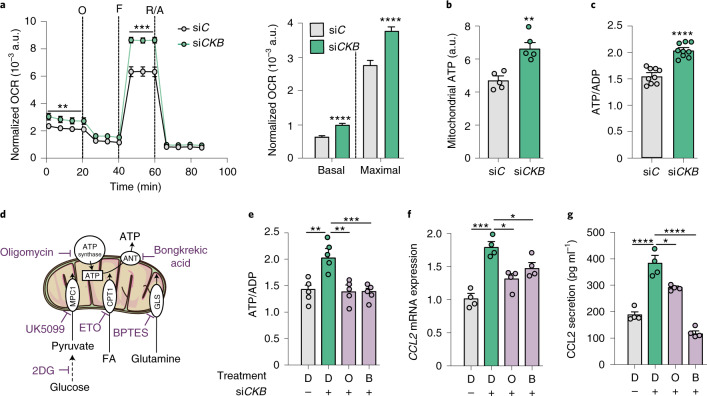
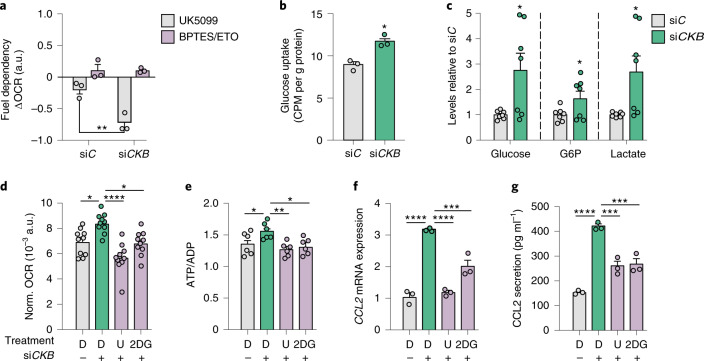
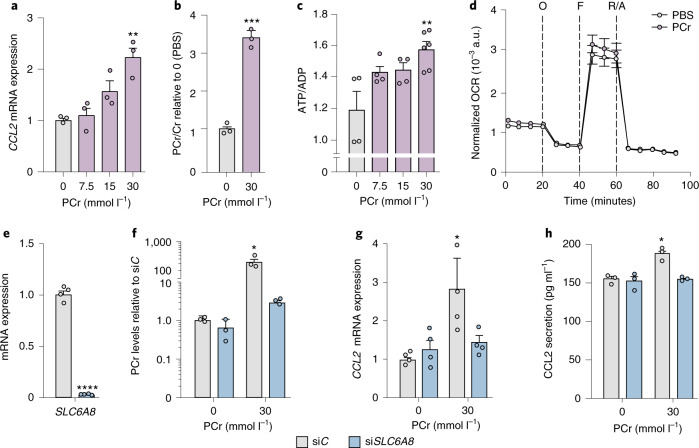
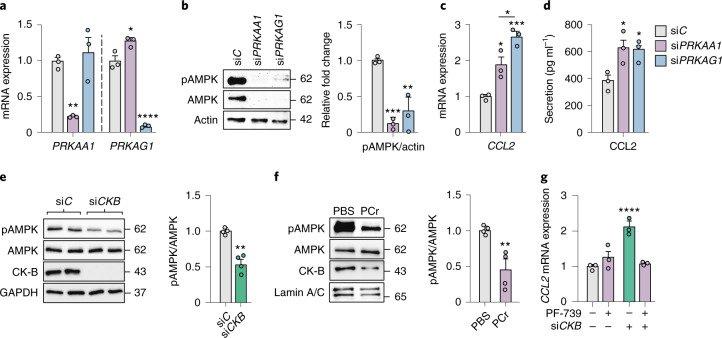
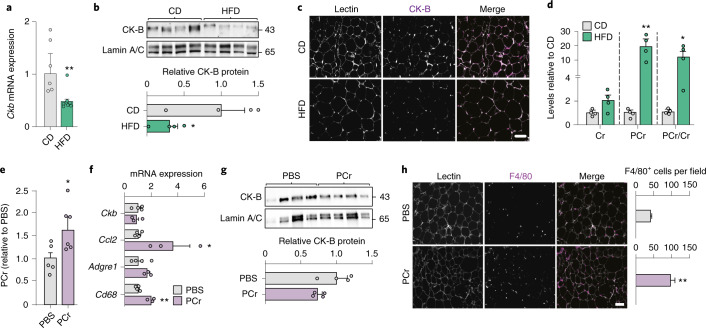
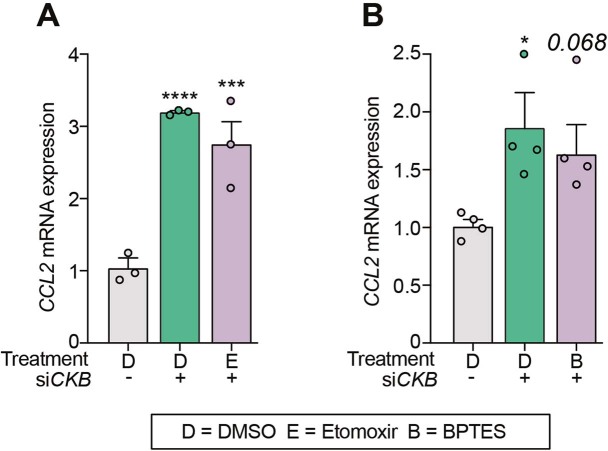
The mechanisms promoting disturbed white adipocyte function in obesity remain largely unclear. Herein, we integrate white adipose tissue (WAT) metabolomic and transcriptomic data from clinical cohorts and find that the WAT phosphocreatine/creatine ratio is increased and creatine kinase-B expression and activity is decreased in the obese state. In human in vitro and murine in vivo models, we demonstrate that decreased phosphocreatine metabolism in white adipocytes alters adenosine monophosphate-activated protein kinase activity via effects on adenosine triphosphate/adenosine diphosphate levels, independently of WAT beigeing. This disturbance promotes a pro-inflammatory profile characterized, in part, by increased chemokine (C-C motif) ligand 2 (CCL2) production. These data suggest that the phosphocreatine/creatine system links cellular energy shuttling with pro-inflammatory responses in human and murine white adipocytes. Our findings provide unexpected perspectives on the mechanisms driving WAT inflammation in obesity and may present avenues to target adipocyte dysfunction.


Conflict of interest statement

The authors declare no competing interests.

Figures

Fig. 1
Fig. 1. Obesity is associated with altered phosphocreatine/creatine metabolism in human WAT.
a, Polar metabolites in subcutaneous WAT of obese (n = 13) and non-obese (NO, n = 13) subjects (cohort 1) highlighting metabolites in the phosphocreatine/creatine pathway (green dots). Data are represented in a volcano plot with fold changes (log2) and adjusted P values (negative (neg.) log10). Statistics were calculated by Welch’s two-sample t-test followed by false discovery rate (FDR) correction for multiple comparisons (q value), according to standard procedures from Metabolon. b, Expression of genes encoding proteins in the phosphocreatine/creatine pathway in subcutaneous WAT of obese (n = 30) and non-obese (n = 26) women (cohort 2). Data are represented in a volcano plot with fold changes (log2) and adjusted P values (neg. log10) calculated using Limma (linear models for microarray and RNA-seq analysis). c, Western blot analysis of CK-B in subcutaneous WAT of obese (n = 4) and non-obese (n = 5) subjects. Lamin A/C was used as a loading control. *P = 0.036 by Student’s two-sided t-test. d, Representative immunofluorescence microphotographs of subcutaneous WAT from obese (n = 3) and non-obese (n = 3) subjects. Sections were stained with Lens culiniaris agglutinin (Lectin) and antibodies targeting CK-B. Scale bar, 50 μm. e, Creatine kinase activity was measured in total subcutaneous WAT (n = 4 from obese and n = 4 non-obese subjects) as well as isolated mature adipocytes (n = 5 from obese and n = 7 non-obese subjects). As illustrated in the upper panel, the creatine kinase activity measured in this assay represents the reverse reaction after addition of ADP where ATP is generated from phosphocreatine. Lower CK-B activity is expected to result in attenuated ATP levels. *P = 0.05; **P = 0.003 by Student’s two-sided t-test. f, Overview of the phosphocreatine/creatine pathway highlighting the alterations in human subcutaneous WAT linked to obesity. Data are represented as fold changes obese versus non-obese (log2). *Significant. In c and e, data are shown as mean ± s.e.m. CK-B, cytokine B; MA, mature adipocytes. Source data
Fig. 2
Fig. 2. CKB silencing induces a pro-inflammatory profile in human white adipocytes.
a, Expression of indicated genes in cells of human subcutaneous WAT. Results are displayed as z-scores. b, Expression of indicated genes during adipogenesis. c, CKB mRNA levels in human adipocytes (six replicates per condition, repeated three times) transfected with non-silencing (siC) or CKB-targeting (siCKB) oligonucleotides. ****P < 0.0001. d, Western blot displaying CK-B and glyceraldehyde 3-phosphate dehydrogenase (GAPDH) in human adipocytes (three replicates per condition, repeated three times) transfected with siC or siCKB. ***P = 0.0002. e, Creatine kinase activity measured in lysates of human adipocytes (three to four replicates per condition, repeated three times) transfected with siC or siCKB. ***P = 0.0003. f, Metabolite levels in human adipocytes (ten replicates per condition, repeated twice) transfected with siC or siCKB. **P = 0.0093 for phosphocreatine and 0.002 for phosphocreatine/creatine ratio. g, Western blot showing the protein levels in mitochondrial and cytoplasmic fractions of human adipocytes transfected with siC, siCKB or siCKMT2 (repeated three times). Creatine kinase activity was determined in paired lysates as indicated in the right panel from one experiment. h, Principal component analysis based on microarray data from human adipocytes (three replicates per condition) transfected with siC or siCKB. Ellipses indicate 95% confidence intervals. i, log2(fold-change) of genes regulated by siCKB in human adipocytes (upper half, from microarray data presented in h). For each gene, the association (Spearman’s rank correlation coefficient ρ value) with CKB expression in WAT transcriptomic data from cohort 2 is shown (lower half). Leading edge genes in the GSEA ‘HALLMARK_INFLAMMATORY _RESPONSE’ pathway identified in Extended Data Fig. 2g are shown. j, CCL2 mRNA expression in human adipocytes (six replicates per condition, repeated three times) transfected with siC or siCKB. ***P = 0.0002. k, CCL2 secretion measured by ELISA from human adipocytes (three replicates per condition, repeated three times) transfected with siC or siCKB. **P = 0.0059. l, Correlation between CCL2 and CKB mRNA levels in human WAT from cohort 2. m, Correlation between CCL2 WAT secretion and CKB mRNA levels in human WAT from cohort 2. In cf, j and k, Student’s two-sided t-test was used. In l and m, standardized β and P values are shown for multiple regression analysis after BMI correction. Data in cf, j and k are shown as mean ± s.e.m. APC, adipocyte progenitor cells; ATM, adipose tissue macrophages; cyto, cytoplasm; Cr, creatine; M1, M1-macrophages; M2, M2-macrophages; mito, mitochondria, PC, principal component; PCr, phosphocreatine. Source data
Fig. 3
Fig. 3. Adipocyte CK-B regulates CCL2 expression by modulating mitochondrial energy production.
a, Normalized OCR determined in human adipocytes transfected with scrambled non-silencing (siC) or CKB-targeting (siCKB) oligonucleotides (12 replicates per condition, repeated three times). Non-mitochondrial respiration was substracted from the basal and maximal respiration is represented in the bar chart. **P = 0.0059, ***P = 0.0008, ****P < 0.0001 (both basal and maximal respiration). O, Oligomycin; F, FCCP; R/A, rotenone/antimycin. b, Mitochondrial ATP production based on Seahorse data in human adipocytes transfected with siC or siCKB (n = five replicates per condition, repeated twice). **P = 0.0078. c, ATP/ADP ratio measured by bioluminescence in human adipocytes transfected with siC or siCKB (nine replicates per condition, repeated twice). ****P < 0.0001. d, Schematic representation of drugs targeting mitochondrial ATP production and/or substrate usage. e, Effect of the mitochondrial inhibitors 1 μM oligomycin (O) or 1 μM bongkrekic acid (B) for 24 h on ATP/ADP ratio in human adipocytes transfected with siC or siCKB. Control wells were treated with dimethyl sulfoxide (DMSO) (D) (five replicates per condition, repeated twice). Overall P = 0.043. f, Same experimental setup as e but displaying CCL2 mRNA expression (four replicates per condition, repeated twice). Overall P = 0.0003. g, Same experimental setup as in e but displaying CCL2 secretion (pg ml−1) detected by ELISA (four replicates per condition, repeated twice). Overall P < 0.0001. Data were analysed by Student’s two-sided t-test in ac and by one-way ANOVA in eg (Tukey’s post-hoc tests indicated by *P < 0.05, **P < 0.01, ***P < 0.001, ****P < 0.0001). Data are shown as mean ± s.e.m. 2DG, 2-deoxy-D-glucose; ANT,adenine nucleotide translocase; a.u., arbitray unit; CPT1, carnitine palmitoyl transferase 1; FA, fatty acid; GLS, glutaminase; MPC1, mitochondrial pyruvate carrier 1.
Fig. 4
Fig. 4. Mitochondrial activation upon CKB downregulation is driven by increased glycolytic activity and glucose uptake.
a, Delta OCR determined by mitochondrial fuel flex test using drugs targeting mitochondrial substrate usage (glycolysis, fatty acid oxidation and glutaminolysis) in human adipocytes transfected with siC or siCKB (three replicates per condition, repeated twice). Overall P = 0.0099. b, Glucose uptake levels in human adipocytes transfected with siC or siCKB (three replicates per condition, repeated twice). *P = 0.023. c, Intracellular levels of glucose, glucose-6-phosphate and lactate in human adipocytes transfected with siC or siCKB (seven replicates per condition). *P = 0.02, 0.049 and 0.02, respectively (from left to right). d. Normalized OCR in human adipocytes transfected with siC or siCKB and incubated with 0.1 mmol l−1 2DG or 10 μmol l−1 of UK5099 (U) or DMSO (D) for 24 h (ten replicates per condition). Overall P < 0.0001. e, Same experimental setup as in d but displaying the effects on ATP/ADP ratio (six replicates per condition). Overall P = 0.0048. f, Same experimental setup as in d but displaying the effects on CCL2 mRNA expression (three replicates per condition, repeated twice). Overall P < 0.0001. g, Same experimental setup as in d but displaying the effects on CCL2 secretion (pg ml−1) (three replicates per condition, repeated twice). Overall P < 0.0001. Data were analysed by Student’s two-sided t-test in b and c, by one-way ANOVA in dg and by two-way ANOVA in a (Tukey’s post-hoc tests indicated by *P < 0.05, **P < 0.01, ***P < 0.001, ****P < 0.0001). Data are shown as mean ± s.e.m. CPM, counts per minute; G6P, glucose-6-phosphate; norm., normalized.
Fig. 5
Fig. 5. Phosphocreatine is taken up by SLC6A8 in white adipocytes and promotes CCL2 production.
a, Human adipocytes were incubated with PBS or different concentrations of phosphocreatine for 24 h and effects on CCL2 mRNA expression were determined (three replicates per condition, repeated twice). Overall P = 0.0021. b, The ratio of phosphocreatine/creatine in human in vitro differentiated adipocytes incubated with PBS or 30 mmol l−1 phosphocreatine for 24 h (three replicates per condition, repeated twice). ***P = 0.0002. c, Same experiments as in a but displaying the ratio of ATP/ADP ratio (four replicates per condition for 0–15 mmol l−1and six replicates per condition for 30 mmol l−1, repeated twice). Overall P = 0.0068. d, Normalized OCR in human adipocytes incubated with 30 mmol l−1 phosphocreatine for 24 h (six replicates per condition, repeated twice). e, Expression of SLC6A8 in human adipocytes transfected with scrambled non-silencing (siC) or SLC6A8-targeting (siSLC6A8) oligonucleotides (four replicates per condition, repeated three times). ****P < 0.0001. f, Phosphocreatine levels in human adipocytes transfected with siC or siSLC6A8, and incubated in the presence or absence of 30 mmol/L phosphocreatine for 24 h (three replicates per condition, repeated twice). Overall P = 0.0028. g, Same experimental setup as in f but displaying the effects on CCL2 mRNA levels (four replicates per condition, repeated twice). Overall P = 0.05. h, Same experimental setup as in f but displaying the effects on CCL2 secretion (three replicates per condition, repeated twice). Overall P = 0.05. Data were analysed by Student’s two-sided t-test in b and e, by one-way ANOVA in a and c and by two-way ANOVA in fh. Tukey’s post-hoc tests indicated by *P < 0.05, **P<0.01. Data are shown as mean ± s.e.m.
Fig. 6
Fig. 6. Perturbation in phosphocreatine metabolism is linked to CCL2 production via effects on AMPK activity.
a, PRKAA1 and PRKAG1 mRNA expression in human adipocytes transfected with siPRKAA1, siPRKAG1 or siC (three replicates per condition, repeated twice). Overall P = 0.005 for PRKAA1 and P < 0.0001 for PRKAG1. b, AMPK, phosphorylated AMPK (pAMPK) and actin levels determined by western blot in human adipocytes transfected with siPRKAA1, siPRKAG1 or siC. The left panel shows representative blots and bar graphs to the right show quantifications of the indicated protein levels (three independent experiments). Overall P = 0.0013. c, Same experimental setup as in a but displaying the effects on CCL2 mRNA levels (three replicates per condition, repeated twice). Overall P = 0.0011. d, Same experimental setup as in a but displaying the effects on CCL2 secretion (three replicates per condition, repeated twice). Overall P = 0.0115. e, AMPK, pAMPK, CK-B and GAPDH determined by western blot in human adipocytes transfected with siC or siCKB. The left panel shows representative blots and bar graphs to the right show quantifications of the indicated protein levels (two replicates per condition, repeated two times). **P = 0.0018. f, AMPK, pAMPK, CK-B and Lamin A/C determined by western blot in human adipocytes transfected with siC or siCKB, after incubation for 24 h with phosphocreatine (30 mmol l−1) or PBS. The left panel shows representative blots and bar graphs to the right show quantifications of the indicated protein levels (quantifications from four independent expirements). **P = 0.0078. g, CCL2 expression in human adipocytes transfected with siC or siCKB, after incubation with vehicle (DMSO) or PF-739 (5 μmol l−1) for 24 h (three replicates per condition, repeated twice). Overall P < 0.0001. Data were analysed by Student’s two-sided t-test in e and f, by one-way ANOVA in panels ad and two-way ANOVA in g. Tukey’s post-hoc tests indicated by *P < 0.05, **P < 0.01, ***P < 0.001, ****P < 0.0001. Data are shown as mean ± s.e.m. Source data
Fig. 7
Fig. 7. HFD and phosphocreatine injections promote WAT inflammation in vivo.
ad, Effect of HFD in male mice aged 10–11 weeks on Ckb mRNA expression (six mice in CD and eight in HFD group). **P=0.0026. (a) and CK-B protein abundance determined by western blot (n = 4 per group). *P=0.041. (b) or immunofluorescence (c) as well as phosphocreatine and creatine levels (n = 4 per group). *P=0.019, **P=0.0063. (d) in pgWAT. Scale bar, 50 μm. e, WAT phosphocreatine levels measured in 12-week-old male mice treated with either PBS or phosphocreatine injections (3 mg g−1, intraperitoneally for 7 days, n = 5 for PBS-injected and n = 6 for phosphocreatine-injected mice). *P = 0.049. f, Transcriptional levels of Ckb and genes encoding pro-inflammatory markers/factors was determined in pgWAT (n = 4 for PBS-injected and n = 3 for phosphocreatine-injected animals) of mice described in e. P = 0.029 for Ccl2 and 0.0024 for Cd68. g, CK-B protein levels in pgWAT of mice injected with PBS or phosphocreatine (n = 4 per group). h, Immunofluorescence of F4/80 (magenta) and Lens culinaris agglutinin (Lectin, grey) in pgWAT of phosphocreatine- and PBS-injected mice. The number of F4/80+ cells was counted in three to four random fields of pgWAT per mouse in four mice. Scale bar, 50 μm. **P = 0.0017. Data were analysed by Student’s two-sided t-test except for b, which was analysed by Student’s one-sided t-test. Data are shown as mean ± s.e.m. Source data
Fig. 8
Fig. 8. Adipocyte-specific Ckb deletion induces WAT phosphocreatine accumulation and inflammation in vivo.
a, Male mice with an adipocyte-specific deletion of Ckb (CkbAdipoq-Cre) and control littermates (Ckbfl/fl) were fed a HFD for 16 weeks starting at four weeks of age. Effects on body weight and glucose tolerance of this cohort have been presented. Ckb gene expression was determined in pgWAT by qPCR (n = 11 mice per group). ****P < 0.0001. b, Representative immunofluorescence microphotographs of pgWAT from CkbAdipoq-Cre and Ckbfl/fl mice. Sections were stained with Lens culiniaris agglutinin (Lectin) and antibodies targeting CK-B. Scale bar, 50 μm. c, Phosphocreatine and creatine levels in pgWAT from CkbAdipoq-Cre (n = 5) and Ckbfl/fl (n = 4) mice. *P = 0.040 for phosphocreatine and 0.045 for phosphocreatine/Cr, respectively. d, mRNA levels for genes encoding inflammatory proteins in pgWAT from CkbAdipoq-Cre and Ckbfl/fl mice (n = 11 per group). P = 0.018 for Ccl2, 0.04 for Adgre1 and 0.05 for Cd68, respectively. e, Same as b but sections were stained with F4/80-targeting antibodies. The number of F4/80+ cells was counted in three to four random fields (n = 4 mice per group). Scale bar, 50 μm. ****P < 0.0001. f, mRNA levels for genes encoding thermogenic markers in pgWAT from CkbAdipoq-Cre and Ckbfl/fl mice (n = 6-11 mice). g, Male mice with a brown adipocyte-specific deletion in Ckb expression (CkbUcp1-CreERT2) and control littermates (Ckbfl/fl) were fed a HFD for 16 weeks. Expression of Ckb and inflammatory genes was determined in pgWAT (n = 5-6 mice per group). Data were analysed by Student’s two-sided t-test. Data are shown as mean ± s.e.m.
Extended Data Fig. 1
Extended Data Fig. 1. CKB expression is regulated by obesity in both women and men.
a. Expression levels of genes encoding proteins in phosphocreatine/creatine metabolism in cohort 3 consisting of 15 women before (OB) and two years after weight loss (WL) induced by bariatric surgery. The WL group was matched by age and body mass index to a group of 15 never-obese subjects (NO). Data are shown as mean ± SEM. Data were analyzed by one-way ANOVA. Overall p-values were <0.0001 for CKB, SLC6A8 and GAMT, 0.010 for CKMT2 and 0.0023 for SLC6A6. Results from Tukey’s post-hoc test are indicated by *p < 0.05, **p < 0.01, ***p < 0.001 and ****p < 0.0001, respectively. b. White adipose tissue expression levels of CKB determined by qPCR in samples obtained from 18 obese and 17 non-obese men (cohort 4). Data are shown as mean ± SEM. *p = 0.021 by Student’s two-sided t-test.
Extended Data Fig. 2
Extended Data Fig. 2. CKB depletion does not affect adipogenesis.
a. Representative immunofluorescence microphotographs of adipocyte progenitors stained with Hoechst and antibodies targeting DPP4. Scale bar=200 μm. b-e. In vitro differentiated human adipocytes were transfected with scrambled non-silencing (siC) or CKB-targeting (siCKB) (three-four replicates/condition). Effects on gene expression of adipogenic/thermogenic markers (experiment repeated twice) (B), adiponectin secretion (five replicates/condition) (C), cellular triglyceride levels (four replicates/condition) (D) and lipid droplet morphology (from experiments in panel D) (E) were determined. Scale bar in panel E = 10 μm. Data in bar charts are shown as mean ± SEM. f. PCr and Cr levels in in vitro differentiated human adipocytes transfected with scrambled non-silencing (siC) or CKMT2-targeting (siCKMT2) oligonucleotides (n = 5 replicates/group). Data are shown as mean ± SEM. *p = 0.024 for PCr and 0.045 for PCr/Cr, respectively by Student’s two-sided t-test. g. Gene set enrichment analysis (GSEA) of genes correlating with CKB expression in human WAT and regulated by siCKB transfection in human in vitro differentiated adipocytes. Hallmark gene sets from MsigDB were used to calculate the enrichment. Details on the analyses are found in the Methods section. The data are presented as dot plots. The color of the dot indicates the normalized enrichment score (NES) for each pathway. The size of the dot represents the negative log10 adjusted p-value for the enrichment of each pathway. h. CKB and CCL2 mRNA levels in in vitro differentiated human adipocytes, derived from a female donor, transfected with siC) or siCKB (four replicates/condition). Data are shown as mean ± SEM. *p = 0.024, ****p < 0.0001 by Student’s two-sided t-test. i. Same experiment as in panel H but displaying CCL2 secretion (four replicates/condition). Data are shown as mean ± SEM.****p < 0.0001 by Student’s two-sided t-test. Abbreviations: Adj. p-val.=adjusted p-value, Cr=creatine, NES = normalized enrichment score, PCr=phosphocreatine, WAT = white adipose tissue.
Extended Data Fig. 3
Extended Data Fig. 3. CKB depletion does not affect mitochondrial content and morphology.
a. Maximal respiration of in vitro differentiated human adipocytes determined by Seahorse Mito stress analysis using 1-2 μmol/L of FCCP, after transfection of the cells with siC or siCKB (12 replicates/condition). Data are shown as mean ± SEM. ****p < 0.0001 by Student’s two-sided t-test. b. ATP/ADP levels in in vitro differentiated human adipocytes transfected with siC or siCKB after 1 hour of incubation with 1.5 μmol/L of FCCP (eight replicates per condition). Data are shown as mean ± SEM. ****p < 0.0001 by Student’s two-sided t-test. c. Quantification of MitotrackerTM red fluorescence intensity in in vitro differentiated human adipocytes transfected with siC or siCKB (four replicates/condition, repeated twice). Data are shown as mean ± SEM. d-e. In vitro differentiated human adipocytes were transfected with siC or siCKB (two replicates per blot). Protein levels of OXPHOS components (D) and TOM20 (mean values) (E) were determined together with CK-B and GAPDH by western blot to estimate mitochondrial abundance. f. Representative immunofluorescence microphotographs of in vitro differentiated adipocytes transfected with siC or siCKB and stained with antibodies targeting TOM20 and Hoechst. Scale bar=50 μm. Abbreviations: ATP5A = Mitochondrial membrane ATP Synthase, AU = arbitrary units, FCCP = Carbonyl cyanide-p-trifluoromethoxyphenylhydrazone, C + = positive control, mitochondrial extract from rat heart supplied with the antibody as a positive control, MTCO1 = Mitochondrially Encoded Cytochrome C Oxidase I, NDUFB8 = NADH:Ubiquinone Oxidoreductase Subunit B8, SDHB = Succinate dehydrogenase B, UQCRC2 = Cytochrome b-c1 complex subunit 2, mitochondrial. Source data
Extended Data Fig. 4
Extended Data Fig. 4. White adipocyte mitochondrial hyperactivity following CKB silencing is not driven by fatty acid oxidation or glutaminolysis.
a-b. CCL2 expression in in vitro differentiated human adipocytes transfected with either siC or siCKB, and treated with 3 μmol/L Etomoxir (fatty acid oxidation inhibitor) (three replicates/condition) (A) or 10 μmol/L BPTES (glutaminolysis inhibitor) (four replicates per condition) (B). Control cells were treated with DMSO. Data are shown as mean ± SEM. Overall p < 0.0001 for panel A and 0.028 for panel B by one-way ANOVA. Results from Tukey’s post-hoc test are indicated by *p < 0.05, ***<0.001 and ****p < 0.0001, respectively. Abbreviations: BPTES = Bis-2-(5-phenylacetamido-1,3,4-thiadiazol-2-yl)ethyl sulfide, DMSO = dimethyl sulfoxide.
Extended Data Fig. 5
Extended Data Fig. 5. Differential effects of creatine and phosphocreatine in human white adipocytes.
a. Effect of creatine on OCR by Mito Stress test in in vitro human adipocytes transfected with either siC or siCKB incubated with or without creatine (20 mmol/L) (six replicates/condition) for 24 hours. Data are shown as mean ± SEM. *p = 0.029 and **p = 0.0012 by one-way ANOVA. b. ATP/ADP levels in in vitro differentiated human adipocytes incubated with creatine (7.5–30 mmol/L) for 24 hours (four replicates/condition). Data are shown as mean ± SEM. c. Same experimental setup as panel B but displaying CCL2 expression (four to five replicates/condition, experiment repeated twice). Data are shown as mean ± SEM. d. In vitro differentiated human adipocytes transfected with either siC or siCKB were incubated with or without phosphocreatine (30 mM) for 24 hours and the effects on OCR were determined by Mito Stress test (six replicates/condition, experiment repeated twice). Data are shown as mean ± SEM. p = 0.007 and 0.0004 for basal and maximal respiration by two-way ANOVA. e. ATP/ADP levels in in vitro differentiated human adipocytes transfected with either siC or siCKB, incubated with phosphocreatine (30 mmol/L) for 24 hours (siC = five replicates, siC + PCr=six replicates, siCKB = seven replicates, siCKB + PCr=six replicates). Data are shown as mean ± SEM. Overall p = 0.0004 by two-way ANOVA. Results from Tukey’s post-hoc test are indicated by **p < 0.01, ***p < 0.001, respectively. f. Same experimental setup as panel E but displaying CCL2 expression (siC = three replicates, siC + PCr=four replicates, siCKB = three replicates, siCKB + PCr=four replicates, experiment repeated twice). Data are shown as mean ± SEM. Overall p < 0.0001 by two-way ANOVA. Results from Tukey’s post-hoc test are indicated by ****p < 0.001. Abbreviations: AU = arbitrary unit, Cr=creatine, OCR = oxygen consumption rate, PCr=phosphocreatine.
Extended Data Fig. 6
Extended Data Fig. 6. AMPK regulates CCL2 expression.
a. In vitro differentiated human adipocytes were incubated with DMSO or the AMPK activator PF-739 (n = 4). AMPK, phosphorylated AMPK (pAMPK), CK-B and actin levels were determined by western blot (in duplicates per blot). Left panel shows representative blots and bar graphs and to the right show quantifications of the indicated protein levels (four replicates/condition). Data are shown as mean ± SEM. **p = 0.0087 by Student’s two-sided t-test. b. CCL2 mRNA expression in in vitro differentiated human adipocytes following incubation with DMSO (control), TNFα, PF-739 or both TNFα and PF-739 for 24 hours (three replicates/condition). Data are shown as mean ± SEM. Overall p < 0.0001 by two-way ANOVA. Results from Tukey’s post-hoc test are indicated by *p < 0.05, ****p < 0.0001, respectively. c-d. AMPK, phosphorylated AMPK (pAMPK), CK-B and tubulin protein levels (C) as well as CCL2 expression (D) were determined in human in vitro differentiated adipocytes transfected with siC or siCKB, after incubation for 24 hours with DMSO or the AMPK activators AICAR and metformin (3 replicates/condition, experiment repeated twice). Data are shown as mean ± SEM. Overall p = 0.0001 by one-way ANOVA. Results from Tukey’s post-hoc test are indicated by **p < 0.01, ***p < 0.001, ****p < 0.0001, respectively. e-f. CCL2 gene expression and secretion were determined in human in vitro differentiated adipocytes transfected with siC or siCKB (four replicates/condition) from a different vendor (Qiagen). Data are shown as mean ± SEM. *p = 0.011, ****p < 0.0001 by Student’s two-sided t-test. g. Same experimental setup as panels E-F but displaying phosphocreatine/creatine levels. Data are shown as mean ± SEM. *p = 0.012 by Student’s two-sided t-test. h. Same experimental setup as panels E-F but showing representative western blots of phosphorylated AMPK (pAMPK), AMPK, CK-B and actin (two replicates/condition loaded per blot). Abbreviations: AICAR = 5-aminoimidazole-4-carboxamide riboside, AU = arbitrary unit, Cr=creatine, PCr=phosphocreatine. Source data
Extended Data Fig. 7
Extended Data Fig. 7. Additional data from murine models.
a. Expression of phosphocreatine/creatine-related genes in mouse WAT was extracted from single-nucleus RNA sequencing data published by Sárvári et al34. b-c. Wild-type male mice were fed chow (CD) or high fat diet (HFD) for 5 weeks. Effects on body weight (four mice/condition) (B) and pgWAT and iWAT weights (four mice for CD and eight mice for HFD) (C) were determined. Data are shown as mean ± SEM. **p = 0.0034 for pgWAT and 0.0016 for iWAT, respectively, ****p < 0.0001 by Student’s two-sided t-test. d. Same experimental setup as in panels B-C but displaying effects on glucose tolerance by intraperitoneal glucose tolerance tests (four mice/group). The area under the curve (AUC) is displayed in the right panel. Data are shown as mean ± SEM. *p = 0.041 by Student’s two-sided t-test. e. Same experimental setup as in panels B-C but displaying effects on the expression of genes encoding pro-inflammatory markers/factors in pgWAT (four mice for CD and eight mice for HFD). Data are shown as mean ± SEM. p = 0.049 for Ccl2, 0.002 for Adgre1 and 0.023 for Cd68, respectively by Student’s two-sided t-test. f. Representative immunofluorescence microphotographs of F4/80 (magenta) and Lens culinaris agglutinin (Lectin, gray) in pgWAT of HFD and CD mice. The number of F4/80+ cells was counted in 4 random fields (n = 4 mice/group). Scale bar=50 μm. Data are shown as mean ± SEM. **p = 0.0039, by Student’s two-sided t-test. g-j. Male mice on chow diet were injected intraperitoneally with PBS or phosphocreatine (3 mg/g) for seven days (n = 4 mice/group). Effects on body weight (G), pgWAT and iWAT weights (H) and circulating glucose (I) as well as insulin (J) levels were determined. Data are shown as mean ± SEM. Abbreviations: AUC = area under the curve, CD = chow diet, Endo=endothelial, Epid=Edipidymal, FAP = fibro-adipogenic progenitor, HFD = high fat diet, Imm=immune, iWAT=inguinal WAT, MA = mature adipocytes, Meso=mesothelial, PCr=phosphocreatine, pgWAT=perigonadal WAT, Sper=spermatozoa.

Comment in

References

    1. Rosen ED, Spiegelman BM. What we talk about when we talk about fat. Cell. 2014;156:20–44. - PMC - PubMed
    1. Mejhert N, Ryden M. Novel aspects on the role of white adipose tissue in type 2 diabetes. Curr. Opin. Pharmacol. 2020;55:47–52. - PubMed
    1. Hotamisligil GS. Inflammation, metaflammation and immunometabolic disorders. Nature. 2017;542:177–185. - PubMed
    1. Crewe C, An YA, Scherer PE. The ominous triad of adipose tissue dysfunction: inflammation, fibrosis, and impaired angiogenesis. J. Clin. Invest. 2017;127:74–82. - PMC - PubMed
    1. Reilly SM, Saltiel AR. Adapting to obesity with adipose tissue inflammation. Nat. Rev. Endocrinol. 2017;13:633–643. - PubMed

Publication types