. 2022 May;28(5):1072-1082.
doi: 10.1038/s41591-022-01721-6. Epub 2022 Feb 14.

Antibody responses and correlates of protection in the general population after two doses of the ChAdOx1 or BNT162b2 vaccines

Collaborators, Affiliations

Antibody responses and correlates of protection in the general population after two doses of the ChAdOx1 or BNT162b2 vaccines

Jia Wei et al. Nat Med. 2022 May.

Abstract

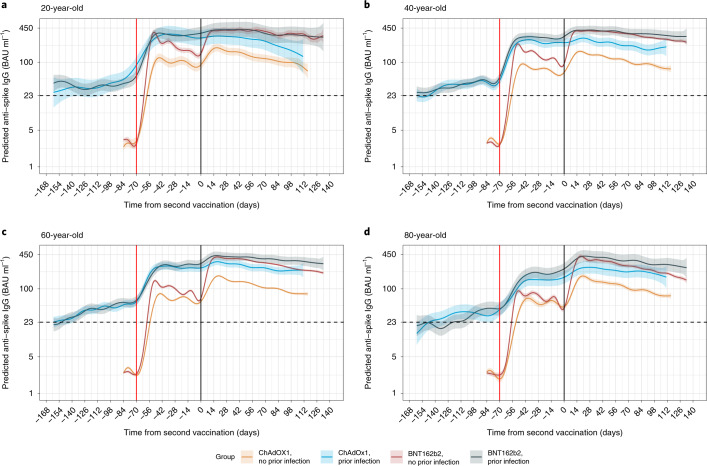
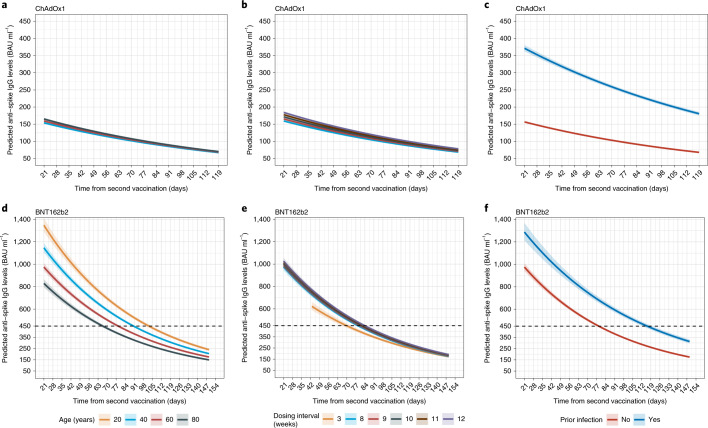
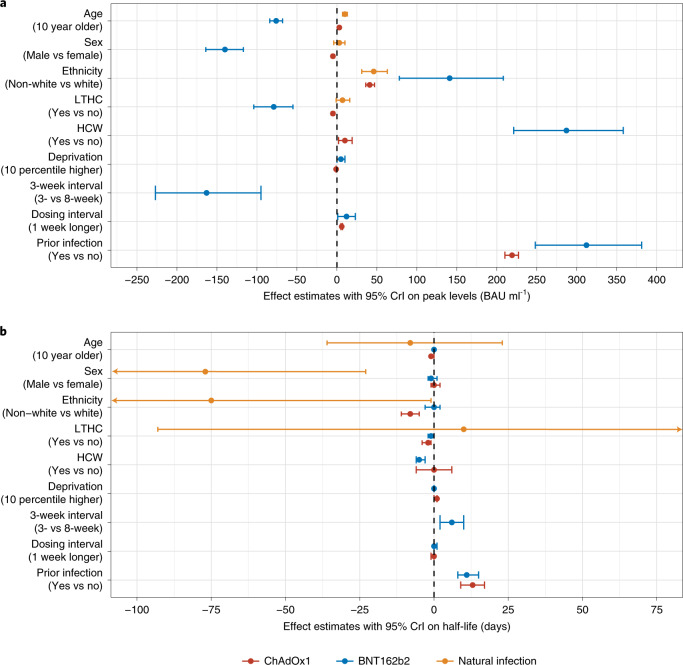
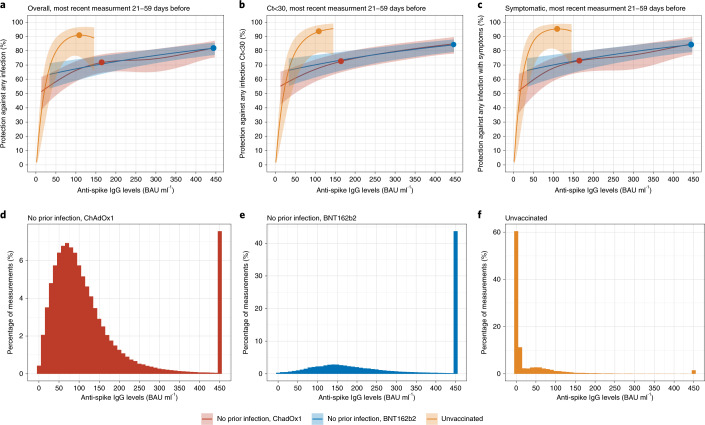
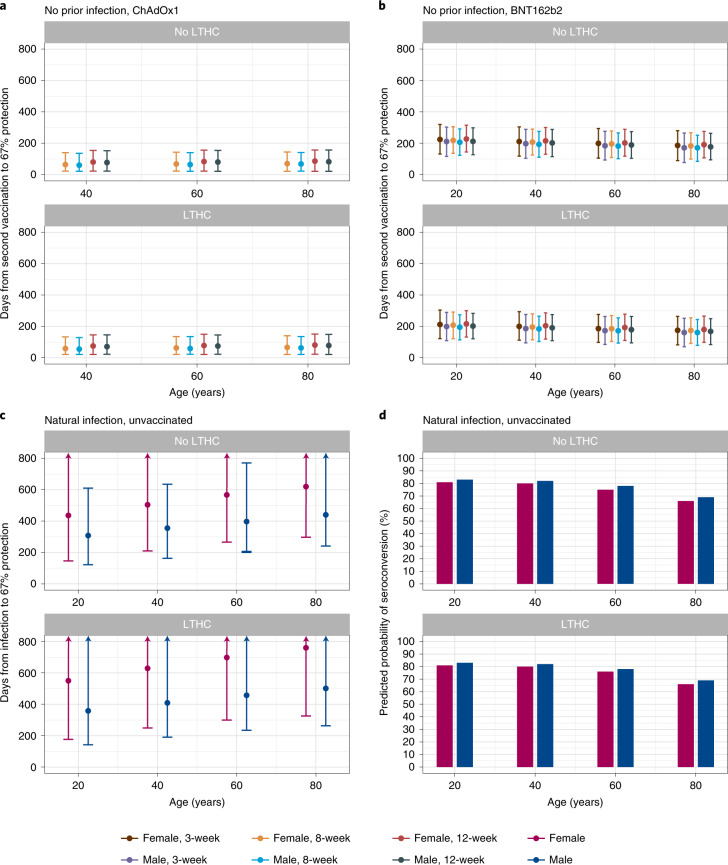
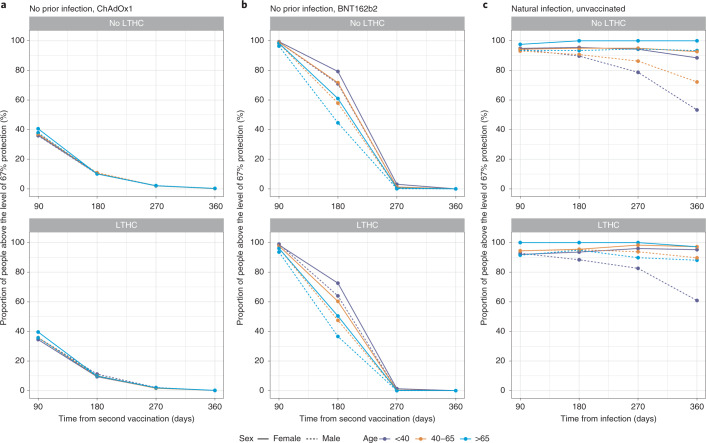
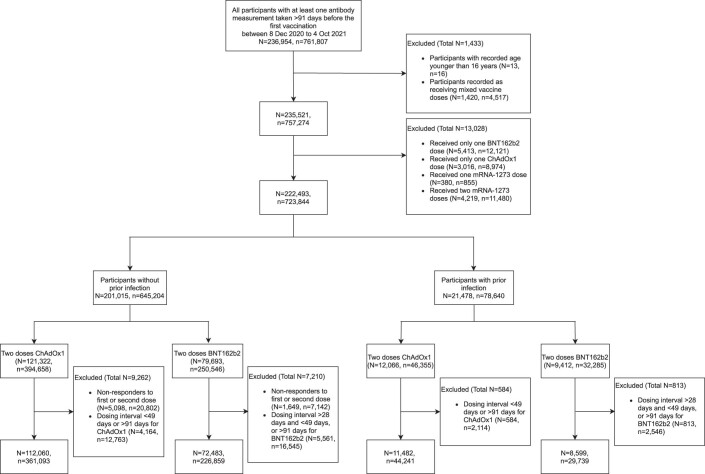
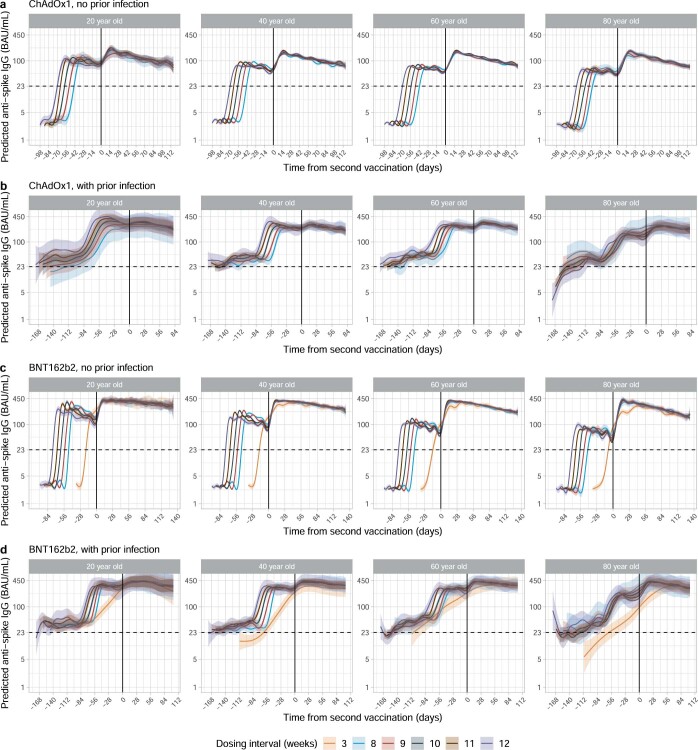
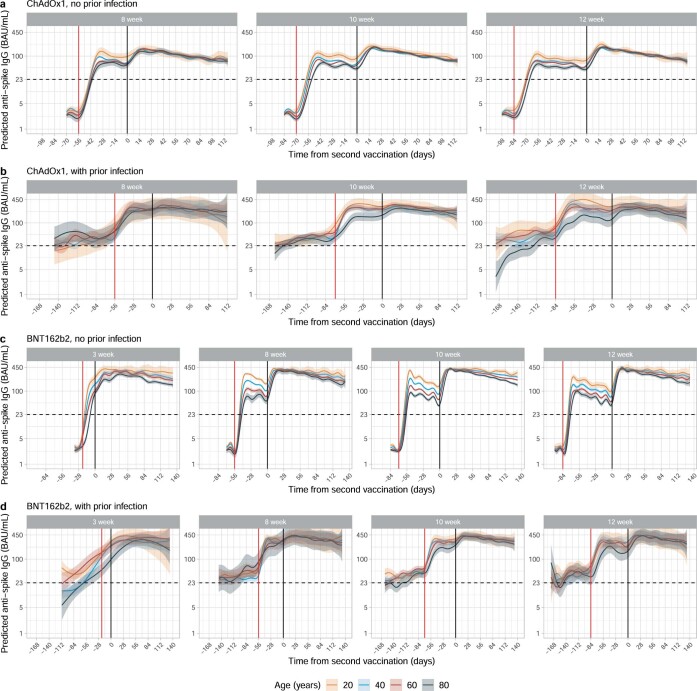
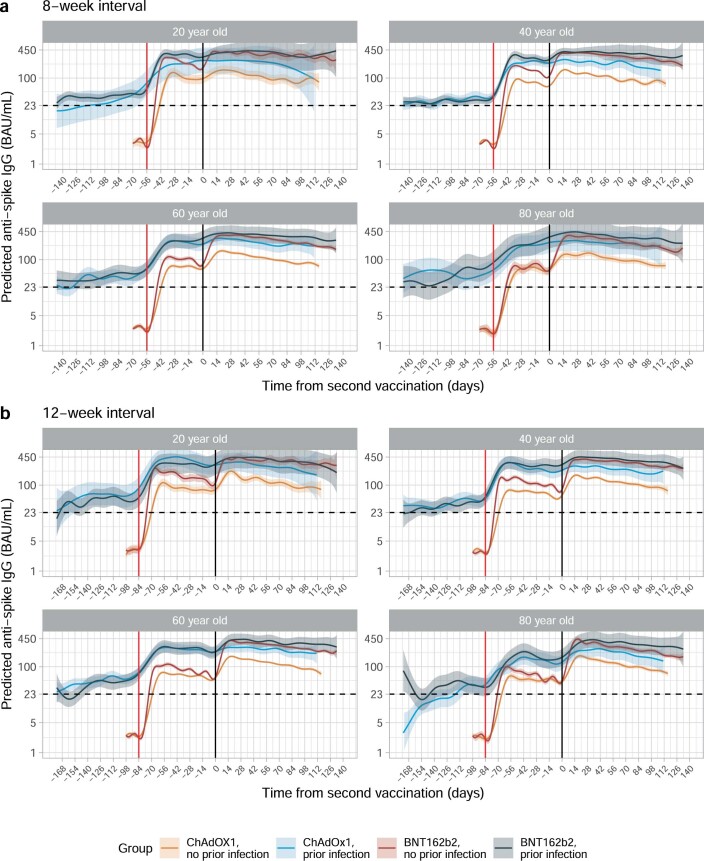
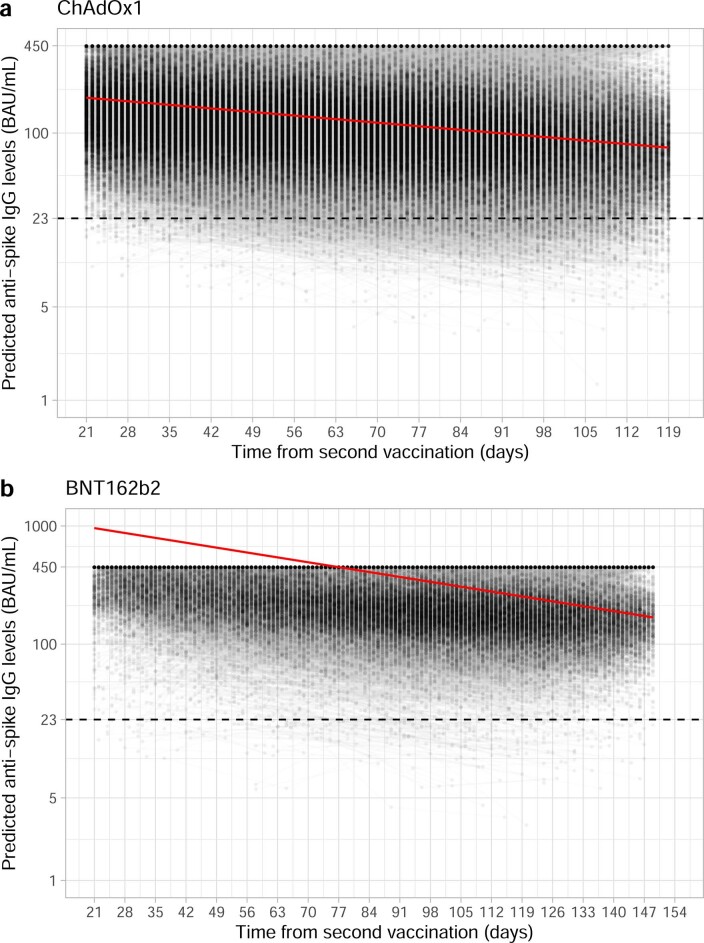
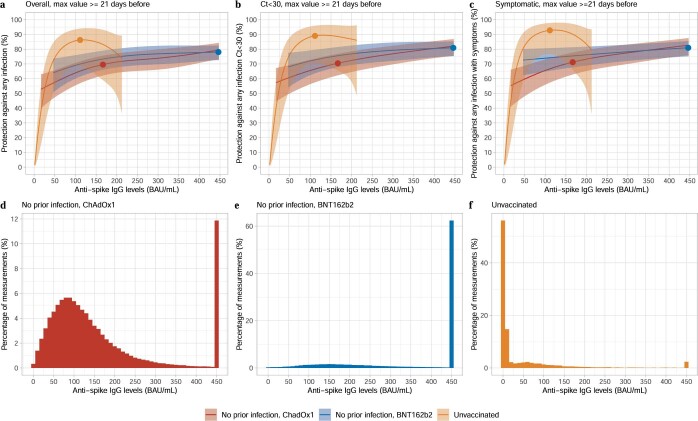
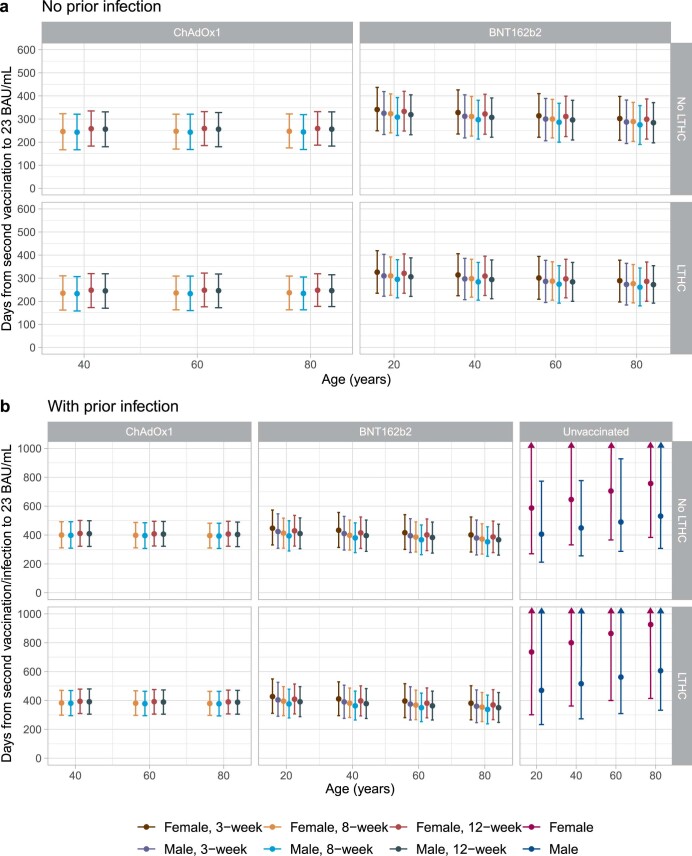
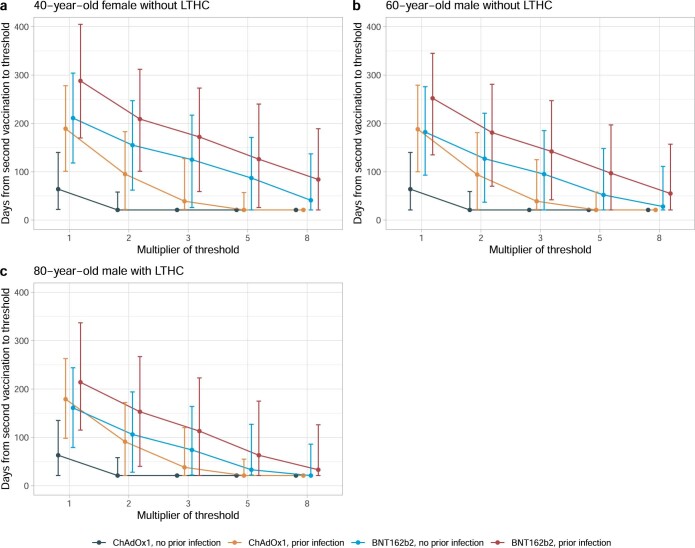
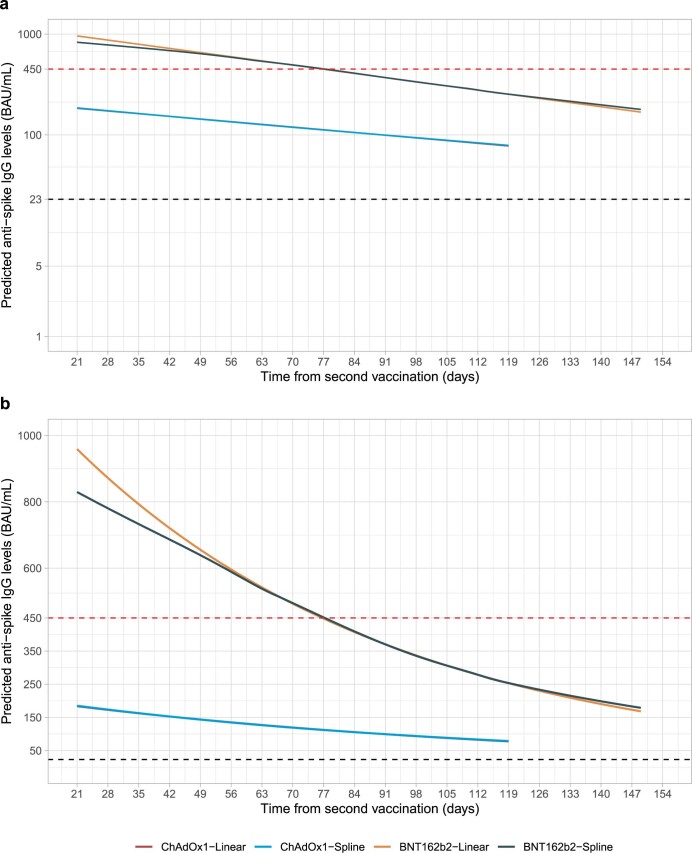
Antibody responses are an important part of immunity after Coronavirus Disease 2019 (COVID-19) vaccination. However, antibody trajectories and the associated duration of protection after a second vaccine dose remain unclear. In this study, we investigated anti-spike IgG antibody responses and correlates of protection after second doses of ChAdOx1 or BNT162b2 vaccines for severe acute respiratory syndrome coronavirus 2 (SARS-CoV-2) in the United Kingdom general population. In 222,493 individuals, we found significant boosting of anti-spike IgG by the second doses of both vaccines in all ages and using different dosing intervals, including the 3-week interval for BNT162b2. After second vaccination, BNT162b2 generated higher peak levels than ChAdOX1. Older individuals and males had lower peak levels with BNT162b2 but not ChAdOx1, whereas declines were similar across ages and sexes with ChAdOX1 or BNT162b2. Prior infection significantly increased antibody peak level and half-life with both vaccines. Anti-spike IgG levels were associated with protection from infection after vaccination and, to an even greater degree, after prior infection. At least 67% protection against infection was estimated to last for 2-3 months after two ChAdOx1 doses, for 5-8 months after two BNT162b2 doses in those without prior infection and for 1-2 years for those unvaccinated after natural infection. A third booster dose might be needed, prioritized to ChAdOx1 recipients and those more clinically vulnerable.


Conflict of interest statement

D.W.E. declares lecture fees from Gilead, outside the submitted work. No other author has a conflict of interest to declare.

Figures

Fig. 1
Fig. 1. Predicted mean anti-spike IgG levels in participants with 10-week dosing interval by time from second vaccination according to vaccine type, age and prior infection status using GAMs adjusted for age and dosing interval.
a, 20-year-old. b, 40-year-old. c, 60-year-old. d, 80-year-old. Predicted levels are plotted on a log scale. Black dotted line indicates the threshold of IgG positivity (23 BAU ml−1); red solid line indicates the first vaccination; black solid line indicates the second vaccination. Line color indicates response predicted for ChAdOx1 and BNT162b2, with or without prior infection. See Extended Data Fig. 3 for a re-plotted version of the same estimates to allow comparison by age for each vaccine type and prior infection status. See Extended Data Fig. 4 for 8-week and 12-week dosing intervals. The 95% CIs are calculated by prediction ± 1.96 × standard error of the prediction. Source data
Fig. 2
Fig. 2. Posterior predicted mean trajectories (95% CrI) of anti-spike IgG levels from 21 days after the second dose using Bayesian linear mixed interval censored models.
Models are adjusted for age, sex, ethnicity, long-term health conditions, healthcare role, deprivation, dosing interval and prior infection status. a,d, Trajectories by age. b,e, Trajectories by dosing interval. c,f, Trajectories by prior infection status. ac, Participants who received two doses of ChAdOx1. df, Participants who received two doses of BNT162b2. Black dotted line shows the upper quantification limit of 450 BAU ml−1. For BNT162b2, as 52% of measurements were above the upper limit, the estimated peak levels were higher than 450 BAU ml−1 (interval censoring accounted for in analysis). Plotted at reference categories: 60 years, female, white ethnicity, not reporting a long-term health condition, not a healthcare worker, deprivation percentile of 60, 8-week dosing interval and no prior infection. In a, 20-year-old group is not plotted because the vast majority of those receiving ChAdOx1 were 40 years of age or older. These model estimates more completely adjust for confounders than the GAMs plotted in Extended Data Fig. 2 but estimate trends only after second vaccination. Source data
Fig. 3
Fig. 3. Comparison of effects of factors in participants who received two doses of ChAdOx1 or BNT162b2 or had natural SARS-CoV-2 infection.
a, Effects on anti-spike IgG peak levels. b, Effects on anti-spike IgG half-lives. In total, 100,639 participants received two doses of ChAdOx1; 55,053 participants received two doses of BNT162b2; and 3,271 had natural infection. Mean estimates with 95% CrIs are presented. In b, 95% CrIs are truncated at −100 and 75 days for visualization. Source data
Fig. 4
Fig. 4. Association between anti-spike IgG levels and protection from SARS-CoV-2 infection using the most recent antibody measurement obtained 21–59 days before the current visit.
a, Protection against any infection. b, Protection against infection with a moderate to high viral load (Ct value < 30). c, Protection against infection with self-reported symptoms. The 95% CIs are calculated by prediction ± 1.96 × standard error of the prediction. Three groups are investigated: unvaccinated participants with or without evidence of prior infection, participants vaccinated with ChAdOx1 without evidence of prior infection and participants vaccinated with BNT162b2 without evidence of prior infection. Dots represent the median predicted individual peak levels from the Bayesian linear mixed models: 1,026 BAU ml−1 for BNT162b2 (plotted at the upper quantification limit of 450 BAU ml−1); 167 BAU ml−1 for ChAdOx1; and 111 BAU ml−1 for unvaccinated participants. Distribution of the most recent anti-spike IgG measurements for the three population groups are shown in df. See Supplementary Fig. 4 and Supplementary Table 5 for timing of visits relative to first vaccination. Source data
Fig. 5
Fig. 5. Posterior predicted mean days (95% CrI) from the second vaccination/infection to the threshold level associated with 67% protection.
The threshold level is 107 BAU ml−1 for ChAdOx1, 94 BAU ml−1 for BNT162b2 and 33 BAU ml−1 for unvaccinated. a, In participants without prior infection and vaccinated with ChAdOX1 (n = 92,584). b, In participants without prior infection and vaccinated with BNT162b2 (n = 51,034). c, In unvaccinated participants who had natural infection (n = 3,271). d, Predicted probability of seroconverting in unvaccinated participants who had natural infection, based on a previous model on seroconversion. Estimates were separated by age, sex, dosing interval, long-term health condition (LTHC) and vaccine type for vaccinated people and by age, sex and LTHC for unvaccinated people. y axis is truncated at 800 days for visualization. For ChAdOx1, 20-year-old group is not plotted because the vast majority of those receiving ChAdOx1 were 40 years of age or older. ac are conditional on participants having antibody response/seroconverting (see the ‘Vaccine non-responders’ section for ChAdOx1 and BNT162b2 and discussion in a previous publication for unvaccinated individuals). Source data
Fig. 6
Fig. 6. Proportion of participants above the threshold level associated with 67% protection by time from second vaccination/infection.
The threshold level is 107 BAU ml−1 for ChAdOx1, 94 BAU ml−1 for BNT162b2 and 33 BAU ml−1 for unvaccinated. a, In participants without prior infection and vaccinated with ChAdOX1. b, In participants without prior infection and vaccinated with BNT162b2. c, In participants who had natural infection and unvaccinated. Estimates were separated by age, sex and long-term health condition (LTHC). Numbers of participants in each panel are in the order of no-LTHC and LTHC; numbers in brackets represent <40, 40–65 and >65: a, n = 72,121 [4,973, 46,160, 20,988] and 28,518 [2,166, 14,315, 12,037]; b, n = 36,662 [6,650, 14,108, 15,904] and 18,391 [1,800, 6,696, 9,895]; c, n = 2,625 [1,207, 1,243, 175] and 646 [194, 322, 130]. All panels are conditional on participants having antibody response/seroconverting (see the ‘Vaccine non-responders’ section for ChAdOx1 and BNT162b2 and discussion in a previous publication for unvaccinated individuals). Source data
Extended Data Fig. 1
Extended Data Fig. 1. Flowchart of the study cohort.
N represents the number of participants, and n represents the number of antibody measurements.
Extended Data Fig. 2
Extended Data Fig. 2. Mean anti-spike IgG levels by time from second vaccination in 20-, 40-, 60- and 80-year-olds according to dosing interval using generalised additive models adjusted for age and dosing interval.
a, Participants who received two doses of ChAdOx1 without prior infection. b, Participants who received two doses of ChAdOx1 with prior infection. c, Participants who received two doses of BNT162b2 without prior infection. d, Participants who received two doses of BNT162b2 with prior infection. Different x axis scales reflect different durations of follow-up post-vaccination in the different cohorts. Predicted levels are plotted on a log scale. Black dotted line indicates the threshold of IgG positivity (23 BAU/mL). Black solid line indicates the second vaccination date. Line colour indicates response predicted for 3 weeks, 8–12 weeks dosing interval. The 95% CIs are calculated by prediction ± 1.96 × standard error of the prediction. Source data
Extended Data Fig. 3
Extended Data Fig. 3. Mean anti-spike IgG levels by time from second vaccination in 3-, 8-, 10-, and 12-week dosing interval groups according to age using generalised additive models adjusted for age and dosing interval.
a, Participants who received two doses of ChAdOx1 without prior infection. b, Participants who received two doses of ChAdOx1 with prior infection. c, Participants who received two doses of BNT162b2 without prior infection. d, Participants who received two doses of BNT162b2 with prior infection. Different x axis scales reflect different durations of follow-up post-vaccination in the different cohorts. Predicted levels are plotted on a log scale. Black dotted line indicates the threshold of IgG positivity (23 BAU/mL). Red solid line indicates the first vaccination and black solid line indicates the second vaccination. Line colour indicates response predicted for age 20, 40, 60, and 80 years. The 95% CIs are calculated by prediction ± 1.96 × standard error of the prediction. Source data
Extended Data Fig. 4
Extended Data Fig. 4. Mean anti-spike IgG levels by time from second vaccination according to vaccine type, prior infection status, and age using generalised additive models adjusted for age and dosing interval.
a, Participants with a 8-week dosing interval. b, Participants with a 12-week dosing interval. Predicted levels are plotted on a log scale. Black dotted line indicates the threshold of IgG positivity (23 BAU/mL). Red solid line indicates the first vaccination and black solid line indicates the second vaccination. Line colour indicates response predicted for ChAdOx1 and BNT162b2, with or without prior infection. The 95% CIs are calculated by prediction ± 1.96 × standard error of the prediction. Source data
Extended Data Fig. 5
Extended Data Fig. 5. Estimated unadjusted mean trajectory of anti-spike IgG antibody levels and individual trajectories from 21 days after the second vaccination.
a, In participants who received two doses of ChAdOx1. b, In participants who received two doses of BNT162b2. Black dashed line indicates the assay threshold for IgG positivity (23 BAU/mL). For BNT162b2, interval censored regression takes account of the fact that 52% measurements were above the upper quantification limit of 450 BAU/mL, and the timing of these measurements, so the estimated peak levels were higher than 450 BAU/mL. Source data
Extended Data Fig. 6
Extended Data Fig. 6. Association between anti-spike IgG levels and protection from SARS-CoV-2 infection using the maximum antibody measurement obtained ≥21 days prior to the visit.
a, protection against any infection; b, protection against infection with a moderate to high viral load (Ct value <30); c, protection against infection with self-reported symptoms. The 95% CIs are calculated by prediction ± 1.96 × standard error of the prediction. Three groups are investigated, unvaccinated participants with or without evidence of prior infection, participants vaccinated with ChAdOx1 without evidence of prior infection, and participants vaccinated with BNT162b2 without evidence of prior infection. Dots represent the median predicted individual peak levels from the Bayesian linear mixed models: 1026 BAU/mL for BNT162b2 (plotted at the upper quantification limit of 450 BAU/mL), 167 BAU/mL for ChAdOx1, and 111 BAU/mL for unvaccinated participants. Distribution of the maximum anti-spike IgG measurements for the three population groups are shown in panel d, e, f. See Supplementary Fig. 4 and Supplementary Table 5 for timing of visits relative to second vaccination. Source data
Extended Data Fig. 7
Extended Data Fig. 7. Posterior predicted mean days (95% credible interval) from the second vaccination/infection to the positivity threshold of 23 BAU/mL.
a, In those without evidence of prior infection, 92,584 participants vaccinated with ChAdOx1, 51,034 participants vaccinated with BNT162b2. b, In those with evidence of prior infection, 8,055 vaccinated with ChAdOx1, 4,019 vaccinated with BNT162b2, 3,271 had natural infection and unvaccinated. Estimates were separated by age, sex, dosing interval, long-term health condition (LTHC), and vaccine type for vaccinated people, and by age, sex, and LTHC for unvaccinated people. y-axis is truncated at 1000 days (panel b) for visualisation. For ChAdOx1, 20-year-old group is not plotted because the vast majority of those receiving ChAdOx1 were ≥40 years. Estimates for the unvaccinated group in panel b are based on a previously reported biphasic model assuming the rate of antibody decline slowing over time, which may explain the longer point estimates vs ChAdOx1 or BNT162b2, however credible intervals also overlap. Source data
Extended Data Fig. 8
Extended Data Fig. 8. Posterior predicted days (95% credible interval) from the second vaccination to the threshold level associated with 67% protection multiplied by 2, 3, 5, 8, according to prior infection status and vaccine type.
The threshold level is 107 BAU/mL for ChAdOx1 and 94 BAU/mL for BNT162b2. a, in a 40-year-old female without long-term health conditions. b, in a 60-year-old male without long-term health conditions. c, in an 80-year-old male with long-term health conditions. Estimates are based on 100,639 participants vaccinated with ChAdOx1 and 55,053 participants vaccinated with BNT162b2. All three panels were plotted at an 8-week dosing interval. LTHC: long-term health condition. Multipliers reflect the fact that higher antibody level may be required for protection against variants of concern. Source data
Extended Data Fig. 9
Extended Data Fig. 9. Correlation plots of anti-spike IgG levels.
a, Correlation between anti-spike IgG levels (BAU/mL) and neutralisation titres in 37 samples. Samples were obtained from the National Institute for Biological Standards and Control (NIBSC, Potters Bar, UK) Anti-SARSCoV-2 Verification Panel for Serology Assays (NIBSC code: 20/B770). b, Correlation between anti-spike IgG levels in mAb45 units (ng/ml) and WHO international units (BAU/mL) in 63 dilution replicates. Source data
Extended Data Fig. 10
Extended Data Fig. 10. Comparison of linear exponential model with spline-based model in examining non-linearity of antibody decline.
a, Plotted in log10 scale. b, Plotted in original scale. The estimated trajectory from the spline model (with 4 knots placed at 10th, 40th, 60th, and 90th of observed time points) is similar with the linear exponential model for both ChAdOx1 and BNT162b2, indicating that there was no evidence of antibody decline flattening. Linear models provided better fit. Black dotted line shows the positivity threshold of 23 BAU/mL. Red dotted line shows the upper quantification limit of 450 BAU/mL. Source data

References

    1. Medicines and Healthcare products Regulatory Agency. Regulatory approval of Pfizer/BioNTech vaccine for COVID-19. https://www.gov.uk/government/publications/regulatory-approval-of-pfizer... (2020).
    1. Medicines and Healthcare products Regulatory Agency. Oxford University/AstraZeneca COVID-19 vaccine approved. https://www.gov.uk/government/news/oxford-universityastrazeneca-covid-19... (2020).
    1. Department of Health and Social Care. UK COVID-19 vaccines delivery plan. https://www.gov.uk/government/publications/uk-covid-19-vaccines-delivery... (2021).
    1. Vaccinations in United Kingdom. https://coronavirus.data.gov.uk/details/vaccinations (2021).
    1. Department of Health and Social Care. Prioritising the first COVID-19 vaccine dose: JCVI statement. https://www.gov.uk/government/publications/prioritising-the-first-covid-... (2021).

Publication types