

Pathological, Morphometric and Correlation Analysis of the Modified Mankin Score, Tidemark Roughness and Calcified Cartilage Thickness in Rat Knee Osteoarthritis after Extracorporeal Shockwave Therapy
- PMID: 35165510
- PMCID: PMC8795810
- DOI: 10.7150/ijms.67741
Pathological, Morphometric and Correlation Analysis of the Modified Mankin Score, Tidemark Roughness and Calcified Cartilage Thickness in Rat Knee Osteoarthritis after Extracorporeal Shockwave Therapy
Abstract
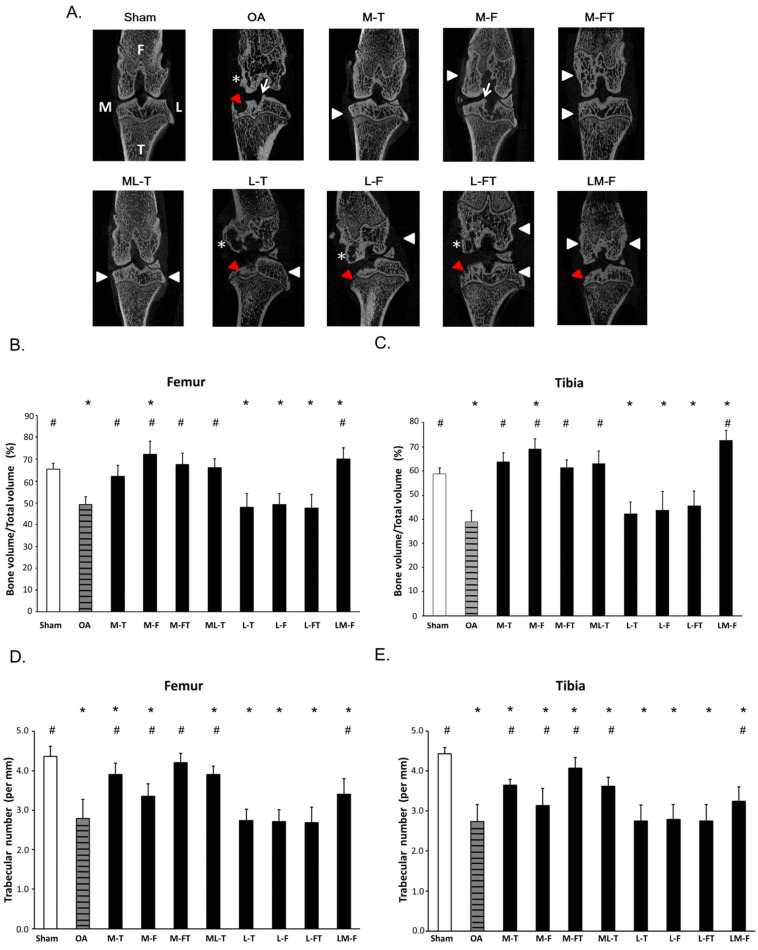
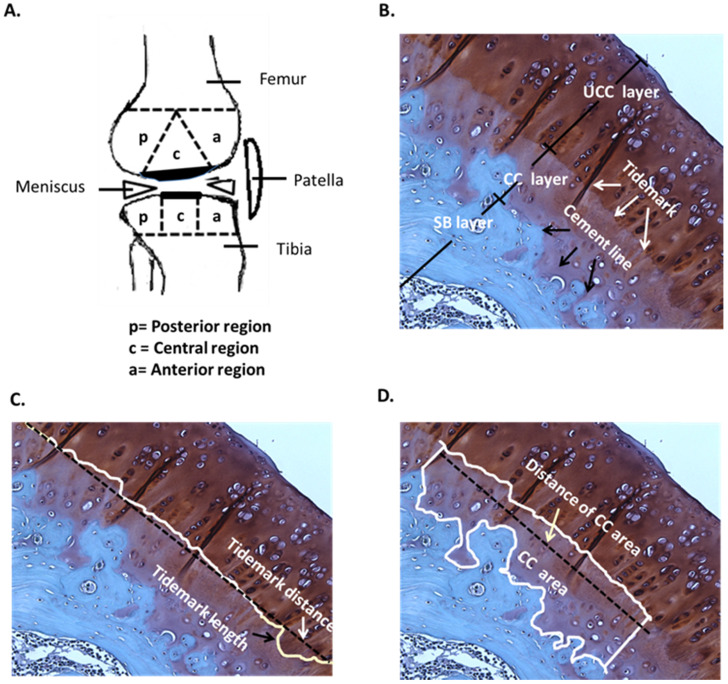
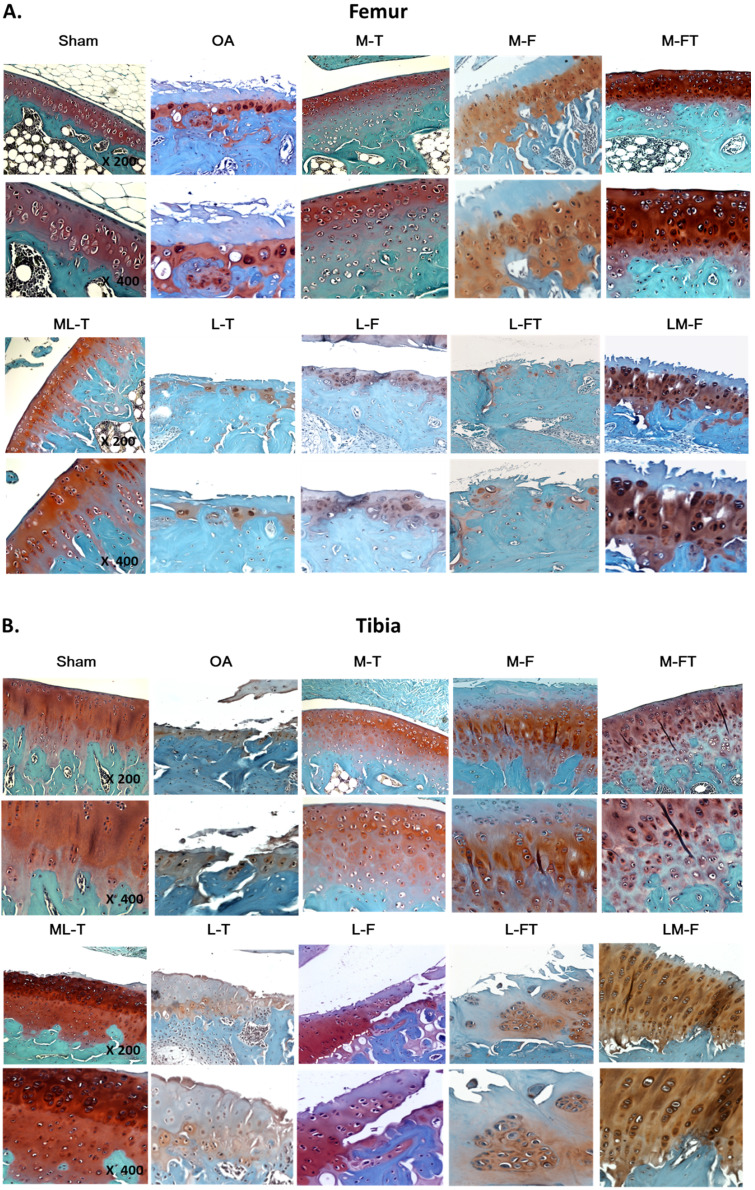
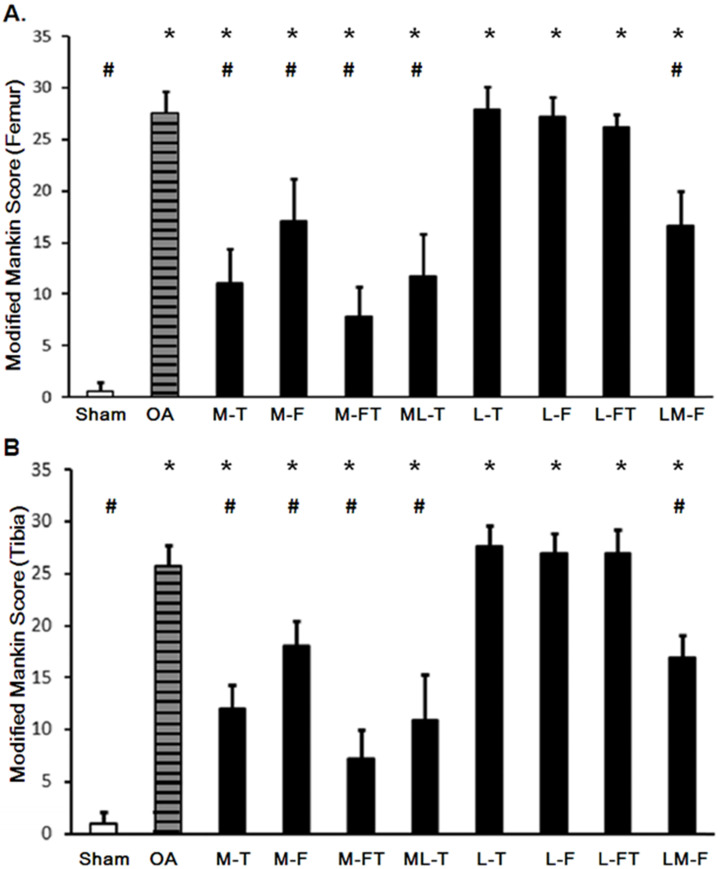
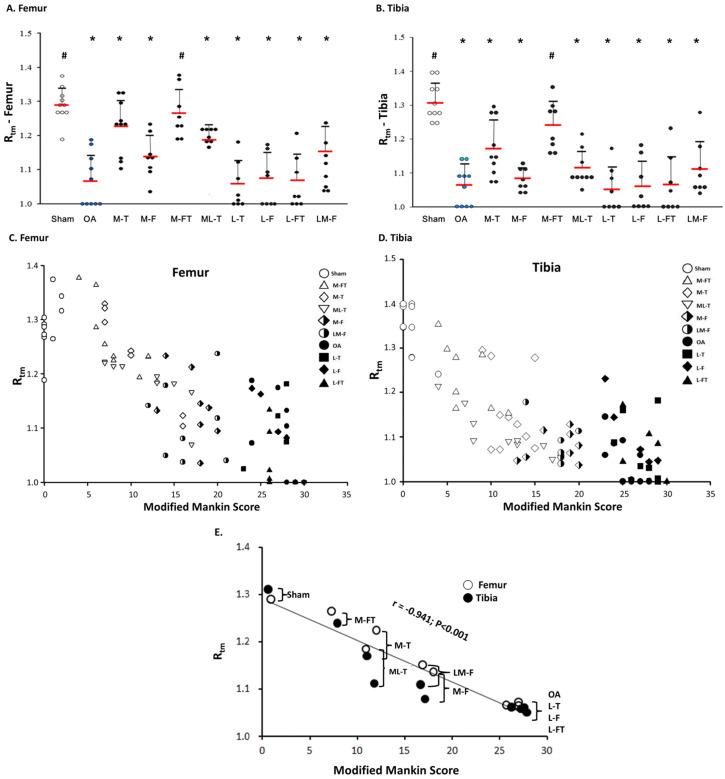
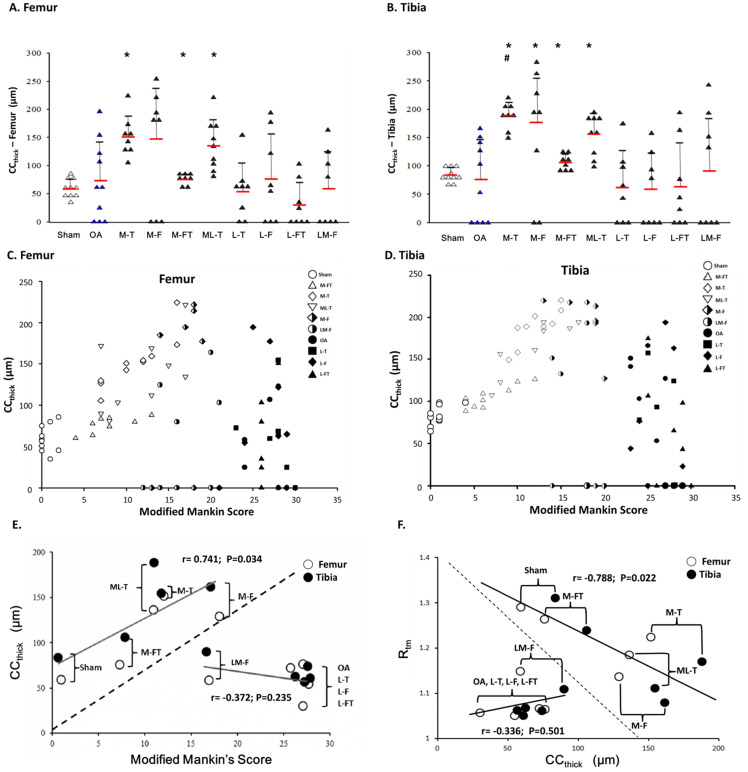
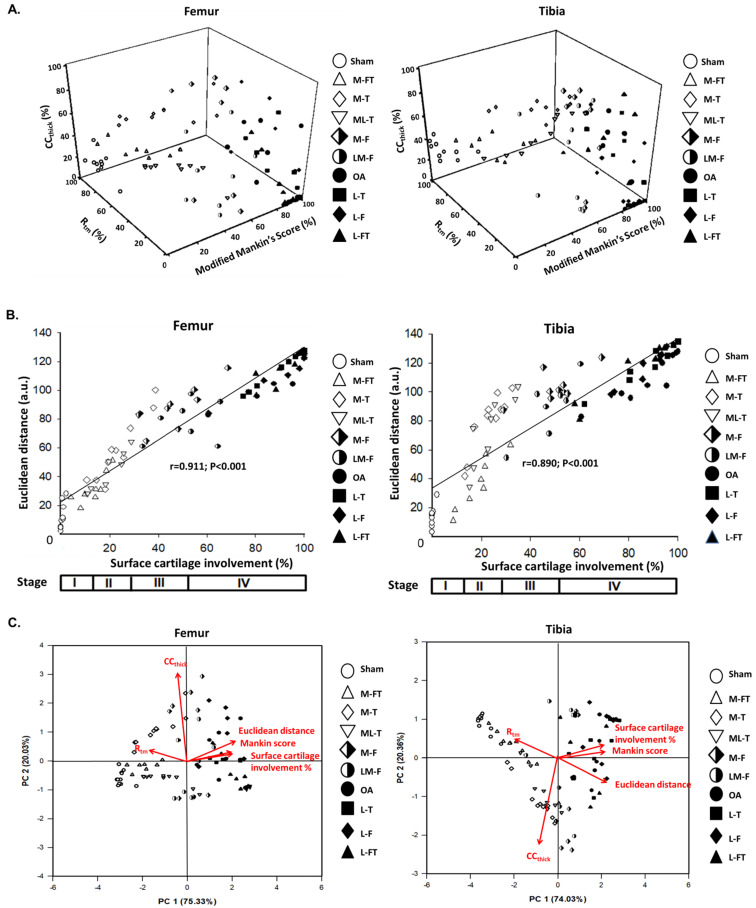
The paper displayed the pathological changes and relationships of the modified Mankin score, tidemark roughness and calcified cartilage (CC) thickness by extracorporeal shockwave therapy (ESWT) (0.25 mJ/ mm2 with 800 impulses) on different positions of the medial and lateral rat knee OA joint. After the experiments, the articular cartilage was assessed using histomorphometry, image analysis and statistical method. In the micro-CT analysis, ESWT on medial groups were better than lateral groups in the trabecular volume and trabecular number. The data showed a strong negative correlation between the modified Mankin score and tidemark roughness (r = -0.941; P < 0.001). In terms of the relationship of tidemark roughness with CC thickness, the medial and Sham groups showed a significant negative correlation (r = -0.788, P = 0.022). Additionally, the Euclidean distance derived from 3D scatter plot analysis was an indicator of chondropathic conditions, exhibiting a strong correlation with OA stage in the articular cartilage of the femur (r = 0.911, P < 0.001) and tibia (r = 0.890, P < 0.001) after ESWT. Principle component analysis (PCA) further demonstrated that ESWT applied to medial locations had a better outcome than treatment at lateral locations for knee OA by comparing with Sham and OA groups, and CC thickness was the most important factor affecting hyaline cartilage repair after ESWT.
Keywords: calcified cartilage thickness; extracorporeal shockwave therapy; osteoarthritis; statistical analysis.; tidemark roughness.
© The author(s).
Conflict of interest statement
Competing Interests: The authors have declared that they did not receive any honoraria or consulting fees in writing this manuscript. No benefits in any form have been received or will be received from a commercial party related directly or indirectly to the subject of this article. One author (CJW) serves as a member of the advisory committee on SANUWAVE Health, Inc. (Suwanee, GA), and this study was performed independently of that appointment. The remaining authors declared no conflicts of interest.
Figures
Similar articles
-
Shockwave Targeting on Subchondral Bone Is More Suitable than Articular Cartilage for Knee Osteoarthritis.Int J Med Sci. 2019 Jan 1;16(1):156-166. doi: 10.7150/ijms.26659. eCollection 2019. Int J Med Sci. 2019. PMID: 30662339 Free PMC article.
-
Changes of articular cartilage and subchondral bone after extracorporeal shockwave therapy in osteoarthritis of the knee.Int J Med Sci. 2017 Feb 23;14(3):213-223. doi: 10.7150/ijms.17469. eCollection 2017. Int J Med Sci. 2017. PMID: 28367081 Free PMC article.
-
3D morphometric analysis of calcified cartilage properties using micro-computed tomography.Osteoarthritis Cartilage. 2019 Jan;27(1):172-180. doi: 10.1016/j.joca.2018.09.009. Epub 2018 Oct 1. Osteoarthritis Cartilage. 2019. PMID: 30287395
-
Extracorporeal shockwave treatment in knee osteoarthritis: therapeutic effects and possible mechanism.Biosci Rep. 2020 Nov 27;40(11):BSR20200926. doi: 10.1042/BSR20200926. Biosci Rep. 2020. PMID: 33074309 Free PMC article. Review.
-
Extracorporeal shockwave therapy for the treatment of knee osteoarthritis: a meta-analysis.Int Orthop. 2020 May;44(5):877-884. doi: 10.1007/s00264-020-04489-x. Epub 2020 Jan 28. Int Orthop. 2020. PMID: 31993710 Review.
Cited by
-
Enhancement of hyaline cartilage and subchondral bone regeneration in a rat osteochondral defect model through focused extracorporeal shockwave therapy.Bone Joint Res. 2024 Jul 9;13(7):342-352. doi: 10.1302/2046-3758.137.BJR-2023-0264.R2. Bone Joint Res. 2024. PMID: 38977271 Free PMC article.
-
Electroacupuncture ameliorates knee osteoarthritis in rats via inhibiting NLRP3 inflammasome and reducing pyroptosis.Mol Pain. 2023 Jan-Dec;19:17448069221147792. doi: 10.1177/17448069221147792. Mol Pain. 2023. PMID: 36510338 Free PMC article.
-
Curcumin regulates autophagy through SIRT3-SOD2-ROS signaling pathway to improve quadriceps femoris muscle atrophy in KOA rat model.Sci Rep. 2024 Apr 8;14(1):8176. doi: 10.1038/s41598-024-58375-2. Sci Rep. 2024. PMID: 38589505 Free PMC article.
-
Vector potential dual effect of promoting the proliferation of chondrocytes and inhibiting the calcification process in the articular cartilage.Sci Rep. 2023 Oct 6;13(1):16845. doi: 10.1038/s41598-023-43949-3. Sci Rep. 2023. PMID: 37803162 Free PMC article.
-
Longitudinal assessment of structural and locomotor deficits as a prediction of severity in the collagenase-induced mouse model of osteoarthritis.Arthritis Res Ther. 2025 Feb 26;27(1):42. doi: 10.1186/s13075-025-03507-w. Arthritis Res Ther. 2025. PMID: 40011919 Free PMC article.
References
-
- Englund M, Guermazi A, Lohmander SL. The Role of the Meniscus in Knee Osteoarthritis: a Cause or Consequence? Radiologic Clinics of North America. 2009;47:703–12. - PubMed
-
- Aigner T, Rose J, Martin J, Buckwalter J. Aging theories of primary osteoarthritis: from epidemiology to molecular biology. Rejuvenation research. 2004;7:134–45. - PubMed
-
- Altman R, Asch E, Bloch D, Bole G, Borenstein D, Brandt K. et al. Development of criteria for the classification and reporting of osteoarthritis. Classification of osteoarthritis of the knee. Diagnostic and Therapeutic Criteria Committee of the American Rheumatism Association. Arthritis and rheumatism. 1986;29:1039–49. - PubMed
MeSH terms
LinkOut - more resources
Full Text Sources
