. 2022 Jan 24;19(2):402-415.
doi: 10.7150/ijms.67815. eCollection 2022.

Potential Genes Associated with COVID-19 and Comorbidity

Affiliations

Potential Genes Associated with COVID-19 and Comorbidity

Shanshan Feng et al. Int J Med Sci. .

Abstract

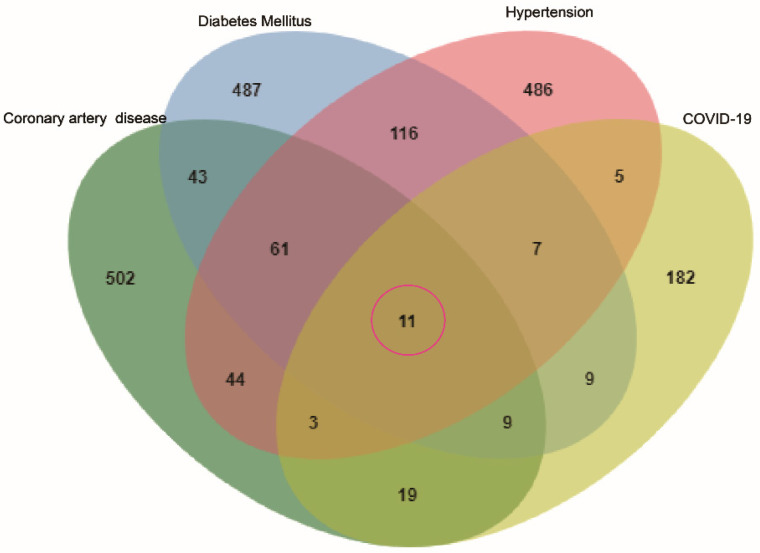
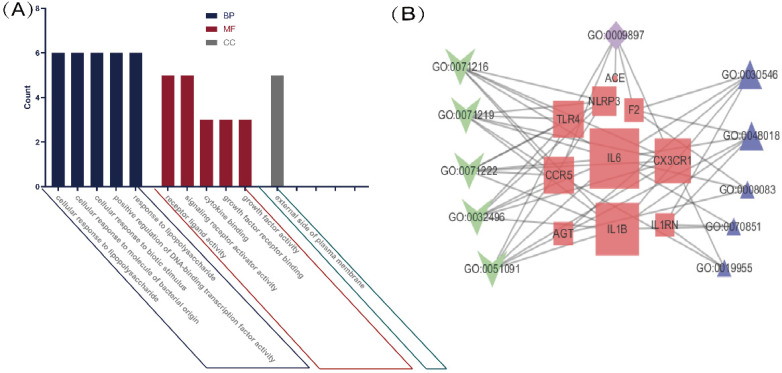
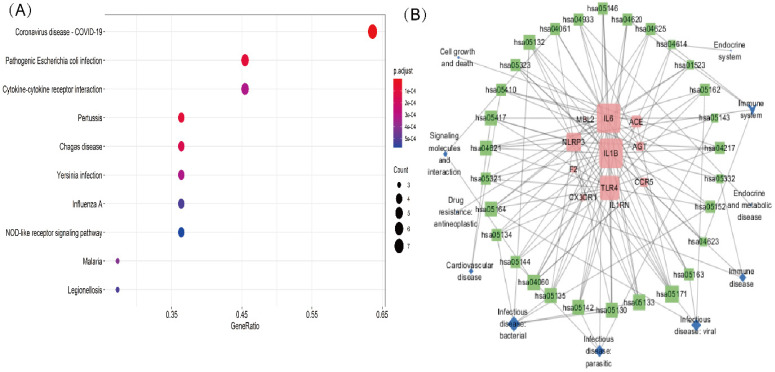
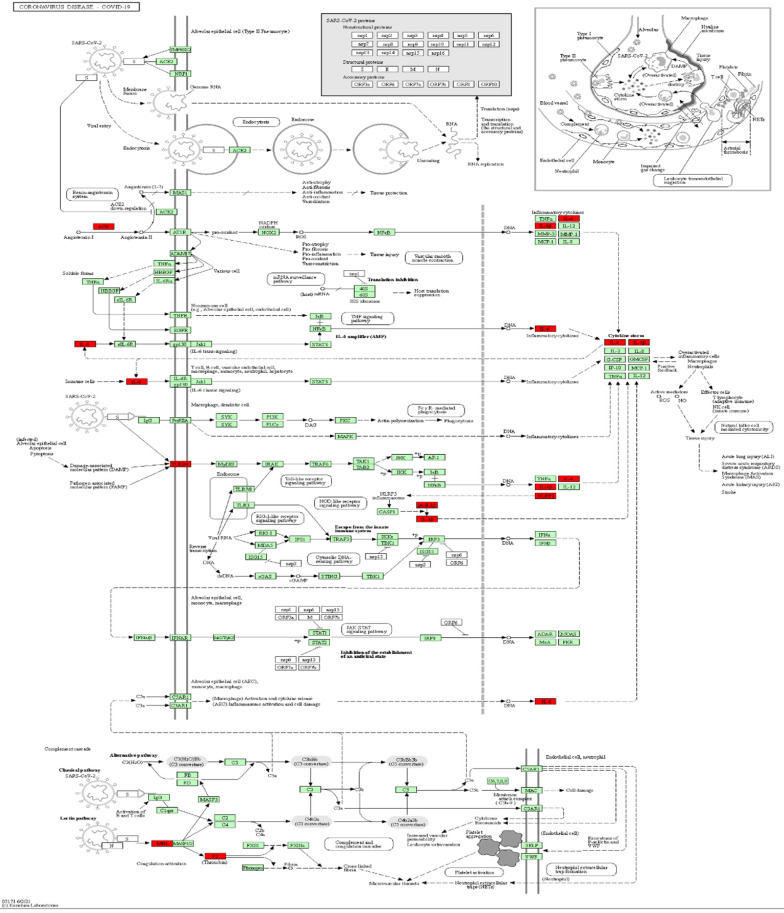
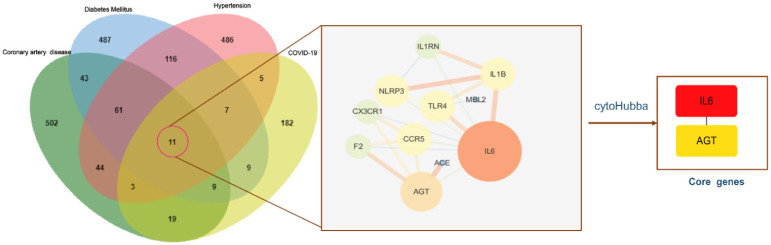
Hypertension, diabetes mellitus, and coronary artery disease are common comorbidities and dangerous factors for infection and serious COVID-19. Polymorphisms in genes associated with comorbidities may help observe susceptibility and disease severity variation. However, specific genetic factors and the extent to which they can explain variation in susceptibility of severity are unclear. Therefore, we evaluated candidate genes associated with COVID-19 and hypertension, diabetes mellitus, and coronary artery disease. In particular, we performed searches against OMIM, NCBI, and other databases, protein-protein interaction network construction, and GO and KEGG pathway enrichment analyses. Results showed that the associated overlapping genes were TLR4, NLRP3, MBL2, IL6, IL1RN, IL1B, CX3CR1, CCR5, AGT, ACE, and F2. GO and KEGG analyses yielded 302 GO terms (q < 0.05) and 29 signaling pathways (q < 0.05), respectively, mainly including coronavirus disease-COVID-19 and cytokine-cytokine receptor interaction. IL6 and AGT were central in the PPI, with 8 and 5 connections, respectively. In this study, we identified 11 genes associated with both COVID-19 and three comorbidities that may contribute to infection and disease severity. The key genes IL6 and AGT are involved in regulating immune response, cytokine activity, and viral infection. Therefore, RAAS inhibitors, AGT antisense nucleotides, cytokine inhibitors, vitamin D, fenofibrate, and vaccines regulating non-immune and immune factors could be potential strategies to prevent and cure COVID-19. The study provides a basis for further investigation of genes and pathways with predictive value for the risk of infection and prognosis and could help guide drug and vaccine development to improve treatment efficacy and the development of personalised treatments, especially for COVID-19 individuals with common comorbidities.

Keywords: COVID-19; SARS-CoV-2; bioinformatics; comorbidity; disease severity; susceptibility gene.


Conflict of interest statement

Competing Interests: The authors have declared that no competing interest exists.

Figures

Figure 1
Figure 1
Venn diagram of the intersection genes to the three comorbidities of COVID-19. Notes: The 11 overlapping genes of comorbidities of hypertension, DM, CAD and COVID-19 were TLR4, NLRP3, MBL2, IL6, IL1RN, IL1B, CX3CR1, CCR5, AGT, ACE, F2.
Figure 2
Figure 2
GO analysis of intersection genes and network visualization. Notes: (A) GO analysis of intersection genes. The value on the Y-axis represents counting the intersection genes in each GO term. Blue represents BP, red represents MF, and green represents CC. The X-axis is the GO term, respectively the top 5 BP, MF and the only cell component enriched according to the count value. (B) Network visualization of gene and GO term. Red represents the common gene, green represents BP, purple represents CC, blue represents MF, the larger the shape means the more connections in the whole network.
Figure 3
Figure 3
KEGG analysis of intersection genes and network visualization. Notes: (A) KEGG analysis of intersection genes. A higher GeneRatio value indicates a higher enrichment level; The bigger circle indicates more target genes in the pathway. The color ranges from blue to red of circles indicating that the adjusted p-values increases from small to large and the enrichment results are more significant. (B) Network visualization of intersecting genes and enriched KEGG pathways. Red represents the common gene, green represents the KEGG pathway and blue represents the upper-level classification of the KEGG pathway. The larger the shape, the more connections in the entire network.
Figure 4
Figure 4
Mapping of intersection genes in the Coronavirus disease-COVID-19 pathway. Notes: The genes in red are mappings of intersection genes in Coronavirus disease-COVID-19 pathway. The intersection genes were mainly mapped in cytokines involved in the inflammatory process. F2 and TLR4 mediate coagulation process and immune recognition against the viral infection process, respectively.
Figure 5
Figure 5
PPI networks of intersection genes and core genes. Notes: The bigger circle represents greater degree; Lines between nodes represent interactions between proteins encoded by genes, with thicker lines indicating stronger interactions; IL6 and AGT were selected as the core genes, and the degree value was 8, 5, respectively. IL6 showed the highest number of connections.

References

    1. Cucinotta D, Vanelli M. WHO Declares COVID-19 a Pandemic. Acta Biomed. 2020;91:157–60. - PMC - PubMed
    1. Organization WH. World Health Organization Weekly Operational Update on COVID-19. 2021.
    1. Levi M, Thachil J, Iba T, Levy JH. Coagulation abnormalities and thrombosis in patients with COVID-19. The Lancet Haematology. 2020;7:e438–e440. - PMC - PubMed
    1. Verdecchia P, Cavallini C, Spanevello A, Angeli F. The pivotal link between ACE2 deficiency and SARS-CoV-2 infection. Eur J Intern Med. 2020;76:14–20. - PMC - PubMed
    1. Ragab D, Salah Eldin H, Taeimah M, Khattab R, Salem R. The COVID-19 Cytokine Storm; What We Know So Far. Front Immunol. 2020;11:1446. - PMC - PubMed