

Mitochondrial oxidative stress contributes to the pathological aggregation and accumulation of tau oligomers in Alzheimer's disease
- PMID: 35165721
- PMCID: PMC9396941
- DOI: 10.1093/hmg/ddab363
Mitochondrial oxidative stress contributes to the pathological aggregation and accumulation of tau oligomers in Alzheimer's disease
Abstract
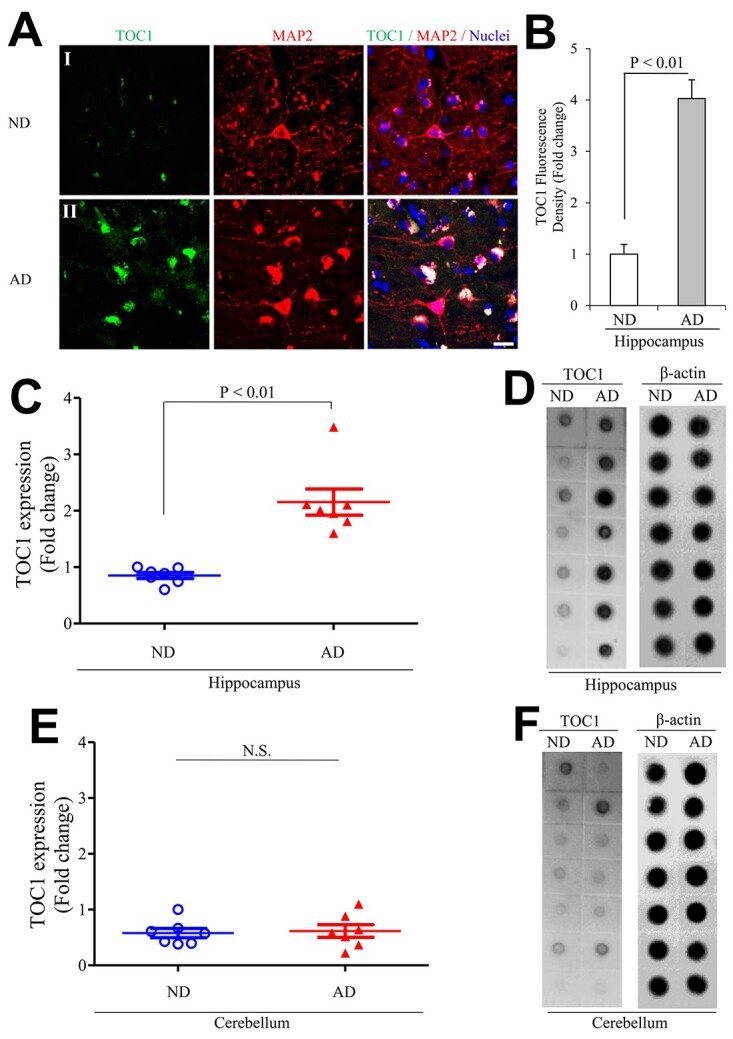
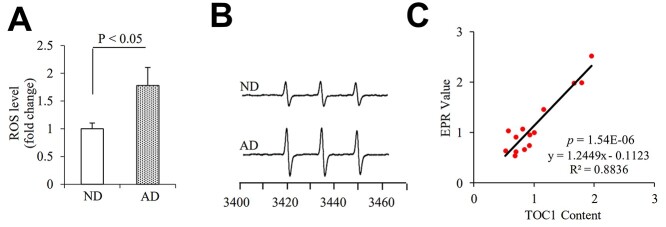
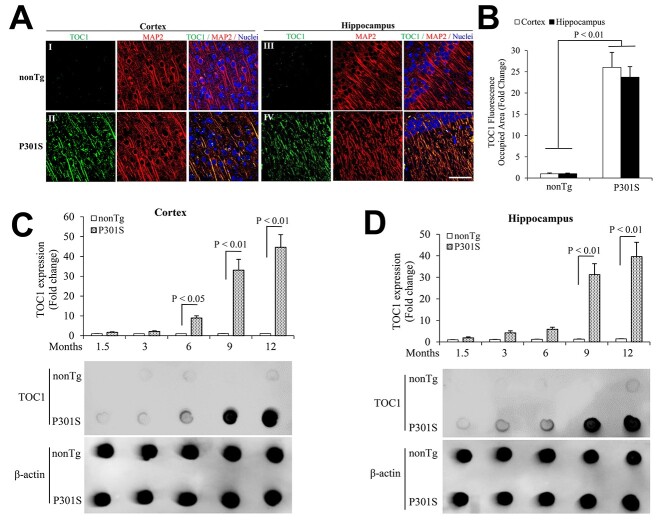
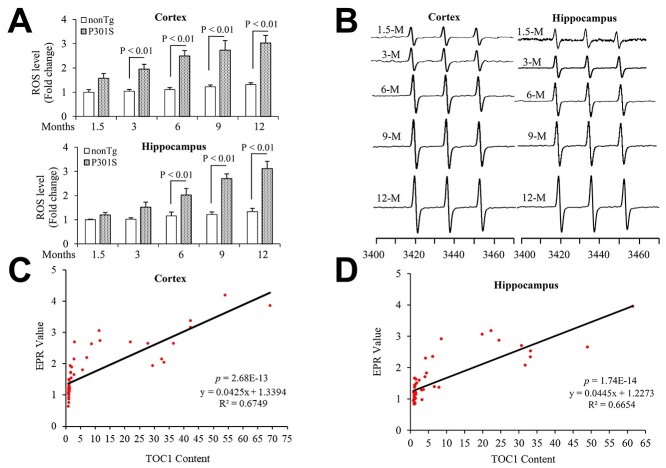
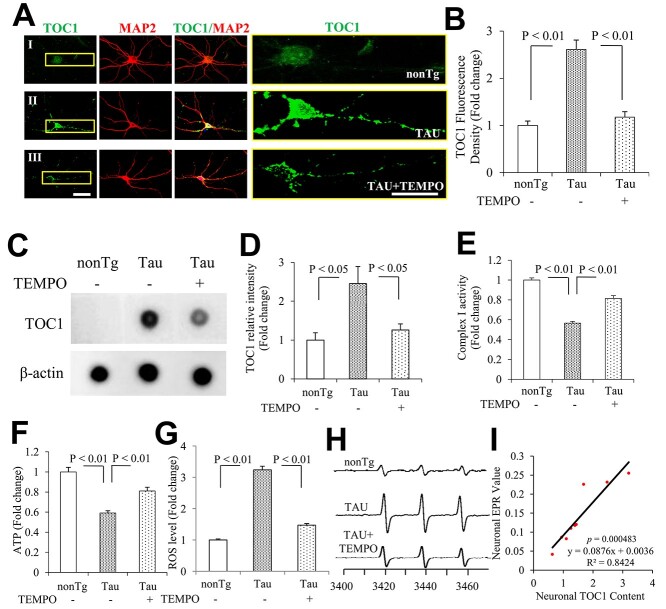
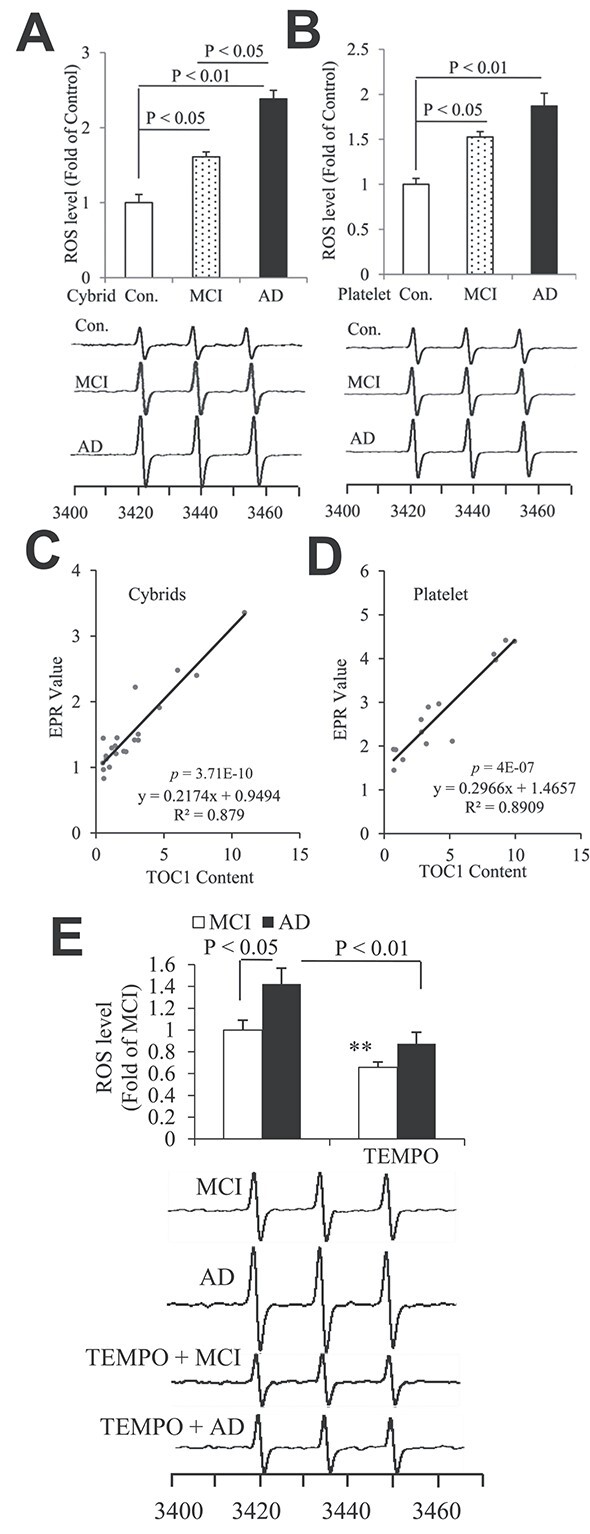
Tau oligomers (oTau) are thought to precede neurofibrillary tangle formation and likely represent one of the toxic species in disease. This study addresses whether mitochondrial reactive oxygen species (ROS) contribute to tau oligomer accumulation. First, we determined whether elevated oxidative stress correlates with aggregation of tau oligomers in the brain and platelets of human Alzheimer's disease (AD) patient, tauopathy mice, primary cortical neurons from tau mice and human trans-mitochondrial 'cybrid' (cytoplasmic hybrid) neuronal cells, whose mitochondria are derived from platelets of patients with sporadic AD- or mild cognitive impairment (MCI)-derived mitochondria. Increased formation of tau oligomers correlates with elevated ROS levels in the hippocampi of AD patients and tauopathy mice, AD- and MCI-derived mitochondria and AD and MCI cybrid cells. Furthermore, scavenging ROS by application of mito-TEMPO/2-(2,2,6,6-Tetramethylpiperidin-1-oxyl-4-ylamino)-2-oxoethyl)triphenylphosphonium chloride, a mitochondria-targeted antioxidant, not only inhibits the generation of mitochondrial ROS and rescues mitochondrial respiratory function but also robustly suppresses tau oligomer accumulation in MCI and AD cybrids as well as cortical neurons from tau mice. These studies provide substantial evidence that mitochondria-mediated oxidative stress contributes to tau oligomer formation and accumulation.
© The Author(s) 2022. Published by Oxford University Press. All rights reserved. For Permissions, please email: journals.permissions@oup.com.
Figures

Similar articles
-
Expression of a truncated tau protein induces oxidative stress in a rodent model of tauopathy.Eur J Neurosci. 2006 Aug;24(4):1085-90. doi: 10.1111/j.1460-9568.2006.04986.x. Eur J Neurosci. 2006. PMID: 16930434
-
Mitochondrial Dysfunction Triggers Synaptic Deficits via Activation of p38 MAP Kinase Signaling in Differentiated Alzheimer's Disease Trans-Mitochondrial Cybrid Cells.J Alzheimers Dis. 2017;59(1):223-239. doi: 10.3233/JAD-170283. J Alzheimers Dis. 2017. PMID: 28598851 Free PMC article.
-
Hippocampal tau oligomerization early in tau pathology coincides with a transient alteration of mitochondrial homeostasis and DNA repair in a mouse model of tauopathy.Acta Neuropathol Commun. 2020 Mar 4;8(1):25. doi: 10.1186/s40478-020-00896-8. Acta Neuropathol Commun. 2020. PMID: 32131898 Free PMC article.
-
Mechanistic Insights into Tau Protein-Mediated Regulation of Oxidative Stress.Zhongguo Ying Yong Sheng Li Xue Za Zhi. 2024 Oct 9;40:e20240028. doi: 10.62958/j.cjap.2024.028. Zhongguo Ying Yong Sheng Li Xue Za Zhi. 2024. PMID: 39379150 Review.
-
The Role of Mitochondrial Impairment in Alzheimer´s Disease Neurodegeneration: The Tau Connection.Curr Neuropharmacol. 2020;18(11):1076-1091. doi: 10.2174/1570159X18666200525020259. Curr Neuropharmacol. 2020. PMID: 32448104 Free PMC article. Review.
Cited by
-
The role of protein phosphorylation modifications mediated by iron metabolism regulatory networks in the pathogenesis of Alzheimer's disease.Front Aging Neurosci. 2025 Feb 25;17:1540019. doi: 10.3389/fnagi.2025.1540019. eCollection 2025. Front Aging Neurosci. 2025. PMID: 40071123 Free PMC article. Review.
-
Chronic Stress-Associated Depressive Disorders: The Impact of HPA Axis Dysregulation and Neuroinflammation on the Hippocampus-A Mini Review.Int J Mol Sci. 2025 Mar 24;26(7):2940. doi: 10.3390/ijms26072940. Int J Mol Sci. 2025. PMID: 40243556 Free PMC article. Review.
-
Drug Target to Alleviate Mitochondrial Dysfunctions in Alzheimer's Disease: Recent Advances and Therapeutic Implications.Curr Neuropharmacol. 2024;22(12):1942-1959. doi: 10.2174/1570159X22666240426091311. Curr Neuropharmacol. 2024. PMID: 39234772 Free PMC article. Review.
-
The Cellular and Organismal Effects of Nitroxides and Nitroxide-Containing Nanoparticles.Int J Mol Sci. 2024 Jan 24;25(3):1446. doi: 10.3390/ijms25031446. Int J Mol Sci. 2024. PMID: 38338725 Free PMC article. Review.
-
New cyclophilin D inhibitor rescues mitochondrial and cognitive function in Alzheimer's disease.Brain. 2024 May 3;147(5):1710-1725. doi: 10.1093/brain/awad432. Brain. 2024. PMID: 38146639 Free PMC article.
References
-
- Lee, V.M. and Trojanowski, J.Q. (1999) Neurodegenerative tauopathies: human disease and transgenic mouse models. Neuron, 24, 507–510. - PubMed
-
- Ballatore, C., Lee, V.M. and Trojanowski, J.Q. (2007) Tau-mediated neurodegeneration in Alzheimer’s disease and related disorders. Nat. Rev. Neurosci., 8, 663–672. - PubMed
-
- Planel, E., Miyasaka, T., Launey, T., Chui, D.H., Tanemura, K., Sato, S., Murayama, O., Ishiguro, K., Tatebayashi, Y. and Takashima, A. (2004) Alterations in glucose metabolism induce hypothermia leading to tau hyperphosphorylation through differential inhibition of kinase and phosphatase activities: implications for Alzheimer's disease. J. Neurosci., 24, 2401–2411. - PMC - PubMed
-
- Kaniyappan, S., Chandupatla, R.R., Mandelkow, E.M. and Mandelkow, E. (2017) Extracellular low-n oligomers of tau cause selective synaptotoxicity without affecting cell viability. Alzheimers Dement., 13, 1270–1291. - PubMed
Publication types
MeSH terms
Substances
Grants and funding
LinkOut - more resources
Full Text Sources
Medical
Molecular Biology Databases
