Randomized Controlled Trial
. 2022 May;59(5):e14008.
doi: 10.1111/psyp.14008. Epub 2022 Feb 14.

Dorsal-to-ventral imbalance in the superior longitudinal fasciculus mediates methylphenidate's effect on beta oscillations in ADHD

Affiliations
Randomized Controlled Trial

Dorsal-to-ventral imbalance in the superior longitudinal fasciculus mediates methylphenidate's effect on beta oscillations in ADHD

Cecilia Mazzetti et al. Psychophysiology. 2022 May.

Abstract

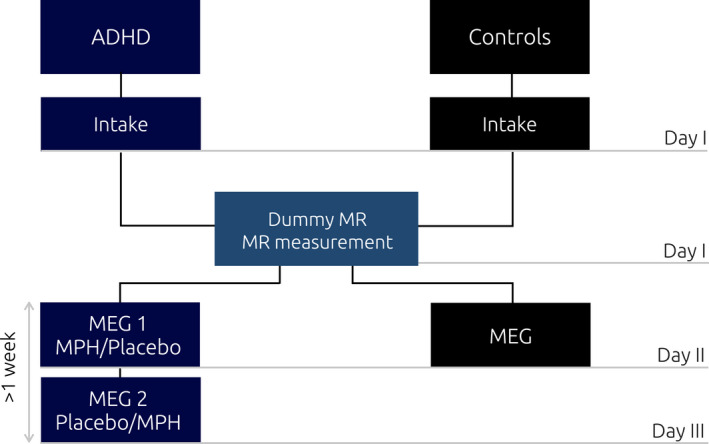
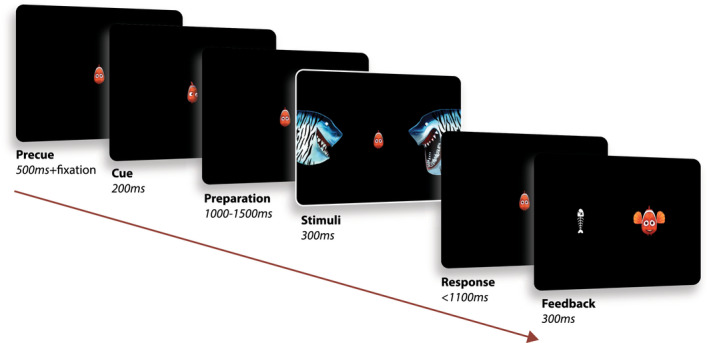
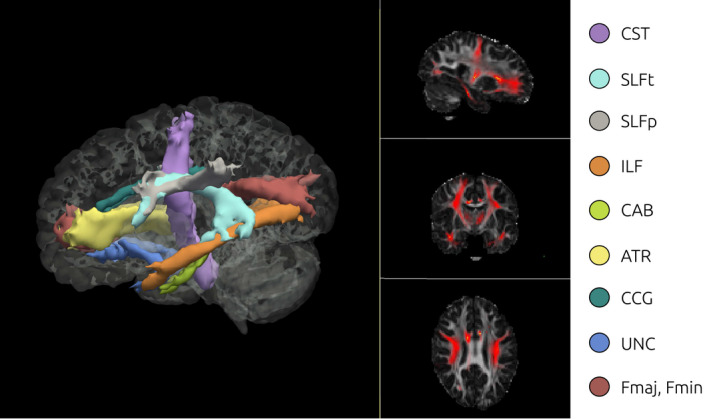
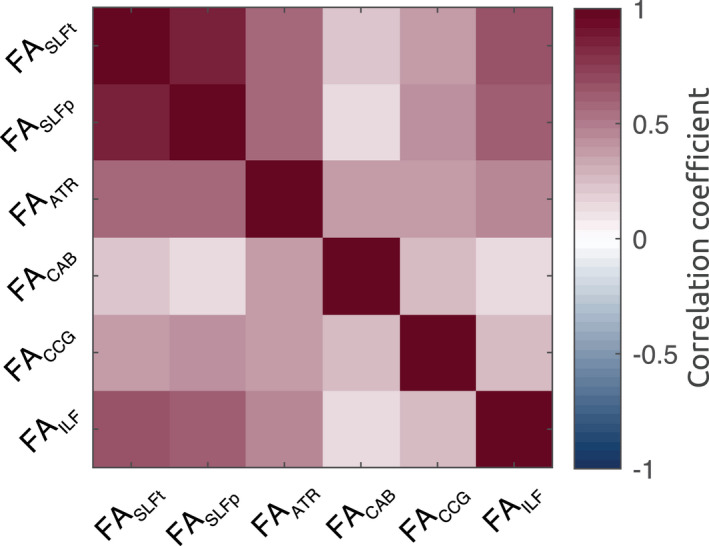
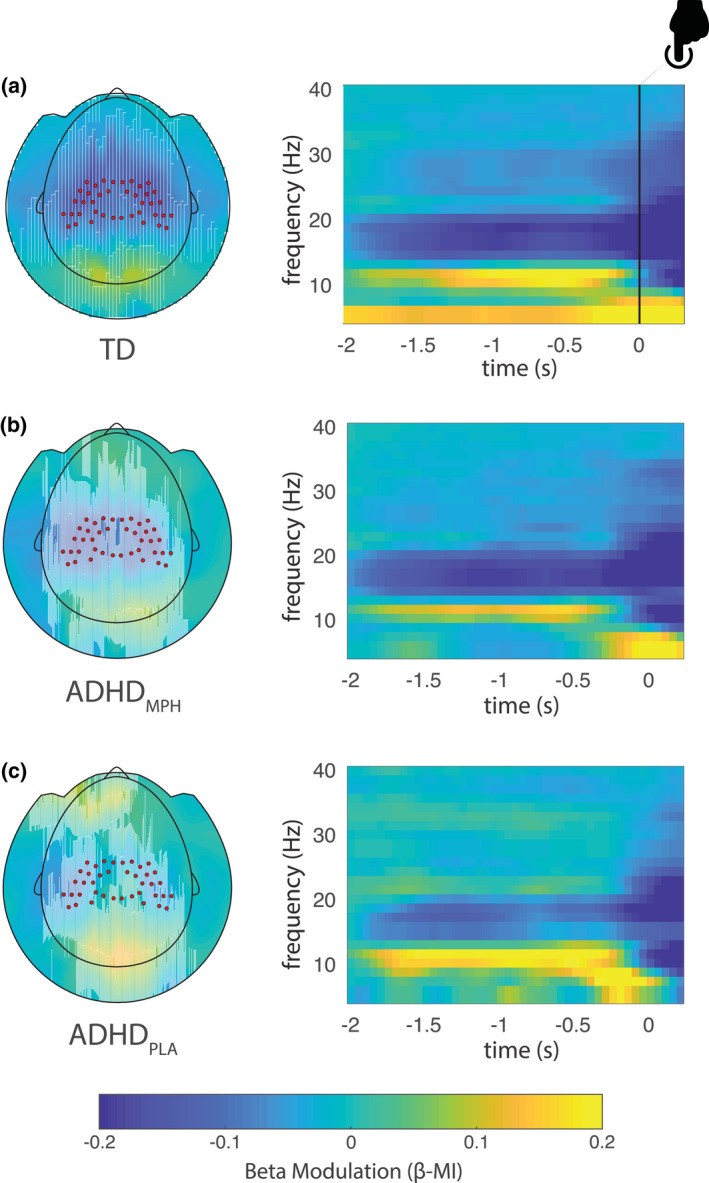
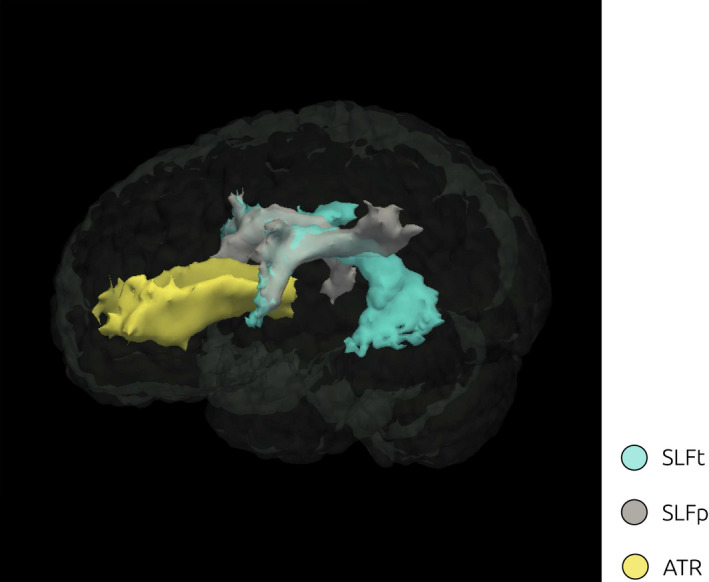
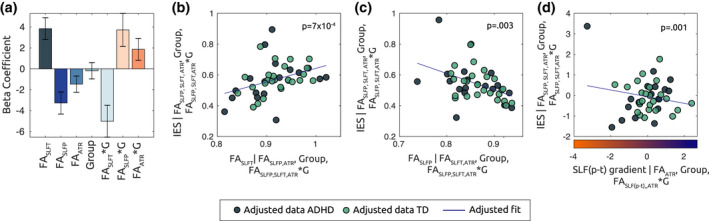
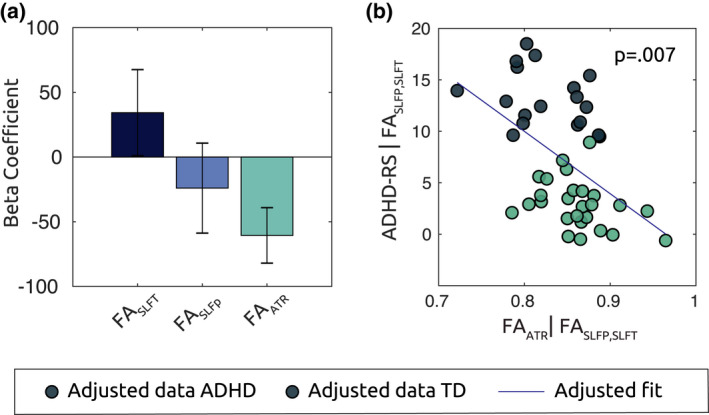
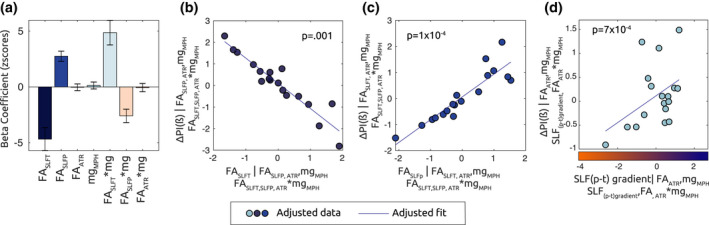
While pharmacological treatment with methylphenidate (MPH) is a first line intervention for ADHD, its mechanisms of action have yet to be elucidated. We here seek to identify the white matter tracts that mediate MPH's effect on beta oscillations. We implemented a double-blind placebo-controlled crossover design, where boys diagnosed with ADHD underwent behavioral and MEG measurements during a spatial attention task while on and off MPH. The results were compared with an age/IQ-matched control group. Estimates of white matter tracts were obtained using diffusion tensor imaging (DTI). Via a stepwise model selection strategy, we identified the fiber tracts (regressors) significantly predicting values of the dependent variables of interest (i.e., oscillatory power, behavioral performance, and clinical symptoms): the anterior thalamic radiation (ATR), the superior longitudinal fasciculus ("parietal endings") (SLFp), and superior longitudinal fasciculus ("temporal endings") (SLFt). ADHD symptoms severity was associated with lower fractional anisotropy (FA) within the ATR. In addition, individuals with relatively higher FA in SLFp compared to SLFt, led to stronger behavioral effects of MPH in the form of faster and more accurate responses. Furthermore, the same parietotemporal FA gradient explained the effects of MPH on beta modulation: subjects with ADHD exhibiting higher FA in SLFp compared to SLFt also displayed greater effects of MPH on beta power during response preparation. Our data suggest that the behavioral deficits and aberrant oscillatory modulations observed in ADHD depend on a possibly detrimental structural connectivity imbalance within the SLF, caused by a diffusivity gradient in favor of parietal rather than temporal, fiber tracts.

Keywords: ADHD; meg; methylphenidate; oscillations.


Figures

FIGURE 1
FIGURE 1
Experimental study design. aCase report form and behavioral test (line bisection task, WISCIII vocabulary and block design subscales, ADHD rating scale, CBCL); bpsychiatric intake (basic medical screening and dosage determination); cPolhemus digitizer; dmedication intake (1 hour prior to the beginning of experimental task); participants in the ADHD and controls group visited the laboratory three and two times, respectively. During the first visit (day I) the psychiatric assessment took place, which determined participants' suitability for the study. The same day, the dummy MR took place, followed by the actual MR scan. The second day (day II) both groups performed the attentional task while electromagnetic activity was recorded with the MEG. The ADHD group performed the task twice (day II and day III), once upon administration of MPH, and once upon administration of a placebo pill. This was done according to a randomized crossover design, half of the participants received the MPH on day II, while the other half on day III
FIGURE 2
FIGURE 2
Attentional task. (Adapted from Mazzetti et al., 2020). The paradigm consisted in a child‐friendly adaptation of a Posner cueing paradigm for the study of spatial orienting of attention. Each trial (370 in total) began with the presentation of a fish in the middle of the screen, serving as fixation cross. An eye tracker ensured that the children kept proper fixation throughout the whole trial (as trials were stopped in case the subject performed a saccade). A cue was then presented for 200 ms, represented by the fish looking either at the left or right side of the screen (cue side equally distributed across trials). After a preparation interval jittered in the range 1100–1500 ms, the stimuli were then presented for 300 ms, on the two sides of the screen. The child was asked to respond, via button press, indicating the position of the target (shark with an open mouth), while ignoring the distractor on the other side (shark with mouth closed). A positive feedback (happy fish) was then presented if a correct answer was provided within the response interval (1100 ms). In case of wrong or no response, a negative feedback was presented (fish bone)
FIGURE 3
FIGURE 3
3D Rendering of cortical parcellation based on Desikan‐Killiany atlas in one sample TD subject. A cortical parcellation was generated prior to tract estimation, which are combined with prior distributions on the neighboring anatomical structures of each pathway and subcortical segmentation to constrain the tractography solutions (obviating the need for user interaction thus automating the process)
FIGURE 4
FIGURE 4
3D Isosurface rendering and 2D orthographic view of tract reconstructions in one sample subject obtained using TRACULA. Visualization of the probability distributions of all white‐matter pathways simultaneously overlaid on 4D brain mask. All 18 tracts are displayed at 20% of their maximum threshold
FIGURE 5
FIGURE 5
Correlation matrix of FA across bilateral white matter structures shows that no negative association subsists between segmented tracts
FIGURE 6
FIGURE 6
Beta modulation indices in the three conditions (adapted from (Mazzetti et al., 2020)). Topographic plot (left) and respective time frequency representations (TFRs) (right panel) of power modulation (β‐MI) for the typically developing group (TD) (a), ADHDMPH group (b), and ADHDPLA group (c). Red dots superimposed on the topographies denote sensors of interest as defined in Figure 4a. Notably, beta preparation is stronger in the TD group, while progressively decreases in the ADHDMPH group, being weakest in the ADHDPLA group
FIGURE 7
FIGURE 7
3D Rendering of white matter ROI. Visualization of the probability distributions of the ROIs identified as tracts of interest according to the model selection approach: SLFp, SLFt, and ATR
FIGURE 8
FIGURE 8
FA In SLFp and SLFt predict behavioral performance in the task. (a) The bar plot displays the beta coefficients associated with the linear mixed model mdl(1), where mean FA values within the identified tracts of interest are set as explanatory variables for behavioral performance, as indexed by the IES. Error bars indicate standard error of the mean. The adjusted response plots in (b) and (c) show, respectively, the behavioral performance (IES) as a function of the FASLFt and, FASLFp, while averaging over other regressors in the model in (a). (d) Adjusted response plot displaying the association between IES and parietotemporal gradient SLF (p–t), averaged over the residual regressors (mdl(1.a). Positive SLF (p–t) values indicate higher FA along parietal as compared to temporal endings within the SLF
FIGURE 9
FIGURE 9
FA In ATR predicts ADHD symptoms severity in all subjects. (a) Bar plot shows beta coefficients associated with mdl(2), where mean FA values along the tracts of interest are defined as predictors for ADHD‐RS symptoms score in all subjects. FAATR is associated with a significant partial regression coefficient (p = .007). Scatter plot in (b) show the adjusted response plot of symptoms as a function of FAATR, controlling for the variance explained the other predictors. Lower diffusivity along the ATR corresponded to higher average ADHD symptomatology along the spectrum
FIGURE 10
FIGURE 10
FA In SLFp and SLFt predict MPH effects on β depression in the ADHD group. (a) Bar plot shows beta regression coefficients associated with mdl(4), where mean FA values along the tracts of interest are defined as predictors for changes in beta modulation due to medication intake (ΔPI(β)). According to equation (2), a higher ΔPI (β) value for a given ADHD subject reflects bigger changes in depression of beta oscillations following medication intake. (b) Adjusted response plot showing ΔPI (β) as a function of FASLFt. A significant beta coefficient (p = .001) reveals that FASLFt predicted lower changes in β power depression due to MPH. (c) Adjusted response plot showing ΔPI(β) as a function of FASLFp. Higher FASLFp corresponded to stronger β depression changes following MPH intake (p = 1 × 10–4). (d) Adjusted response plot illustrating ΔPI (β) as a function of parietotemporal SLF gradient according to mdl(4.a). Higher SLF (p–t), for a given ADHD subject, reflected higher diffusivity at parietal endings, as compared to temporal endings, of the SLF. The significant positive relationship (p = 7 × 10–4) suggests that the gradient of parietotemporal diffusivity in the SLF is predictive of the effects of MPH on β depression

Similar articles

Cited by

References

    1. Alexander, A. L. , Lee, J. E. , Lazar, M. , & Field, A. S. (2007). Diffusion tensor imaging of the brain. Neurotherapeutics, 4(3), 316–329. 10.1016/j.nurt.2007.05.011 - DOI - PMC - PubMed
    1. American Psychiatric Association . (2013). Diagnostic and statistical manual of mental disorders (5th ed.) (A. P. Association & A. P. A. D.‐5 T. Force [eds.]). American Psychiatric Association. 10.1176/appi.books.9780890425596 - DOI
    1. Arns, M. , Vollebregt, M. A. , Palmer, D. , Spooner, C. , Gordon, E. , Kohn, M. , Clarke, S. , Elliott, G. R. , & Buitelaar, J. K. (2018). Electroencephalographic biomarkers as predictors of methylphenidate response in attention‐deficit/hyperactivity disorder. European Neuropsychopharmacology, 28(8), 881–891. 10.1016/j.euroneuro.2018.06.002 - DOI - PubMed
    1. Arnsten, A. F. T. (2006). Stimulants: Therapeutic actions in ADHD. Neuropsychopharmacology, 31(11), 2376–2383. 10.1038/sj.npp.1301164 - DOI - PubMed
    1. Assaf, Y. , & Pasternak, O. (2008). Diffusion tensor imaging (DTI)‐based white matter mapping in brain research: A review. Journal of Molecular Neuroscience, 34(1), 51–61. 10.1007/s12031-007-0029-0 - DOI - PubMed

Publication types

MeSH terms

Substances