. 2022 Apr;100(4):1063-1083.
doi: 10.1002/jnr.25021. Epub 2022 Feb 15.

Flavonoids improve the stability and function of P23H rhodopsin slowing down the progression of retinitis pigmentosa in mice

Affiliations

Flavonoids improve the stability and function of P23H rhodopsin slowing down the progression of retinitis pigmentosa in mice

Joseph Thomas Ortega et al. J Neurosci Res. 2022 Apr.

Abstract

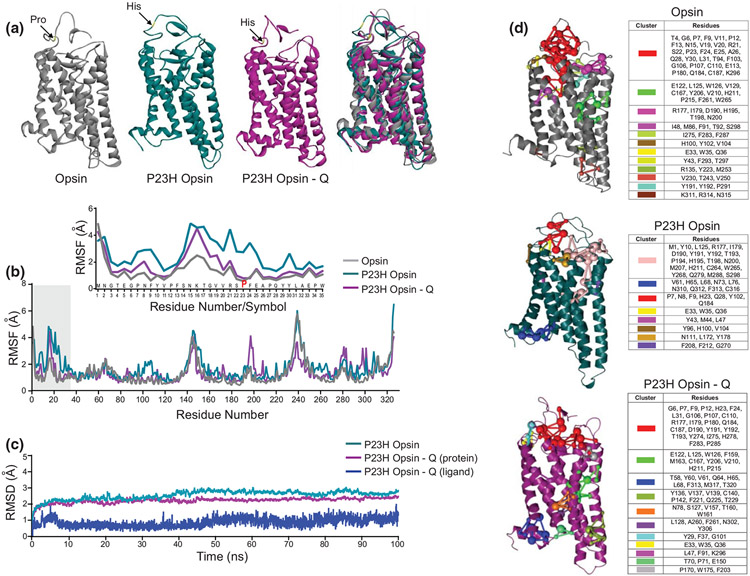
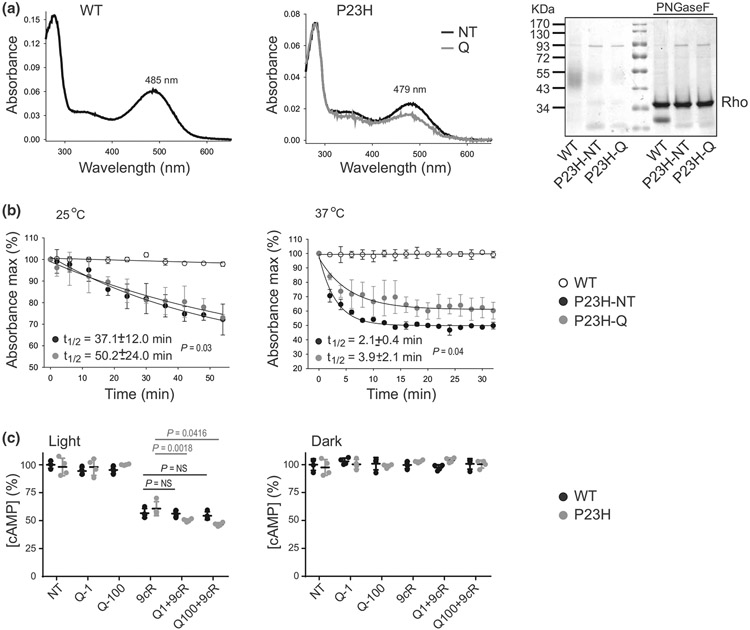
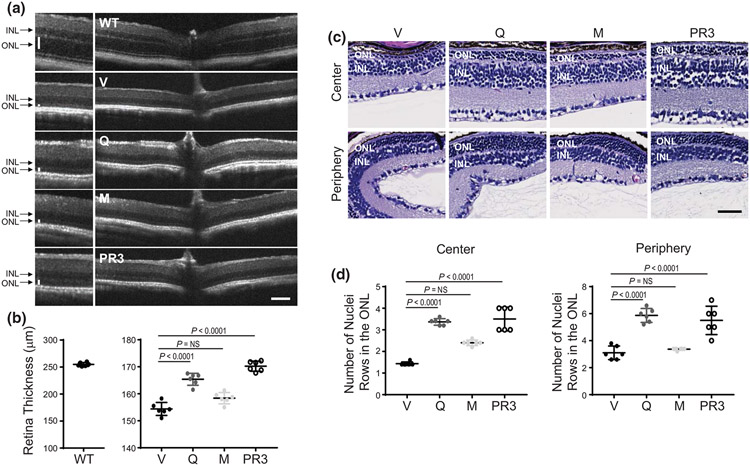
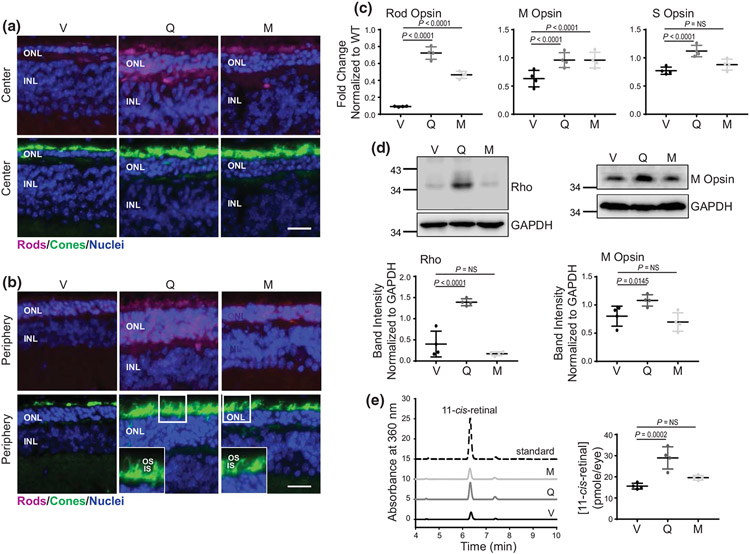
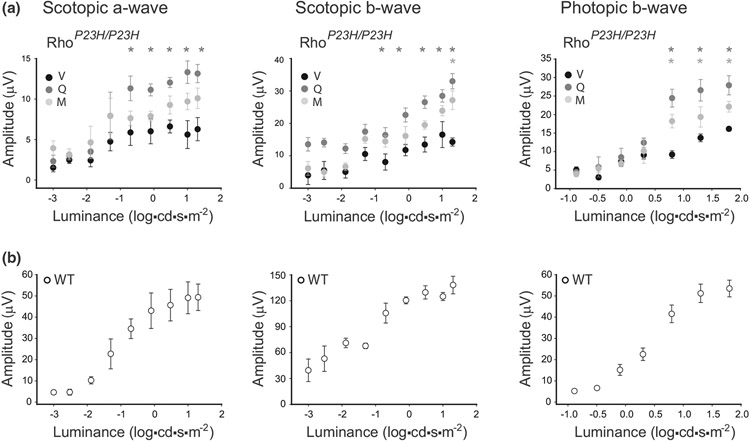
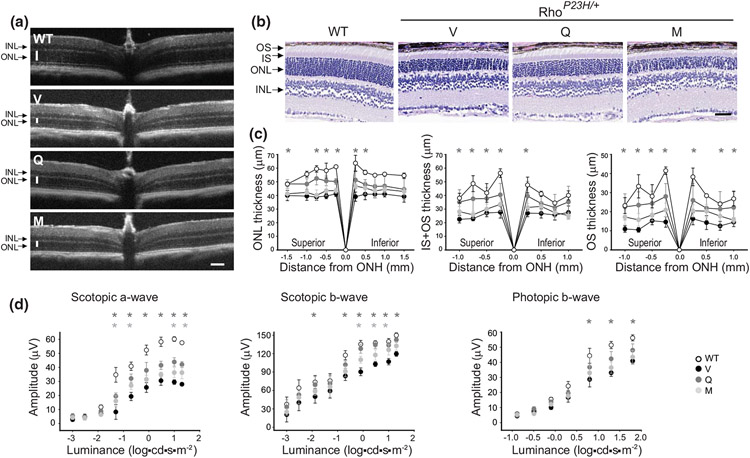
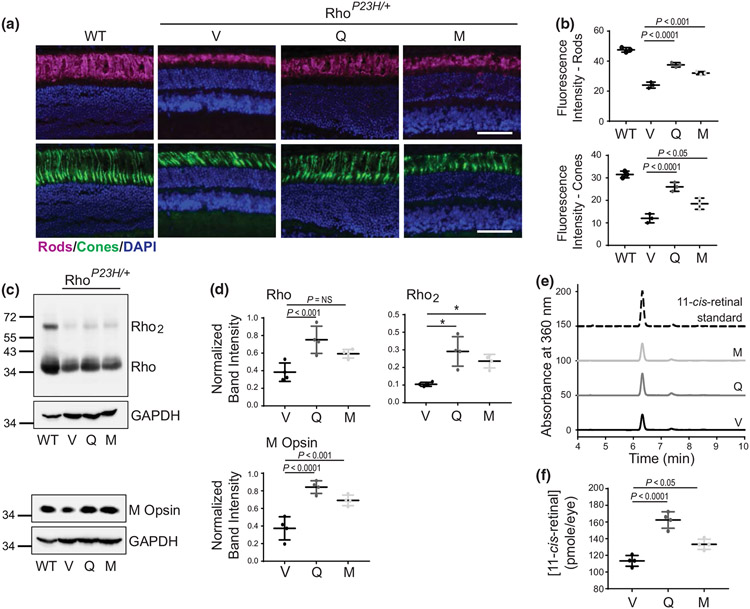
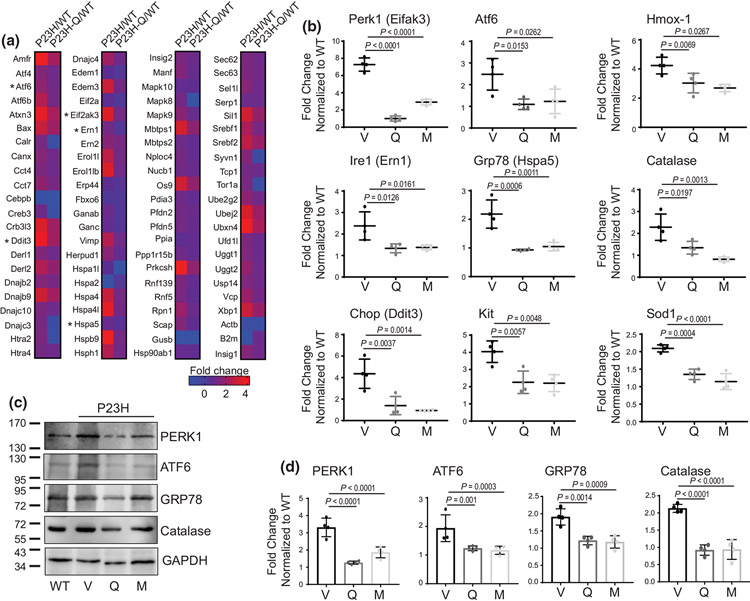
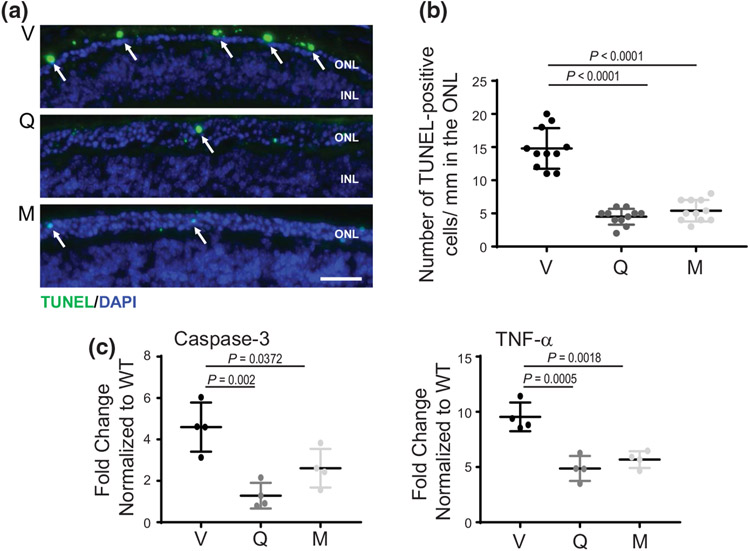
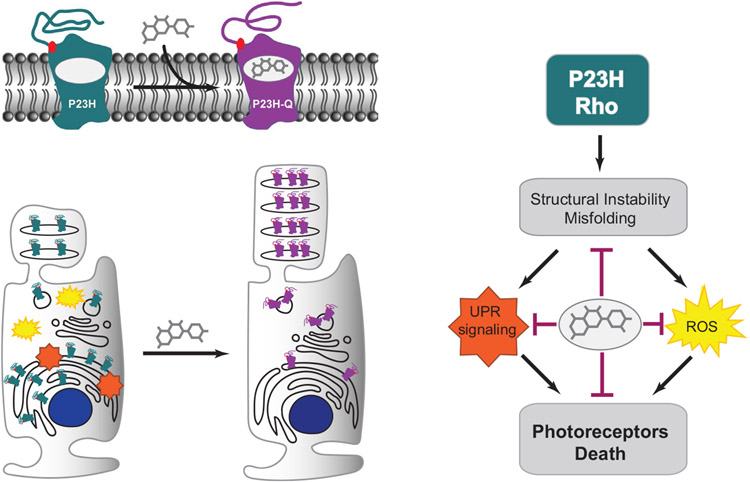
The balanced homeostasis of the G protein-coupled receptor (GPCR), rhodopsin (Rho), is required for vision. Misfolding mutations in Rho cause photoreceptor death, leading to retinitis pigmentosa (RP) and consequently blindness. With no cure currently available, the development of efficient therapy for RP is an urgent need. Pharmacological supplementation with molecular chaperones, including flavonoids, improves stability, folding, and membrane targeting of the RP Rho mutants in vitro. Thus, we hypothesized that flavonoids by binding to P23H Rho and enhancing its conformational stability could mitigate detrimental effects of this mutation on retinal health. In this work, we evaluated the pharmacological potential of two model flavonoids, quercetin and myricetin, by using in silico, in vitro, and in vivo models of P23H Rho. Our computational analysis showed that quercetin could interact within the orthosteric binding pocket of P23H Rho and shift the conformation of its N-terminal loop toward the wild type (WT)-like state. Quercetin added to the NIH-3T3 cells stably expressing P23H Rho increased the stability of this receptor and improved its function. Systemic administration of quercetin to P23H Rho knock-in mice substantially improved retinal morphology and function, which was associated with an increase in levels of Rho and cone opsins. In addition, treatment with quercetin resulted in downregulation of the UPR signaling and oxidative stress-related markers. This study unravels the pharmacological potential of quercetin to slow down the progression of photoreceptor death in Rho-related RP and highlights its prospective as a lead compound to develop a novel therapeutic remedy to counter RP pathology.

Keywords: cone opsin; flavonoid; photoreceptor; retinal degeneration; retinitis pigmentosa; rhodopsin.


Conflict of interest statement

CONFLICT OF INTEREST

The authors declare that they have no conflict of interest with the contents of this article.

Figures

FIGURE 1
FIGURE 1
The effect of flavonoids on the conformational stability of P23H Rho. (a) The ligand-free P23H rod opsin structure and the model of P23H rod opsin with quercetin bound were optimized and subjected to the molecular dynamic (MD) simulations carried out using Schrödinger software. A monomer of wild type (WT) rod opsin (PDB ID: 3CAP) was used as a control. The results of these MD simulations are shown. The extracellular N-terminal loop and the resident Pro23 residue are indicated with an arrow in the final pose obtained after MD simulations. The structural flexibility of the N-terminal loop increases upon the substitution of Pro23 to His residue. The binding of quercetin to P23H rod opsin increases its structural stability and facilitates the structural changes resembling the WT-like conformation. (b) The root-mean-square fluctuation (RMSF) for WT opsin (gray), P23H opsin (cyan), and P23H opsin with bound quercetin (magenta) plotted with the respect to the residue number of rod opsin. The N-terminal loop residues are highlighted with a gray bar. Inset, a close-up view of the N-terminal loop residues. (c) The root-mean-square deviation (RMSD) obtained for P23H opsin (cyan) and P23H opsin bound to quercetin (magenta) plotted with the respect to the initial pose. Also, the RMSD for the ligand bound to P23H opsin (dark blue) is shown. (d) The protein structure network (PSN) obtained for WT opsin, P23H opsin, and P23H opsin with quercetin bound to the orthosteric site. The specific residue interaction clusters are shown in the protein structures and specified in the tables
FIGURE 2
FIGURE 2
The effect of flavonoids on P23H Rho stability and function. Rho was purified from the NIH-3T3 cells stably expressing wild type (WT) Rho or the P23H Rho mutant. (a) UV-visible absorption spectra of WT Rho (left panel) and P23H Rho immunopurified from either nontreated (black line, middle panel) or quercetin-treated cells (gray line, middle panel) and regenerated with 9-cis-retinal. The representative coomassie blue-stained SDS-PAGE gel of the purified Rho samples either nontreated or treated with PNGaseF deglycosylase (right panel) indicates that treatment with quercetin did not change the migration pattern of P23H Rho. (b) Thermal stability of P23H Rho either nontreated or treated with quercetin in comparison to WT Rho upon incubation at 25°C (left panel) and 37°C (right panel) (n = 3, F3,8 = 66.10, p < 0.0001). The UV-visible absorption spectra were recorded every 2 min in the dark. The percentage of remaining pigments normalized to their initial concentrations was then plotted as a function of time. The half-time (t1/2) of chromophore release was calculated from these plots. Each measurement was performed in triplicate. The experiment was repeated twice. Error bars represent standard deviation (S.D.). (c) The effect of quercetin on the cAMP levels in the NIH-3T3 cells expressing P23H Rho either nontreated or treated with quercetin and exposed to light (n = 3, F5,36 = 235, p < 0.0001). Cells expressing WT Rho were used as a control. Cells were incubated with quercetin for 16 hr and 9-cis-retinal for 2 hr before the measurement. Forskolin was added to the cells to saturate their cAMP levels followed by light illumination. Control cells, nontreated, treated with quercetin, or treated with 9-cis-retinal underwent the same procedure. These measurements were also performed in the dark (n = 3, F5,36 = 0.52, p = 0.76). cAMP levels were detected as described in Section 2. Each condition was performed in triplicate, and the experiment was repeated twice. Statistical analysis was performed with the one-way ANOVA and Bonferroni post hoc tests. The P-values for statistically different changes are indicated in the figure. NT, nontreated; 9cR, treated with 5 μM 9-cis-retinal; Q-1, treated with 1-μM quercetin; Q-100, treated with 100-μM quercetin
FIGURE 3
FIGURE 3
Protective effect of flavonoids against retinal degeneration in RhoP23H/P23H mice. Flavonoids (20 mg/kg bw) or dimethyl sulfoxide (DMSO) vehicle were administered intraperitoneally (i.p.) to homozygous RhoP23H/P23H mice at P14 every other day and mice were analyzed at P21. Wild type (WT) mice and RhoP23H/P23H mice treated with photoregulin3 (PR3) were used as controls. (a) Representative optical coherence tomography (OCT) images of the mouse eyes (n = 5, F4,25 = 1699, p < 0.0001). ONL, outer nuclear layer; INL, inner nuclear layer. Scale bar, 100 μm. (b) The thickness of the retina measured at 500 μm from the optic nerve head (ONH). Error bars indicate S.D. Changes in the retina thickness observed between vehicle-treated and quercetin-treated but not myricetin-treated were statistically different. (c) Images of hematoxylin and eosin (H&E)-stained retinal sections visualizing the retina center and periphery. Scale bar, 50 μm. (d) The number of nuclei rows in the ONL counted in the retina center (n = 5, F3,20 = 64.32, p < 0.0001) and periphery (n = 5, F3,20 = 30.05, p < 0.0001). Error bars indicate standard deviation (S.D.). The changes found in mice treated with quercetin but not with myricetin were statistically different as compared with vehicle-treated control mice. Statistical analysis was performed with the one-way ANOVA and post hoc Bonferroni tests. The P-values for the statistically significant changes are indicated in the figure. The nonstatistically different changes are indicated as NS. V, treated with vehicle, Q, treated with quercetin, M, treated with myricetin
FIGURE 4
FIGURE 4
The effect of flavonoids on the expression of Rho and cone opsins in RhoP23H/P23H mice. (a, b) Immunohistochemistry in cryosections prepared from eyes collected from RhoP23H/P23H mice at P21 treated with either vehicle or flavonoids. Sections stained with an anti-Rho C terminus-specific antibody (magenta) indicate the expression level of Rho and the structural organization of rod photoreceptors. Peanut agglutinin (PNA) staining (green) shows the expression of cone opsins and the structural organization of cone photoreceptors. 4′6′-diamidino-2-phenyl-indole (DAPI) stained the nuclei (blue). The center of the retina is shown in (a) and the retina periphery in (b). Scale bar, 25 μm. (c) The expression levels of photoreceptor-specific genes encoding rod opsin, M cone opsin and S cone opsin were examined by RT-qPCR; three runs were performed. Rod opsin (n = 3, F2,9 = 168.20, p < 0.0001), M cone opsin (n = 3, F2,9 = 7.44, p = 0.0124), and S cone opsin (n = 3, F2,9 = 16.00, p = 0.0011). Total RNA was isolated from the eyes of RhoP23H/P23H mice treated with either vehicle or flavonoids. Relative fold change of these genes' expression was normalized to the expression of Gapdh. Error bars indicate standard deviation (S.D.). The changes in the expression of the genes encoding rod opsin and M cone opsin were significantly different upon treatment with both flavonoids as compared with vehicle-treated control mice. The expression of S cone opsin was significantly upregulated only upon treatment with quercetin but not myricetin. The P-values for the statistically significant changes are indicated in the figure. The nonstatistically different changes are indicated as NS. Statistical analysis was performed for each gene separately, using one-way ANOVA analysis and Bonferroni post hoc tests. (d) Immunoblot analysis examining the changes in the protein expression of Rho (n = 3, F2,9 = 49.41, p < 0.0001) and M cone opsin (n = 3, F2,9 = 6.90, p = 0.0152), in the eyes of RhoP23H/P23H mice treated with either vehicle or flavonoids. Eyes from two mice from each treatment group were pooled to prepare protein extract. The representative immunoblots (upper panels) and quantification of Rho and M cone opsin protein expression levels (lower panel) are shown. Protein bands were quantified by densitometry analysis with ImageJ software. Band intensities were normalized to the intensity of GAPDH. Error bars indicate S.D. The mean of data from three independent experiments is shown. The P-values for the statistically significant changes are indicated in the figure. The nonstatistically different changes are indicated as NS. Statistical analysis was performed for each protein separately using one-way ANOVA and Bonferroni post hoc tests. (e) High-performance liquid chromatography (HPLC) elution profile of retinoid oximes extracted from eyes collected from dark-adapted RhoP23H/P23H mice at P21 treated either with quercetin (dark gray line), myricetin (light gray line), or vehicle (black line) (left panel); three HPLC runs were performed (n = 3, F2,9 = 25.16, p = 0.0002). 11-cis-retinal oxime was used as a standard control (dashed black line). Quantification of the 11-cis-retinal oxime concentration per eye in each treatment group (right panel). The P-values for the statistically significant changes are indicated in the figure. The nonstatistically different changes are indicated as NS. Statistical analysis was performed using one-way ANOVA analysis and Bonferroni post hoc tests. V, treated with vehicle, Q, treated with quercetin, M, treated with myricetin
FIGURE 5
FIGURE 5
The effect of flavonoids on retinal function in RhoP23H/P23H mice. Retinal function was examined in RhoP23H/P23H mice at P21 treated with either flavonoids or vehicle (a) and compared with age-matched WT mice (b) by measuring the electroretinography (ERG) responses. Electroretinography (ERG) measurements were carried out in five mice per treatment group (scotopic a-wave, n = 5, F8,108 = 28.88, p < 0.0001; scotopic b-wave, n = 5, F8,108 = 34.81, p < 0.0001; photopic b-wave, n = 5, F6,84 = 78.38, p < 0.0001). The statistically different changes (P < 0.05) in the ERG responses compared between flavonoid-treated and vehicle-treated mice are indicated with asterisks (dark gray for quercetin treatment and light gray for myricetin treatment). Statistical analysis was performed with the two-way ANOVA and post hoc Bonferroni tests
FIGURE 6
FIGURE 6
Protective effect of flavonoids against retinal degeneration in RhoP23H/+ mice. Flavonoids (20 mg/kg bw) or vehicle were administered intraperitoneally (i.p.) to heterozygous RhoP23H/+ mice at P21 every other day, and mice were analyzed at P33. Age-matched WT mice were used as a control. (a) Representative optical coherence tomography (OCT) images of the mouse eyes. ONL, outer nuclear layer; INL, inner nuclear layer. Scale bar, 100 μm. (b) Images of the hematoxylin and eosin (H&E)-stained retinal sections. Scale bar, 50 μm. (c) The thickness of the retinal ONL, the inner and outer segments together (IS+OS), and the OS measured at 0.25, 0.5, 0.75, 1.0, and 1.5 mm from the ONH (ONL, n = 6, F10,175 = 303.50, p < 0.0001; IS+OS, n = 6, F8,140 = 53.72, p < 0.0001; OS, n = 6, F8,142 = 109.9, p < 0.0001). Error bars indicate standard deviation (S.D.). The changes found in mice treated with quercetin but not with myricetin were statistically different as compared with vehicle-treated control mice. The statistically different changes (P < 0.05) are indicated with an asterisk. Statistical analysis was performed with the two-way ANOVA and post hoc Bonferroni tests. (d), Retinal function was examined in RhoP23H/+ mice treated with vehicle or flavonoids at P33 and compared with the age-matched WT mice by measuring the electroretinography (ERG) responses. The ERG measurements were carried out in five mice per treatment group (scotopic a-wave, n = 5, F8,135 = 141.7, p < 0.0001; scotopic b-wave, n = 5, F8,135 = 94.14, p < 0.0001; photopic b-wave, n = 5, F6,105 = 177.4, p < 0.0001). Statistically different changes (P < 0.05) in the ERG responses after treatment with flavonoids compared with vehicle-treated mice were indicted with asterisks (dark gray for quercetin treatment and light gray for myricetin treatment). Statistical analysis was performed with the two-way ANOVA and post hoc Bonferroni tests. V, treated with vehicle, Q, treated with quercetin, M, treated with myricetin
FIGURE 7
FIGURE 7
Effect of flavonoids on photoreceptor survival in RhoP23H/+ mice. (a) Immunohistochemistry in cryosections prepared from eyes collected from RhoP23H/+ mice at P33 treated with either vehicle or flavonoids. Sections stained with an anti-Rho C terminus-specific antibody (magenta) show the expression level of Rho and the structural organization of rod photoreceptors. The peanut agglutinin (PNA) staining (green) shows the expression of cone opsins and the structural organization of cone photoreceptors. DAPI stained the nuclei (blue). Scale bar, 50 μm. (b) Quantification of magenta (upper panel) (n = 3, F3,8 = 123.1, p < 0.0001 or green (lower panel) fluorescence (n = 3, F3,8 = 52.97, p < 0.0001). The changes found in RhoP23H/+ mice treated with flavonoids were statistically different as compared with vehicle-treated control mice. The P-values for statistically different changes are indicated in the figure. The nonstatistically different changes are indicated as NS. Statistical analysis was performed with the one-way ANOVA and post hoc Bonferroni tests. (c) Immunoblot analysis examining the changes in the protein expression of Rho and M cone opsin in the eyes of RhoP23H/+ mice treated with either vehicle or flavonoids. Eyes from two mice from each treatment group were pooled to prepare protein extract. The representative immunoblots are shown. (d) Quantification of protein expression. The expression levels of Rho (Rho, n = 3, F2,9 = 12.80, p = 0.0023; Rho2, n = 3, F2,9 = 10.98, p = 0.0039) and M cone opsin (n = 3, F2,9 = 26.25, p = 0.0002) are shown. The protein bands were quantified by densitometry analysis with ImageJ software. Band intensities were normalized to the intensity of GAPDH. The mean of data from three independent experiments is shown. Error bars indicate standard deviation (S.D.). The P-values for statistically different changes between flavonoid-treated and vehicle-treated groups are indicated in the figure. The nonstatistically different changes are indicated as NS. Statistical analysis was performed for each gene separately using one-way ANOVA analysis and Bonferroni post hoc tests. (e) High-performance liquid chromatography (HPLC) elution profile of retinoid oximes extracted from mouse eyes collected from dark-adapted RhoP23H/+ mice at P33 treated either with quercetin (dark gray line), myricetin (light gray line), or vehicle (black line) (left panel). 11-cis-retinal oxime was used as a standard control (dashed black line). (f) Quantification of the 11-cis-retinal oxime concentration per eye in each treatment group (right panel); three HPLC runs were performed (n = 3, F3,8 = 41.50, p < 0.0001). The P-values for statistically different changes between flavonoid-treated and vehicle-treated groups are indicated in the figure. Statistical analysis was performed using one-way ANOVA analysis and Bonferroni post hoc tests. V, treated with vehicle, Q, treated with quercetin, M, treated with myricetin
FIGURE 8
FIGURE 8
The effect of flavonoids on stress response in RhoP23H/P23H mice related to a P23H mutation in Rho. (a) RNA array of unfolded protein response (UPR) genes. The expression profile of the UPR-linked genes in the RhoP23H/P23H mice at P21 was compared between quercetin-treated and vehicle-treated mice in relation to the expression of these genes in age-matched WT mice. Five mice were used for each treatment group. Fold change is presented as a heat map. Asterisks indicate genes that were validated by RT-qPCR. (b) The expression levels of selected UPR-related and oxidative stress-related genes were examined by RT-qPCR; three runs were performed (Perk1, n = 3, F2,9 = 157.6, p < 0.0001; Atf6, n = 3, F2,9 = 7.69, p = 0.0113; Ire1, n = 3, F2,9 = 8.66, p < 0.008; Grp78, n = 3, F2,9 = 2.38, p = 0.1483; Chop, n = 3, F2,9 = 16.04, p = 0.0011; Kit, n = 3, F2,9 = 12.24, p = 0.0027; Hmox-1, n = 3, F2,9 = 17.03, p = 0.0009; Catalase, n = 3, F2,9 = 14.43, p = 0.0016; Sod1, n = 34, F2,9 = 35.31, p < 0.0001). Total RNA was isolated from the eyes of RhoP23H/P23H mice treated with either flavonoids or vehicle. Relative fold change of these genes' expression was normalized to the expression of Gapdh. Error bars indicate standard deviation (S.D.). The change in the expression of the analyzed genes was significantly reduced upon treatment with both flavonoids. The P-values for statistically different changes are indicated in the figure. Statistical analysis was performed using one-way ANOVA and Bonferroni post hoc tests. (c) The changes in the protein expression of several UPR and oxidative stress-related markers in RhoP23H/P23H mice treated with either flavonoids or vehicle were examined by immunoblotting at P21. The representative immunoblots are shown. (d) Quantification of the protein bands by densitometric analysis using ImageJ software. The band intensities were normalized to the intensity of GAPDH. Error bars indicate S.D. The mean of data from three independent experiments is shown. (Perk1, n = 3, F2,9 = 252.8, p < 0.0001; Atf6, n = 3, F2,9 = 24.64, p < 0.0001; Grp78, n = 3, F2,9 = 19.40, p = 0.0005; Catalase, n = 3, F2,9 = 14.43, p < 0.0001). Statistical analysis was performed for each protein separately using one-way ANOVA and Bonferroni post hoc tests. The P-values for statistically different changes are indicated in the figure. V, treated with vehicle, Q, treated with quercetin, M, treated with myricetin
FIGURE 9
FIGURE 9
The effect of flavonoids on the death of photoreceptors in RhoP23H/+ mice. (a) TUNEL staining performed in mouse eye cryosections. Dying photoreceptors are stained green. Nuclei stained with DAPI are blue. Scale bar, 50 μm. (b) Quantification of TUNEL-positive photoreceptor cells (n = 10, F2,30 = 79.85, p < 0.0001). The number of TUNEL-positive cells in the ONL was reduced in flavonoid-treated mice. Error bars indicate S.D. Statistical analysis was performed with the one-way ANOVA and Bonferroni post hoc tests. (c) The expression levels of cell death marker genes TNF-α and caspase-3 were examined by RT-qPCR; three runs were performed (TNF-α, n = 3, F2,9 = 21.13, p = 0.0004; caspase-3, n = 3, F2,9 = 12.51, p = 0.0025). Relative fold change of these genes' expression was normalized to the expression of Gapdh. Error bars indicate standard deviation (S.D.). The P-values for statistically different changes in the expression of the analyzed genes upon treatment with both flavonoids as compared with vehicle-treated mice are indicated in the figure. Statistical analysis was performed for each gene separately, using one-way ANOVA and Bonferroni post hoc tests. V, treated with vehicle, Q, treated with quercetin, M, treated with myricetin
FIGURE 10
FIGURE 10
Schematic of dual protective effect flavonoids in RP associated with misfolding mutations in Rho. The substitution of Pro23, located in the Rho extracellular N-terminal loop, to His residue results in a structurally unstable receptor prone to aggregation in the endoplasmic reticulum (ER). An overload of misfolded protein induces the unfolded protein response (UPR) signaling and triggers reactive oxygen species (ROS) activation, which under continuous stress leads to the activation of cell death of photoreceptors. However, the binding of quercetin to the mutant Rho restores its WT-like conformation, which inhibits the UPR stress and prevents activation of photoreceptor cell death

Similar articles

Cited by

References

    1. Adekeye A, Haeri M, Solessio E, & Knox BE (2014). Ablation of the proapoptotic genes CHOP or Ask1 does not prevent or delay loss of visual function in a P23H transgenic mouse model of retinitis pigmentosa. PLoS One, 9, e83871. - PMC - PubMed
    1. Athanasiou D, Aguila M, Bellingham J, Kanuga N, Adamson P, & Cheetham ME (2017). The role of the ER stress-response protein PERK in rhodopsin retinitis pigmentosa. Human Molecular Genetics, 26, 4896–4905. - PMC - PubMed
    1. Athanasiou D, Aguila M, Bellingham J, Li W, McCulley C, Reeves PJ, & Cheetham ME (2018). The molecular and cellular basis of rhodopsin retinitis pigmentosa reveals potential strategies for therapy. Progress in Retinal and Eye Research, 62, 1–23. - PMC - PubMed
    1. Behnen P, Felline A, Comitato A, Di Salvo MT, Raimondi F, Gulati S, & Fanelli F (2018). A small chaperone improves folding and routing of rhodopsin mutants linked to inherited blindness. iScience, 4, 1–19. - PMC - PubMed
    1. Chen Y, Chen Y, Jastrzebska B, Golczak M, Gulati S, Tang H, & Palczewski K (2018). A novel small molecule chaperone of rod opsin and its potential therapy for retinal degeneration. Nature Communications, 9, 1976. - PMC - PubMed

Publication types