

Tracer-specific reference tissues selection improves detection of 18 F-FDG, 18 F-florbetapir, and 18 F-flortaucipir PET SUVR changes in Alzheimer's disease
- PMID: 35165964
- PMCID: PMC8996354
- DOI: 10.1002/hbm.25774
Tracer-specific reference tissues selection improves detection of 18 F-FDG, 18 F-florbetapir, and 18 F-flortaucipir PET SUVR changes in Alzheimer's disease
Abstract
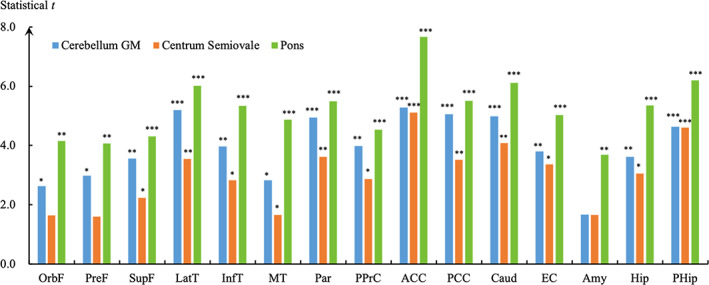
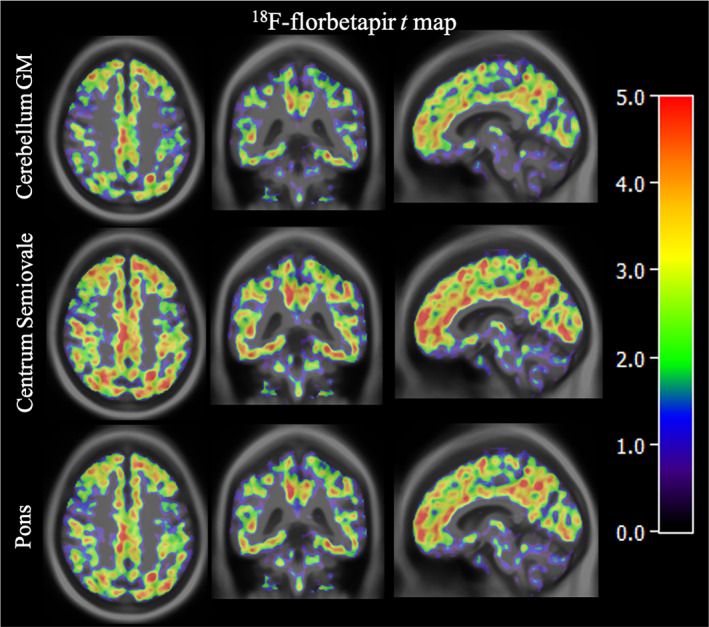
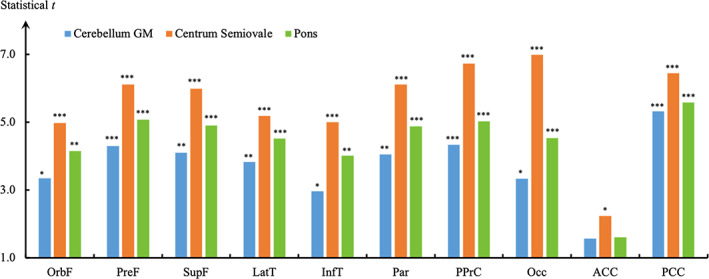
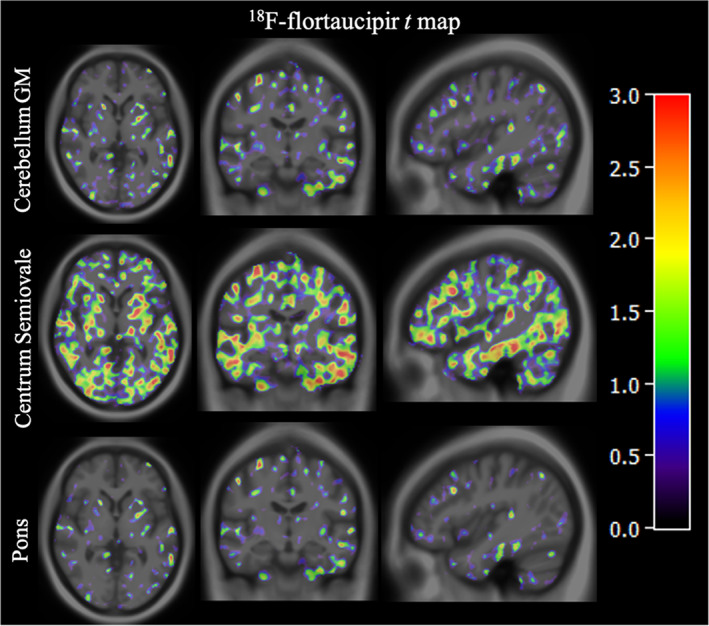
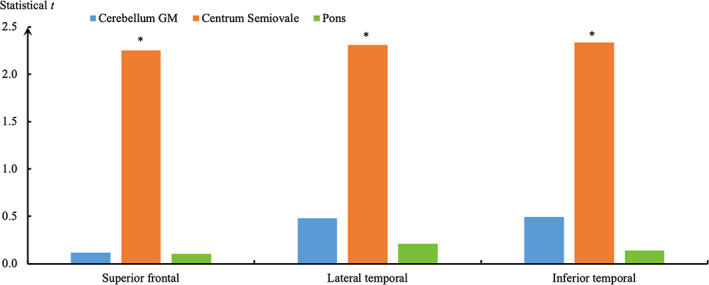
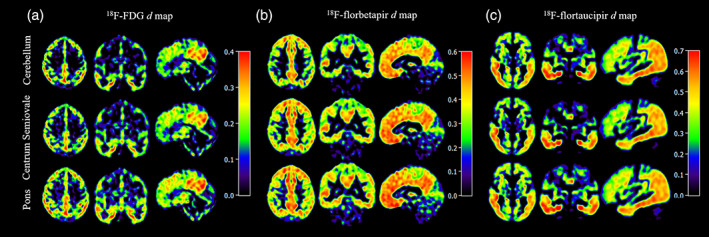
This study sought to identify a reference tissue-based quantification approach for improving the statistical power in detecting changes in brain glucose metabolism, amyloid, and tau deposition in Alzheimer's disease studies. A total of 794, 906, and 903 scans were included for 18 F-FDG, 18 F-florbetapir, and 18 F-flortaucipir, respectively. Positron emission tomography (PET) and T1-weighted images of participants were collected from the Alzheimer's disease Neuroimaging Initiative database, followed by partial volume correction. The standardized uptake value ratios (SUVRs) calculated from the cerebellum gray matter, centrum semiovale, and pons were evaluated at both region of interest (ROI) and voxelwise levels. The statistical power of reference tissues in detecting longitudinal SUVR changes was assessed via paired t-test. In cross-sectional analysis, the impact of reference tissue-based SUVR differences between cognitively normal and cognitively impaired groups was evaluated by effect sizes Cohen's d and two sample t-test adjusted by age, sex, and education levels. The average ROI t values of pons were 86.62 and 38.40% higher than that of centrum semiovale and cerebellum gray matter in detecting glucose metabolism decreases, while the centrum semiovale reference tissue-based SUVR provided higher t values for the detection of amyloid and tau deposition increases. The three reference tissues generated comparable d images for 18 F-FDG, 18 F-florbetapir, and 18 F-flortaucipir and comparable t maps for 18 F-florbetapir and 18 F-flortaucipir, but pons-based t map showed superior performance in 18 F-FDG. In conclusion, the tracer-specific reference tissue improved the detection of 18 F-FDG, 18 F-florbetapir, and 18 F-flortaucipir PET SUVR changes, which helps the early diagnosis, monitoring of disease progression, and therapeutic response in Alzheimer's disease.
Keywords: 18F-FDG; 18F-florbetapir; 18F-flortaucipir; Alzheimer's disease; reference tissue.
© 2022 United Imaging Healthcare. Human Brain Mapping published by Wiley Periodicals LLC.
Conflict of interest statement
The authors have declared no conflicts of interest for this article.
Figures


References
-
- Alexander, G. E. , Chen, K. , Pietrini, P. , Rapoport, S. I. , & Reiman, E. M. (2002). Longitudinal PET evaluation of cerebral metabolic decline in dementia: A potential outcome measure in Alzheimer's disease treatment studies. The American Journal of Psychiatry, 159(5), 738–745. 10.1176/appi.ajp.159.5.738 - DOI - PubMed
-
- Barret, O. , Alagille, D. , Sanabria, S. , Comley, R. A. , Weimer, R. M. , Borroni, E. , & Morley, T. (2017). Kinetic modeling of the tau PET tracer 18F‐AV‐1451 in human healthy volunteers and Alzheimer disease subjects. Journal of Nuclear Medicine, 58(7), 1124–1131. - PubMed
-
- Bilgel, M. , Beason‐Held, L. , An, Y. , Zhou, Y. , Wong, D. F. , & Resnick, S. M. (2020). Longitudinal evaluation of surrogates of regional cerebral blood flow computed from dynamic amyloid PET imaging. Journal of Cerebral Blood Flow and Metabolism, 40(2), 288–297. 10.1177/0271678X19830537 - DOI - PMC - PubMed
-
- Blautzik, J. , Brendel, M. , Sauerbeck, J. , Kotz, S. , Scheiwein, F. , Bartenstein, P. , & Alzheimer's Disease Neuroimaging Initiative . (2017). Reference region selection and the association between the rate of amyloid accumulation over time and the baseline amyloid burden. European Journal of Nuclear Medicine and Molecular Imaging, 44(8), 1364–1374. 10.1007/s00259-017-3666-8 - DOI - PubMed
Publication types
MeSH terms
Substances
Grants and funding
LinkOut - more resources
Full Text Sources
Medical
