Cortical and white matter lesion topology influences focal corpus callosum atrophy in multiple sclerosis
- PMID: 35165979
- PMCID: PMC9305945
- DOI: 10.1111/jon.12977
Cortical and white matter lesion topology influences focal corpus callosum atrophy in multiple sclerosis
Abstract
Background and purpose: Corpus callosum (CC) atrophy is a strong predictor of multiple sclerosis (MS) disability but the contributing pathological mechanisms remain uncertain. We aimed to apply advanced MRI to explore what drives the often nonuniform callosal atrophy.
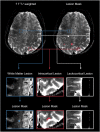
Methods: Prospective brain 7 Tesla and 3 Tesla Human Connectom Scanner MRI were performed in 92 MS patients. White matter, leukocortical, and intracortical lesions were manually segmented. FreeSurfer was used to segment the CC and topographically classify lesions per lobe or as deep white matter lesions. Regression models were calculated to predict focal CC atrophy.
Results: The frontal and parietal lobes contained the majority (≥80%) of all lesion classifications in both relapsing-remitting and secondary progressive MS subtypes. The anterior subsection of the CC had the smallest proportional volume difference between subtypes (11%). Deep, temporal, and occipital white matter lesions, and occipital intracortical lesions were the strongest predictors of middle-posterior callosal atrophy (adjusted R2 = .54-.39, P < .01).
Conclusions: Both white matter and cortical lesions contribute to regional corpus callosal atrophy. The lobe-specific lesion topology does not fully explain the inhomogeneous CC atrophy.
Keywords: atrophy; corpus callosum; magnetic resonance imaging; multiple sclerosis.
© 2022 The Authors. Journal of Neuroimaging published by Wiley Periodicals LLC on behalf of American Society of Neuroimaging.
Figures


References
-
- Filippi M, Bar‐Or A, Piehl F, et al. Multiple sclerosis. Nat Rev Dis Primers 2018;4:43. - PubMed
-
- Thompson AJ, Banwell BL, Barkhof F, et al. Diagnosis of multiple sclerosis: 2017 revisions of the McDonald criteria. Lancet Neurol 2018;17:162‐73. - PubMed
-
- Wattjes MP, Ciccarelli O, Reich DS, et al. 2021 MAGNIMS–CMSC–NAIMS consensus recommendations on the use of MRI in patients with multiple sclerosis. Lancet Neurol 2021;20:653‐70. - PubMed
-
- de Lacoste MC, Kirkpatrick JB, Ross ED. Topography of the human corpus callosum. J Neuropathol Exp Neurol 1985;44:578‐91. - PubMed
Publication types
MeSH terms
Grants and funding
LinkOut - more resources
Full Text Sources
Medical

