

Brown adipose tissue activation is not related to hypermetabolism in emphysematous chronic obstructive pulmonary disease patients
- PMID: 35166050
- PMCID: PMC8978002
- DOI: 10.1002/jcsm.12881
Brown adipose tissue activation is not related to hypermetabolism in emphysematous chronic obstructive pulmonary disease patients
Abstract
Background: Brown adipose tissue (BAT) has been primarily researched as a potential target for mitigating obesity. However, the physiological significance of BAT in relation to cachexia remains poorly understood. The objective of this study was to investigate the putative contribution of BAT on different components of energy metabolism in emphysematous chronic obstructive pulmonary disease (COPD) patients.
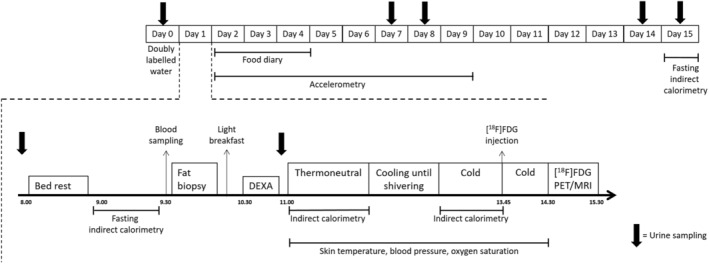
Methods: Twenty COPD patients (mean ± SD age 62 ± 6, 50% female, median [range] BMI 22.4 [15.1-32.5] kg/m2 and 85% low FFMI) were studied. Basal metabolic rate (BMR) was assessed by ventilated hood, total daily energy expenditure (TDEE) by doubly labelled water and physical activity by triaxial accelerometry. BMR was adjusted for fat-free mass (FFM) as assessed by deuterium dilution. Analysis of BAT and WAT was conducted in a subset of ten patients and six age-matched, gender-matched and BMI-matched healthy controls. BAT glucose uptake was assessed by means of cold-stimulated integrated [18F]FDG positron-emission tomography and magnetic resonance imaging. WAT was collected from subcutaneous abdominal biopsies to analyse metabolic and inflammatory gene expression levels. Lung function was assessed by spirometry and body plethysmography and systemic inflammation by high sensitivity C-reactive protein.
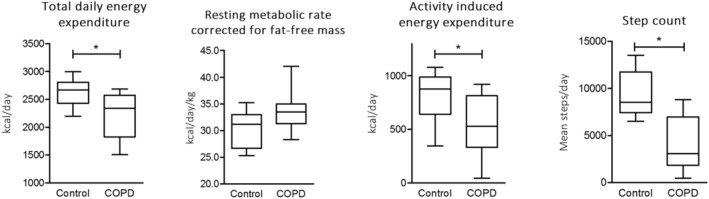
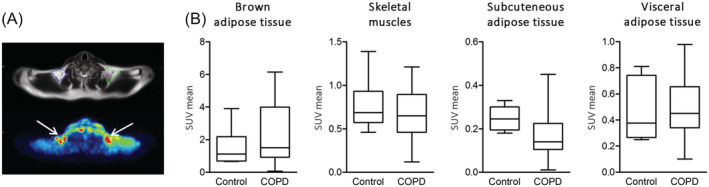
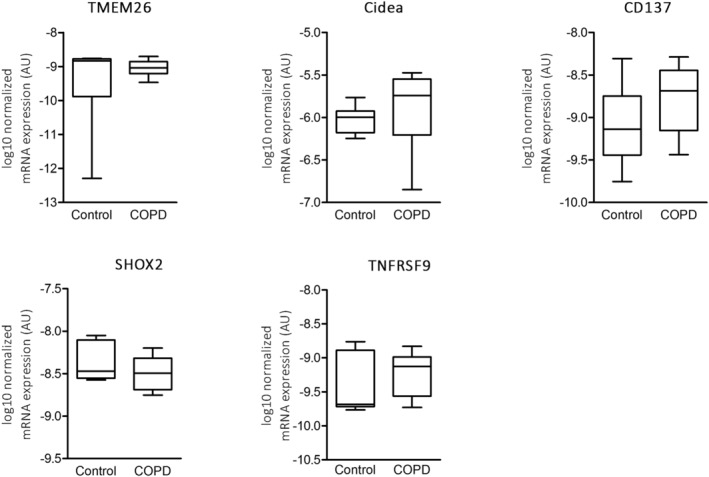
Results: Mean TDEE was 2209 ± 394 kcal/day, and mean BMR was 1449 ± 214 kcal/day corresponding to 120% of predicted. FFM-adjusted BMR did not correlate with lung function or C-reactive protein. Upon cooling, energy expenditure increased, resulting in a non-shivering thermogenesis of (median [range]) 20.1% [3.3-41.3] in patients and controls. Mean BAT glucose uptake was comparable between COPD and controls (1.5 [0.1-6.2] vs. 1.1 [0.7-3.9]). In addition, no correlation was found between BMR adjusted for FFM and BAT activity or between cold-induced non-shivering energy expenditure and BAT activity. Gene expression levels of the brown adipocyte or beige markers were also comparable between the groups. No (serious) adverse events were reported.
Conclusions: Although COPD patients were hypermetabolic at rest, no correlation was found between BMR or TDEE and BAT activity. Furthermore, both BAT activity and gene expression levels of the brown adipocyte or beige markers were comparable between COPD patients and controls.
Keywords: Brown adipose tissue; COPD; Cachexia; Energy metabolism; Muscle wasting.
© 2022 The Authors. Journal of Cachexia, Sarcopenia and Muscle published by John Wiley & Sons Ltd on behalf of Society on Sarcopenia, Cachexia and Wasting Disorders.
Conflict of interest statement
Dr Wierts declared ‘Since 2019 an agreement between GE and the MUMC+ is in place to facilitate site visits for GE Healthcare for PET/CT and SPECT/CT systems’. All other authors declare that they have no relevant conflict of interest.
Figures
References
-
- Vogelmeier CF, Criner GJ, Martinez FJ, Anzueto A, Barnes PJ, Bourbeau J, et al. Global strategy for the diagnosis, management, and prevention of chronic obstructive lung disease 2017 report. GOLD executive summary. Am J Respir Crit Care Med 2017;195:557–582. - PubMed
-
- Schols AM, Soeters PB, Mostert R, Saris WH, Wouters EF. Energy balance in chronic obstructive pulmonary disease. Am Rev Respir Dis 1991;143:1248–1252. - PubMed
-
- Hugli O, Schutz Y, Fitting JW. The daily energy expenditure in stable chronic obstructive pulmonary disease. Am J Respir Crit Care Med 1996;153:294–300. - PubMed
-
- Slinde F, Ellegard L, Gronberg AM, Larsson S, Rossander‐Hulthen L. Total energy expenditure in underweight patients with severe chronic obstructive pulmonary disease living at home. Clin Nutr 2003;22:159–165. - PubMed
-
- van Marken Lichtenbelt WD, Schrauwen P. Implications of nonshivering thermogenesis for energy balance regulation in humans. Am J Physiol Regul Integr Comp Physiol 2011;301:R285–R296. - PubMed
Publication types
MeSH terms
Grants and funding
LinkOut - more resources
Full Text Sources
Research Materials
