. 2022 Feb;27(2):026501.
doi: 10.1117/1.JBO.27.2.026501.

Modular head-mounted cortical imaging device for chronic monitoring of intrinsic signals in mice

Affiliations

Modular head-mounted cortical imaging device for chronic monitoring of intrinsic signals in mice

Mark Christian Guinto et al. J Biomed Opt. 2022 Feb.

Abstract

Significance: Intrinsic optical signals (IOS) generated in the cortical tissue as a result of various interacting metabolic processes are used extensively to elucidate the underlying mechanisms that govern neurovascular coupling. However, current IOS measurements still often rely on bulky, tabletop imaging systems, and there remains a dearth of studies in freely moving subjects. Lightweight, miniature head-mounted imaging devices provide unique opportunities for investigating cortical dynamics in small animals under a variety of naturalistic behavioral settings.

Aim: The aim of this work was to monitor IOS in the somatosensory cortex of wild-type mice by developing a lightweight, biocompatible imaging device that readily lends itself to animal experiments in freely moving conditions.

Approach: Herein we describe a method for realizing long-term IOS imaging in mice using a 0.54-g, compact, CMOS-based, head-mounted imager. The two-part module, consisting of a tethered sensor plate and a base plate, allows facile assembly prior to imaging sessions and disassembly when the sensor is not in use. LEDs integrated into the device were chosen to illuminate the cortical mantle at two different wavelengths in the visible regime (λcenter: 535 and 625 nm) for monitoring volume- and oxygenation state-dependent changes in the IOS, respectively. To test whether the system can detect robust cortical responses, we recorded sensory-evoked IOS from mechanical stimulation of the hindlimbs (HL) of anesthetized mice in both acute and long-term implantation conditions.

Results: Cortical IOS recordings in the primary somatosensory cortex hindlimb receptive field (S1HL) of anesthetized mice under green and red LED illumination revealed robust, multiphasic profiles that were time-locked to the mechanical stimulation of the contralateral plantar hindpaw. Similar intrinsic signal profiles observed in S1HL at 40 days postimplantation demonstrated the viability of the approach for long-term imaging. Immunohistochemical analysis showed that the brain tissue did not exhibit appreciable immune response due to the device implantation and operation. A proof-of-principle imaging session in a freely behaving mouse showed minimal locomotor impediment for the animal and also enabled estimation of blood flow speed.

Conclusions: We demonstrate the utility of a miniature cortical imaging device for monitoring IOS and related hemodynamic processes in both anesthetized and freely moving mice, cueing potential for applications to some neuroscientific studies of sensation and naturalistic behavior.

Keywords: CMOS; chronic imaging; cortical imaging; head-mounted devices; intrinsic optical signal.


Figures

Fig. 1
Fig. 1
Schematic of the modular head-mounted imaging device for monitoring IOS in rodents. (a) Details of the sensor plate containing the CMOS image sensor and LEDs (λcenter,green=535  nm and λcenter,red=625  nm) embedded on a PCB. A black ink used for light shielding was not drawn for clarity. Scale bar: 2 mm. (b) Assembly of the sensor plate (shown turned over) and the head plate as implanted on the mouse prior to imaging. Both plates are fitted with FOPs that serve as protective covering and as a window into the exposed cortex. Wires connecting the sensor plate to the interface board are omitted for simplicity. Scale bar: 2 mm. (c) Photograph of the CMOS image sensor chip (124  px×268  px) with the four pads indicated: clock (clk), VDD, output (VOUT), and ground (gnd). Scale bar: 1 mm. (d) Block diagram of the CMOS sensor circuit.
Fig. 2
Fig. 2
IOS imaging in mice using the modular head-mounted device. (a) Block diagram of the combined mechanical stimulation and imaging system. The tact switch is integrated to the microcontroller board. (b) Block diagram of the relay board, consisting of buffers and a noise filter, and the imaging device. (c) Photographs of the sensor plate indicating the placement of the image sensor chip and the LEDs. From left to right: device operating with green LEDs, red LEDs, and both types of LEDs. Scale bar: 3 mm. (d) Left: restrained wild-type C57BL/6 mouse implanted with a head plate, allowing optical access into the left cortical hemisphere. Scale bar: 3 mm. Middle: close-up photograph of a head plate 40-days postimplantation, fixed onto the cranium with dental acrylic. Cortical surface vasculature is clearly visible underneath the FOP. A single unbinned frame of the imaged area (dotted rectangle) as captured by the image sensor is shown as inset. Scale bar: 3 mm (head plate); 200  μm (image sensor, inset). Right: the imaging device, consisting of the sensor plate and head plate, secured on the head of a mouse. (e) Stimulation sequence for the plantar surface of the hindpaw of an anesthetized mouse. The interstimulus interval varies from 90 to 240 s. Each stimulus condition (contralateral or ipsilateral) lasted for 20 consecutive trials.
Fig. 3
Fig. 3
Stimulus-evoked IOS in the HL receptive field (S1HL) of anesthetized wild-type mice, recorded immediately after implantation. (a) Representative line plots of the fractional change in intensity values (ΔI/I0) averaged from five ROIs (20  px×20  px, slightly enlarged in the image for clarity) within the cortical recordings (N=5) and across 20 trials. IOS obtained under red and green illumination modes are plotted on the same graphs; scaling of the y axes was adjusted to clearly distinguish signal peaks. Contralateral stimulation (delivery period indicated by the blue band, 1.5 s) elicited differential IOS profiles. ROIs were selected to predominantly include the parenchyme and exclude large surface vessels. (b) Activity maps constructed from 1.5-s bins of trial-averaged acute cortical recording, revealing darkening and brightening of areas that characterize the phases of IOS profiles. The imaging area is 900  μm×1920  μm. Scale bar: 500  μm. Lookup table (LUT): 2.3×10³ to 1.5×10³ ΔI/I0 (green); 0.5×10³ to 0.5×10³ ΔI/I0 (red). Contralateral HL responses were recorded under green and red LED illumination. Stereotaxic directions are specified L (lateral) and C (caudal). As with (a), stimulation delivery period is indicated by the blue bar that lasts 1.5 s.
Fig. 4
Fig. 4
Stimulus-evoked IOS in the HL receptive field (S1HL) of anesthetized wild-type mice, recorded 40 days postimplantation. (a) Representative line plots of the fractional change in intensity values (ΔI/I0) averaged from five ROIs (20  px×20  px, slightly enlarged in the image for clarity) within the cortical recordings and across 20 trials. IOS obtained under red and green illumination modes are plotted on the same graphs; scaling of the y axes was adjusted to clearly distinguish signal peaks. Contralateral stimulation (delivery period indicated by the blue band, 1.5 s) elicited differential IOS profiles. ROIs were selected to predominantly include the parenchyme and exclude large surface vessels. (b) Activity maps constructed from 1.5-s bins of trial-averaged acute cortical recording, revealing darkening and brightening of areas that characterize the phases of IOS profiles. The imaging area is 900  μm×1920  μm. Scale bar: 500  μm. Contralateral HL responses were recorded under green and red LED illumination. Stereotaxic directions are specified L (lateral) and C (caudal). LUT: 2.3×10³ to 1.5×10³ ΔI/I0 (green); 0.5×10³ to 0.5×10³ ΔI/I0 (red). As with (a), stimulation delivery period is indicated by the blue bar that lasts 1.5 s. Conditions are the same as in Fig. 3.
Fig. 5
Fig. 5
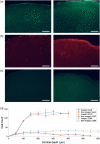
Immunostaining results stained with NeuN, GFAP, and CD68 antibodies for visualization of neuronal cell bodies, astrocytes, and microglia, respectively. (a)–(c) 40-μm coronal sections of the brain of a WT mouse used in an IOS recording session. Micrographs are representative of three mice (N=3) immunostained after IOS recordings under green and red illumination (30 min for each condition; total: 2 h). Left images show a section of the imaged area (irradiated with green and red LEDs for at least 2 h, cumulatively). Right images show corresponding sections in the opposite hemisphere that was not imaged. Scale bar: 200  μm. (d) Cell counts of the neurons (circles), astrocytes (crosses), and microglia (dots), indicating that the brain tissue did not exhibit appreciable immune response due to the device implantation and operation.
Fig. 6
Fig. 6
In vivo cortical imaging in a freely moving mouse. (a) Still images depicting an awake, freely behaving mouse prior to in vivo imaging session. The area of the enclosure was 30  cm×30  cm (Video 1, MP4, 4.75 MB [URL: https://doi.org/10.1117/1.JBO.27.2.026501.1]). (b) Brain surface image (averaged from 1000 frames) taken under green LED illumination by the device from the experiment. The beige lines indicate the five line ROIs used for the blood flow velocity estimation (Video 2, MP4, 2.10 MB [URL: https://doi.org/10.1117/1.JBO.27.2.026501.2]). Color bar matches the LUT under green illumination: 2.3×10³ to 1.5×10³ ΔI/I0. Scale bar: 200  μm. (c) Activity maps constructed from 1.5-s bins of cortical recording from the freely moving mouse. LUT: 2.3×10³ to 1.5×10³ ΔI/I0 (green); 0.5×10³ to 0.5×10³ ΔI/I0 (red). (d) Results of the kymographic line scans of the five labeled ROIs traced along the blood vessels. Angles θ of the diagonal lines were used to estimate changes in the blood flow speed (ν=F·ΔP·tanθ). ν, blood flow speed; F, frame rate of the recording; ΔP, pixel pitch. The frame rate used was 132.82 fps and the 1000-frame recording lasted 7.52 s. Scale bar: 200  μm (vertical); 0.5 s (horizontal).

Similar articles

Cited by

References

    1. Hillman E. M. C., “Optical brain imaging in vivo: techniques and applications from animal to man,” J. Biomed. Opt. 12, 051402 (2007).JBOPFO10.1117/1.2789693 - DOI - PMC - PubMed
    1. Liao L.-D., et al. , “Neurovascular coupling: in vivo optical techniques for functional brain imaging,” BioMed. Eng. OnLine 12, 38 (2013).10.1186/1475-925X-12-38 - DOI - PMC - PubMed
    1. Pittet M. J., Weissleder R., “Intravital imaging,” Cell 147(5), 983–991 (2011).CELLB510.1016/j.cell.2011.11.004 - DOI - PMC - PubMed
    1. Vanni M. P., et al. , “Mesoscale mapping of mouse cortex reveals frequency-dependent cycling between distinct macroscale functional modules,” J. Neurosci. 37(31), 7513–7533 (2017).JNRSDS10.1523/JNEUROSCI.3560-16.2017 - DOI - PMC - PubMed
    1. Schuett S., Bonhoeffer T., Hübener M., “Mapping retinotopic structure in mouse visual cortex with optical imaging,” J. Neurosci. 22(15), 6549–6559 (2002).JNRSDS10.1523/JNEUROSCI.22-15-06549.2002 - DOI - PMC - PubMed

Publication types