

Development and validation of a novel nomogram to predict overall survival of patients with moderate to severe chronic kidney disease
- PMID: 35166166
- PMCID: PMC8856074
- DOI: 10.1080/0886022X.2022.2032744
Development and validation of a novel nomogram to predict overall survival of patients with moderate to severe chronic kidney disease
Abstract
Introduction: The risk of death significantly increased from stage 3 chronic kidney disease (CKD) onward. We aimed to construct a novel nomogram to predict the overall survival (OS) of patients afflicted with CKD from stage 3-5.
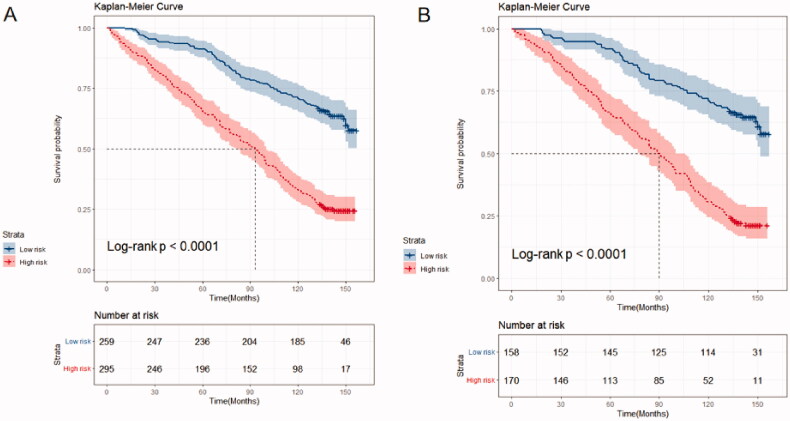
Methods: A total of 882 patients with stage 3-5 CKD were enrolled from the NHANES 2001-2004 survey. Data sets from the 2003-2004 survey population were used to develop a nomogram that would predict the risk of OS. The 2001-2002 survey population was used to validate the nomogram. Least absolute shrinkage and selection operator (Lasso) regression was conducted to screen the significant predictors relative to all-cause death. The multivariate Cox regression based on the screened factors was applied to effectively construct the nomogram. The performance of the nomogram was evaluated according to the C-index, the area under the receiver operating characteristic curve (AUC), and the calibration curve with 1000 bootstraps resample. Kaplan-Meier's curves were used for testing the discrimination of the prediction model.
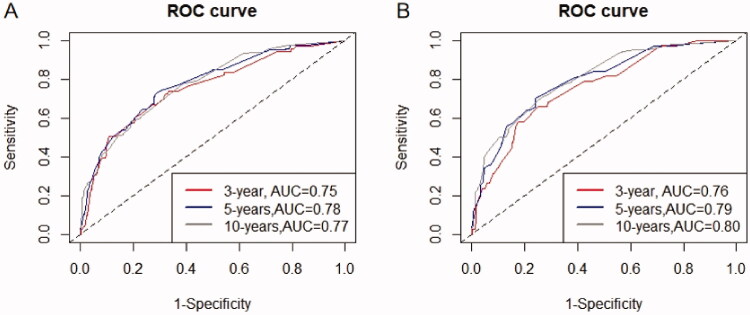
Results: Five variables (age, urinary albumin-to-creatinine ratio (UACR), potassium, cystatin C (Cys C), and homocysteine) were screened by the Lasso regression. The nomogram was constructed using these factors, as well as the CKD stage. The included factors (age, CKD stage, UACR, potassium, Cys C, and homocysteine) were all significantly related to the death of CKD patients, according to the multivariate Cox regression analysis. The internal validation showed that this nomogram demonstrates good discrimination and calibration (adjusted C-index: 0.70; AUC of 3-, 5-, and 10-year OS were 0.75, 0.78, and 0.77, respectively). External validation also demonstrated exceedingly similar results (C-index: 0.72, 95% CI: 0.69-0.76; AUC of 3-, 5-, and 10-year OS were 0.76, 0.79, and 0.80, respectively).
Conclusions: This study effectively constructed a novel nomogram that incorporates CKD stage, age, UACR, potassium, Cys C, and homocysteine, which can be conveniently used to facilitate the individualized prediction of survival probability in patients with stage 3-5 CKD. It displays valuable potential for clinical application.
Keywords: Chronic kidney disease; clinical application; mortality; nomogram; overall survival.
Conflict of interest statement
The authors have no conflicts of interest to declare.
Figures


References
-
- Go AS, Chertow GM, Fan D, et al. . Chronic kidney disease and the risks of death, cardiovascular events, and hospitalization. N Engl J Med. 2004;351(13):1296–1305. - PubMed
Publication types
MeSH terms
LinkOut - more resources
Full Text Sources
Medical