. 2022 Feb 15;132(4):e141848.
doi: 10.1172/JCI141848.

Age-related GSK3β overexpression drives podocyte senescence and glomerular aging

Affiliations

Age-related GSK3β overexpression drives podocyte senescence and glomerular aging

Yudong Fang et al. J Clin Invest. .

Abstract

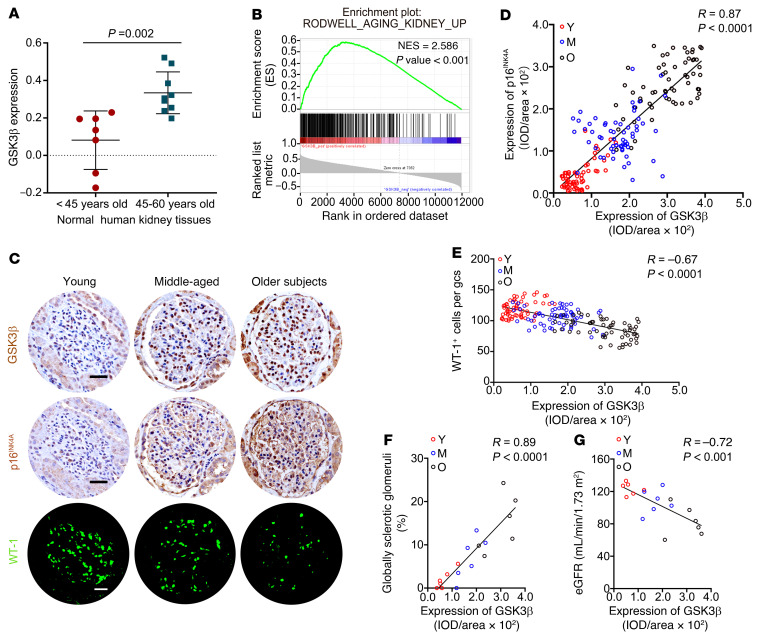
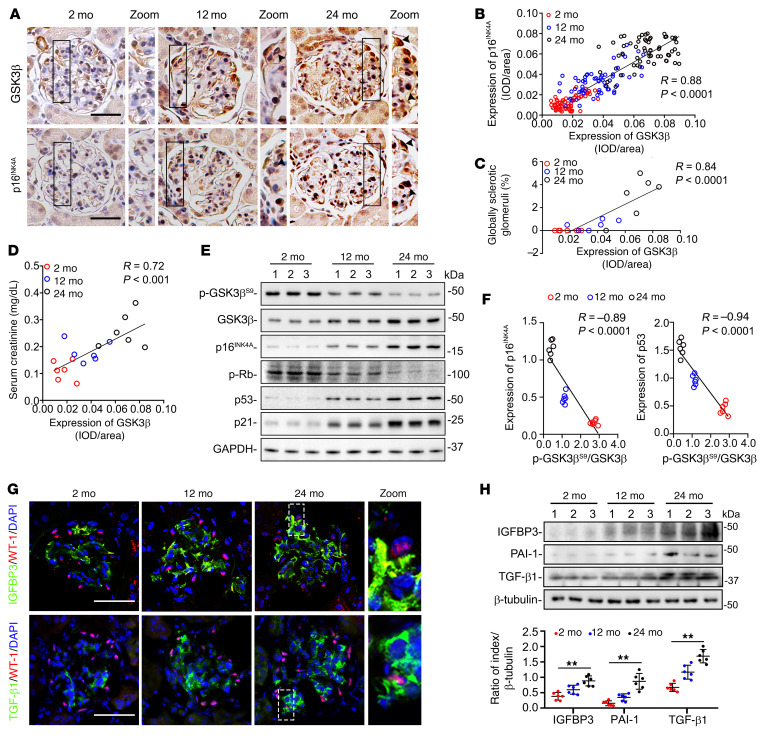
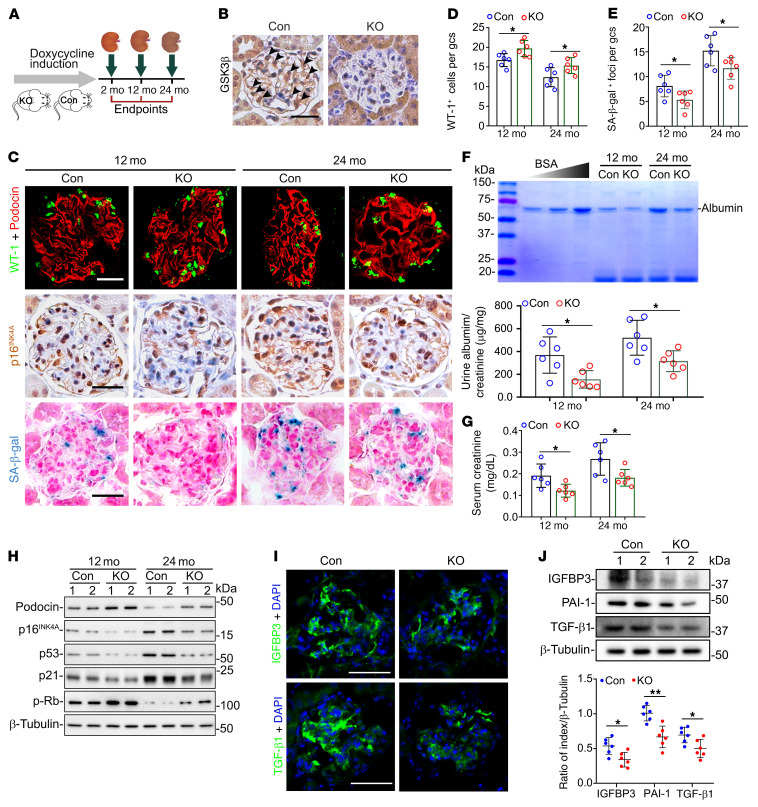
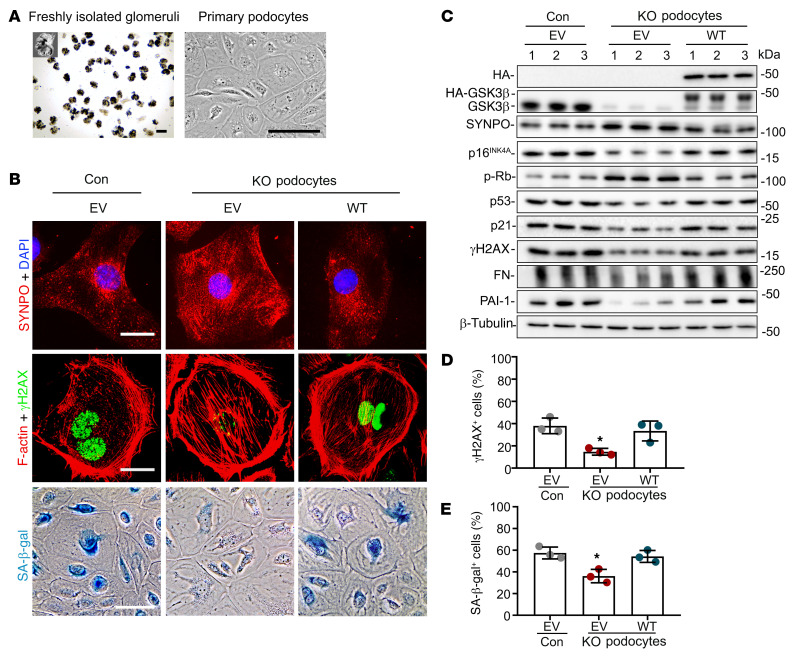
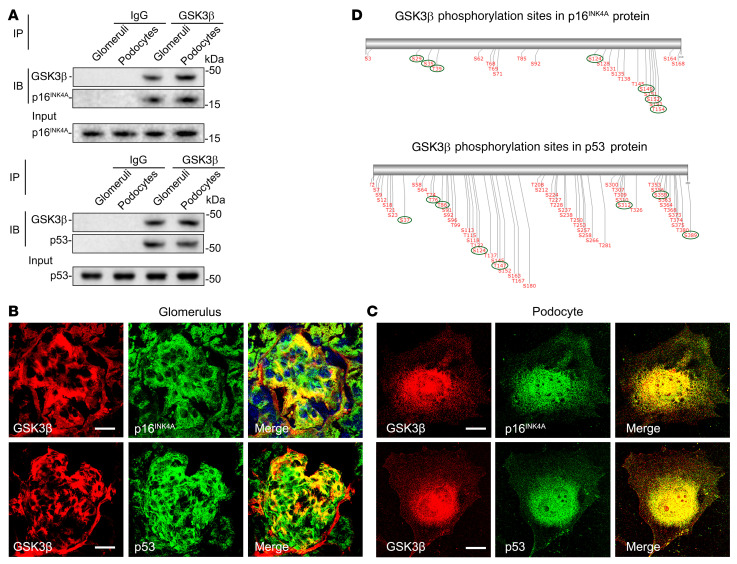
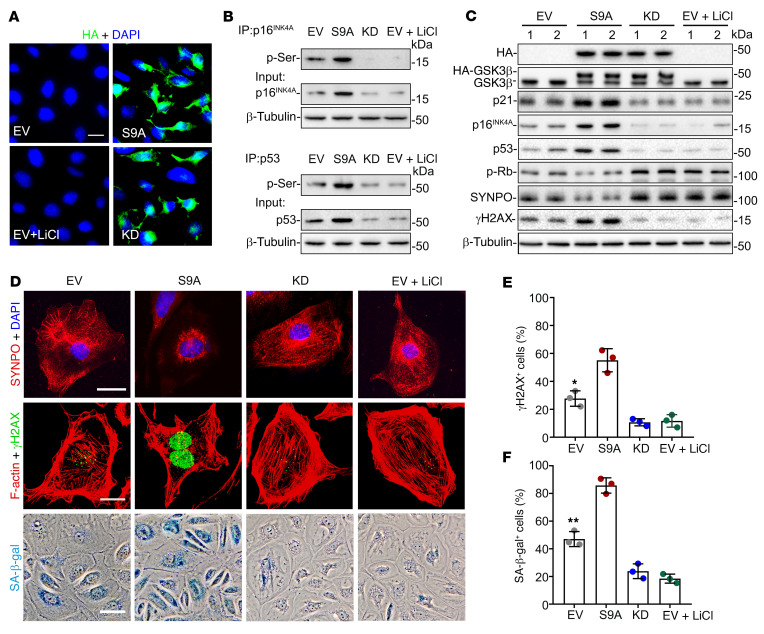
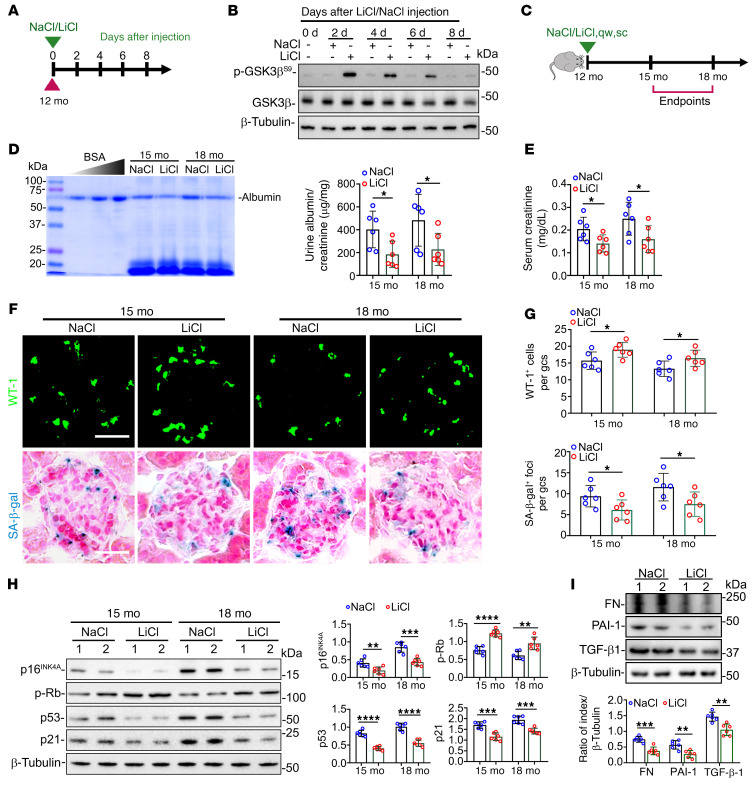
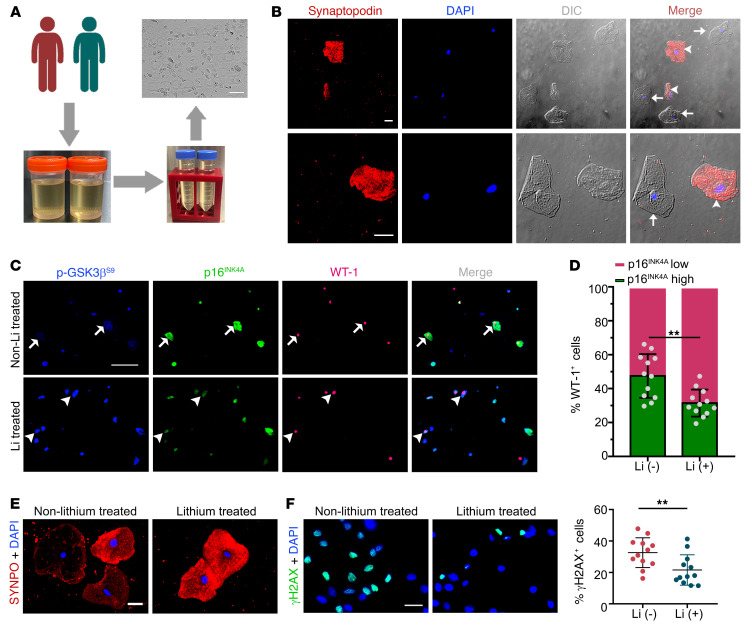
As life expectancy continues to increase, clinicians are challenged by age-related renal impairment that involves podocyte senescence and glomerulosclerosis. There is now compelling evidence that lithium has a potent antiaging activity that ameliorates brain aging and increases longevity in Drosophila and Caenorhabditis elegans. As the major molecular target of lithium action and a multitasking protein kinase recently implicated in a variety of renal diseases, glycogen synthase kinase 3β (GSK3β) is overexpressed and hyperactive with age in glomerular podocytes, correlating with functional and histological signs of kidney aging. Moreover, podocyte-specific ablation of GSK3β substantially attenuated podocyte senescence and glomerular aging in mice. Mechanistically, key mediators of senescence signaling, such as p16INK4A and p53, contain high numbers of GSK3β consensus motifs, physically interact with GSK3β, and act as its putative substrates. In addition, therapeutic targeting of GSK3β by microdose lithium later in life reduced senescence signaling and delayed kidney aging in mice. Furthermore, in psychiatric patients, lithium carbonate therapy inhibited GSK3β activity and mitigated senescence signaling in urinary exfoliated podocytes and was associated with preservation of kidney function. Thus, GSK3β appears to play a key role in podocyte senescence by modulating senescence signaling and may be an actionable senostatic target to delay kidney aging.

Keywords: Aging; Bipolar disorder; Cellular senescence; Cytoskeleton; Nephrology.


Figures

Figure 1
Figure 1. GSK3β expression in glomeruli increases with age and is mainly localized to glomerular podocytes.
(A) Post hoc analysis of the renal cortical transcriptome was conducted based on the Nephroseq data set derived from the Rodwell Aging Kidney study, with exclusion of subjects with abnormal serum creatinine levels or blood pressure, or other comorbid conditions. The mRNA expression levels of GSK3β, expressed as log2 median-centered intensity, are shown for subjects aged 45 to 60 years (n = 9) versus younger subjects (n = 7). P value is shown. (B) Gene set enrichment analysis of glomerular transcriptome derived from the Ju CKD Glom data set demonstrated that the expert-curated kidney-aging-related gene set RODWELL_AGING_KIDNEY_UP is enriched in high GSK3β expression phenotype. Normalized enrichment score (NES) and nominal P values are shown. (C) Non-neoplastic nephrectomy specimens were procured from patients of varying ages (young or Y, <30 years old; middle-aged or M, 30 to 59 years old; older subjects or O, 60 to 79 years old) as elaborated in Supplemental Figure 1. Consecutive kidney sections were subjected to immunohistochemical staining for GSK3β and p16INK4A, along with immunofluorescent staining for WT-1. Scale bars: 20 μm. (D and E) Linear regression analyses of the relative glomerular staining intensity of GSK3β and (D) that of p16INK4A or (E) the number of WT-1–positive podocytes per glomerular cross section (gcs) per subject (n = 6 subjects per group, 60 glomeruli analyzed per group with 10 per subject). IOD, integrated optical density. (F and G) Linear regression analyses show that the average relative glomerular staining intensity of GSK3β (F) positively correlated with the percentage of global glomerulosclerosis and (G) inversely correlated with estimated glomerular filtration rate (eGFR) (n = 6). Spearman’s correlation coefficient (R) and P value are shown. Panel A was analyzed with 2-tailed, unpaired Student’s t test. Panels DG were statistically analyzed by linear regression.
Figure 2
Figure 2. GSK3β is overexpressed and hyperactive in glomerular podocytes during the aging process in mice, and is associated with podocyte senescence, senescence-associated secretory phenotypes (SASPs), and kidney aging.
(A) Mice were treated as elaborated in Supplemental Figure 2. Consecutive kidney sections collected at 2, 12, or 24 months of age (mo) were subjected to peroxidase immunohistochemical staining. Zoomed-in views of boxed areas show positive podocyte staining, as indicated by arrowheads. Scale bars: 20 μm and 4 μm (zoomed-in images). (B) Linear regression analysis reveals a significant correlation between the relative glomerular staining intensity of GSK3β and that of p16INK4A, as estimated by computerized morphometric analysis (n = 6 mice, 60 glomeruli were analyzed per group with 10 per mouse). IOD, integrated optical density. (C and D) Linear regression analysis reveals significant correlations between the average relative glomerular staining intensity of GSK3β and (C) the percentage of global glomerulosclerosis or (D) serum creatinine levels (n = 6). (E) Representative immunoblot analysis of isolated glomeruli for indicated proteins. GAPDH served as a loading control. (F) Linear regression analysis showed an inverse correlation between the relative p-GSK3βS9/GSK3β ratios and the relative expression levels of p16INK4A or p53 in glomeruli based on densitometric analysis of immunoblots (n = 6). (G) Kidney tissues were subjected to fluorescent immunohistochemical staining. Zoomed-in views of boxed areas show positive staining for SASP factors in WT-1+ podocytes. Scale bars: 30 μm (left 3 columns) and 3 μm (zoomed-in images). (H) Representative immunoblot of isolated glomeruli analyzed for SASP factors. Densitometric analyses of the expression levels of diverse SASP factors in glomeruli, presented as relative levels normalized to β-tubulin based on immunoblot analysis. **P < 0.01 among different age groups (n = 6). Data are expressed as mean ± SD. Spearman’s correlation coefficient (R) and P value are shown in panels BD and F. Panel H was analyzed by 1-way ANOVA.
Figure 3
Figure 3. Podocyte-specific ablation of GSK3β in mice mitigates podocyte senescence and senescence-associated secretory phenotypes (SASPs) and improves kidney aging.
(A) Schematic diagram illustrates the animal experimental design. (B) Kidney specimens collected from podocyte-specific GSK3β-knockout (KO) and control (Con) mice at 2 months of age (mo) were processed for peroxidase staining for GSK3β, as shown by representative micrographs. Arrowheads indicate GSK3β-positive podocytes. Scale bars: 20 μm. (C) Kidney specimens were subjected to fluorescent immunostaining for WT-1 and podocin, peroxidase immunostaining for p16INK4A, and SA-β-gal activity staining, as shown by representative micrographs. Scale bars: 20 μm. (D and E) The average number of (D) WT-1+ podocytes and (E) SA-β-gal+ foci per glomerular cross section (gcs) by absolute counting. *P < 0.05 (n = 6 mice per group). (F) Spot urine was collected at the indicated time points, and an aliquot (20 μL) was resolved by SDS-PAGE followed by Coomassie brilliant blue staining. Bovine serum albumin (BSA; 1, 2, and 4 μg) served as standard control. Urine samples were processed for albumin ELISA analysis with adjustment for creatinine concentrations. *P < 0.05 (n = 6). (G) Serum creatinine levels in KO mice were significantly lower than those in Con mice. *P < 0.05 (n = 6). (H) Representative immunoblot analysis of glomeruli isolated from Con and KO mice for indicated proteins. β-Tubulin served as a loading control. (I) Kidney specimens collected at 24 months were processed for fluorescent immunohistochemical staining for SASP factors. Scale bars: 50 μm. (J) Representative immunoblot analysis of glomeruli isolated at 24 months for SASP factors. Densitometric analyses of the expression levels of SASP factors in glomeruli, presented as relative levels normalized to β-tubulin based on immunoblot analysis. *P < 0.05, **P < 0.01 (n = 6). Data are expressed as mean ± SD. Panels DG and J were analyzed by 2-tailed, unpaired Student’s t test.
Figure 4
Figure 4. Cellular senescence and senescence-associated secretory phenotypes (SASPs) are mitigated in primary podocytes derived from KO mice and reinstated after GSK3β reconstitution.
(A) Primary podocytes were cultured from glomeruli isolated from 12-month-old control mice (Con) and mice with podocyte-specific GSK3β knockout (KO). Representative micrographs show freshly isolated glomeruli and primary cultures of podocytes. Scale bars: 75 μm. (BE) Primary podocytes were subjected to electroporation-based transfection with either an empty plasmid vector (EV) or a plasmid encoding the HA-conjugated WT GSK3β by using the Amaxa Nucleofection kit. (B) Cells were processed for SA-β-gal activity staining or immunofluorescent staining for synaptopodin (SYNPO; red) or γH2AX (green) followed by counterstaining with DAPI for nuclei or with rhodamine-phalloidin for F-actin (red). Scale bars: 20 μm (top 2 rows) and 30 μm (bottom row). (C) Cell lysates were processed for immunoblot analysis for indicated proteins, including SASP factors like fibronectin (FN) and PAI-1. β-Tubulin served as a loading control. (D) Absolute count of the number of γH2AX+ cells expressed as percentages of the total number of cells per microscopic field. *P < 0.05 versus all other groups (n = 3). (E) Quantification of the SA-β-gal+ cells as percentages of the total number of cells per microscopic field. *P < 0.05 versus all other groups (n = 3). Data are expressed as mean ± SD. Panels D and E were analyzed by 1-way ANOVA followed by Tukey’s test.
Figure 5
Figure 5. p16INK4A and p53 colocalize and physically interact with GSK3β in glomerular podocytes as its putative substrates.
(A) Lysates of differentiated immortalized murine podocytes and homogenates of glomeruli isolated from WT mice were processed for immunoprecipitation (IP) by using an anti-GSK3β antibody or preimmune IgG, followed by immunoblot analysis (IB) of immunoprecipitates for GSK3β, p16INK4A, and p53 in parallel with input controls. (B and C) Dual-color fluorescent immunostaining for GSK3β (red) and p16INK4A (green) or p53 (green) in (B) mouse kidney tissues as revealed by fluorescence microscopy or in (C) cultured murine podocytes as shown by laser scanning confocal fluorescence microscopy. Scale bars: 20 μm. (D) In silico analysis reveals serine/threonine residues in putative consensus motifs for phosphorylation by GSK3β in p16INK4A and p53. The serines and threonines with high prediction scores for GSK3β consensus motifs are marked with green circles.
Figure 6
Figure 6. GSK3β regulates the phosphorylation of p16INK4A and p53, resulting in modulation of senescence signaling in podocytes.
Conditionally immortalized murine podocytes were transiently lipotransfected with a control empty plasmid vector (EV), or plasmids encoding the HA-conjugated dominant-negative kinase dead (KD) mutant of GSK3β or constitutively active (S9A) mutant of GSK3β in the presence or absence of lithium chloride (LiCl, 10 mM) or an equal volume of vehicle. (A) After different treatments, cells were subjected to immunofluorescent staining for HA, which revealed a transfection efficiency of approximately 80%. Scale bar: 20 μm. (B) Whole cell lysates were processed for immunoprecipitation (IP) by using an anti-p16INK4A or -p53 antibody, followed by immunoblot analysis (IB) of immunoprecipitates for phosphorylated serine (p-Ser), in parallel with input controls. (C) Representative immunoblot analysis of cell lysates for indicated molecules. β-Tubulin served as a loading control. (D) Cells were subjected to SA-β-gal activity staining, or to immunofluorescent staining for synaptopodin (SYNPO; red) or γH2AX (green) followed by counterstaining with DAPI for nuclei or with rhodamine-phalloidin for F-actin (red). Scale bars: 20 μm. (E) Absolute count of the number of γH2AX+ cells as percentages of the total number of cells per microscopic field. *P < 0.05 versus all other groups (n = 3). (F) Quantification of the SA-β-gal+ cells as percentages of the total number of cells per microscopic field. **P < 0.01 versus all other groups (n = 3). Data are expressed as mean ± SD. Panels E and F were analyzed by 1-way ANOVA followed by Tukey’s test.
Figure 7
Figure 7. Once-weekly microdose lithium treatment later in life suppresses podocyte senescence and senescence-associated secretory phenotypes (SASPs) in mice, resulting in a retarded renal aging.
(A) Schematic diagram illustrates the pilot experiment to optimize the regimen of lithium therapy in mice. (B) On indicated days (d) after LiCl or NaCl treatment, protein was extracted from whole kidneys (pool of 3 animals per group) for immunoblot analysis for indicated molecules. (C) Schematic diagram illustrates the experimental design in WT aging mice. (D) Spot urine was collected at the indicated month (mo) and an aliquot (20 μL) was resolved by SDS-PAGE followed by Coomassie brilliant blue staining. Bovine serum albumin (BSA; 1, 2, and 4 μg) served as standard control. Urine samples were processed for albumin ELISA analysis with adjustment for creatinine concentrations. *P < 0.05 (n = 6). (E) Renal function was assessed by serum creatinine levels. *P < 0.05 (n = 6). (F) Kidney specimens were subjected to immunofluorescent staining for WT-1 or SA-β-gal activity staining. Scale bars: 20 μm. (G) The average number of WT-1+ cells and SA-β-gal+ foci per glomerular cross section (gcs) by absolute counting. *P < 0.05 (n = 6 mice per group). (H) Representative immunoblot analysis of isolated glomeruli. Densitometric analyses of the expression levels of indicated proteins, presented as relative levels normalized to β-tubulin based on immunoblot analysis. **P < 0.01, ***P < 0.001, ****P < 0.0001 (n = 6). (I) Representative immunoblot analysis of glomeruli isolated at 18 months for SASP factors fibronectin (FN), PAI-1, and TGF-β1. Densitometric analyses of the expression levels of indicated proteins, presented as relative levels normalized to β-tubulin based on immunoblot analysis. **P < 0.01, ***P < 0.001 (n = 6). Data are expressed as mean ± SD. Panels D, E, and GI were analyzed by 2-tailed, unpaired Student’s t test.
Figure 8
Figure 8. Long-term lithium carbonate therapy in psychiatric patients inhibits GSK3β activity and attenuates cellular senescence in urinary exfoliated cells.
(A) Schematic diagram depicts preparation of urinary exfoliated cells from psychiatric patients treated either with lithium carbonate [Li (+), n = 12] or without lithium carbonate [Li (–), n = 12]. Scale bars: 100 μm. (B) Immunofluorescent staining of urinary exfoliated cells for synaptopodin (red) with DAPI counterstaining for nuclei, as shown by fluorescence microscopy and differential interference contrast (DIC) microscopy. Arrowheads indicate synaptopodin-positive podocytes, while arrows indicate synaptopodin-negative urinary cells. Scale bars: 20 μm. (C) Multicolor immunofluorescent staining of urinary exfoliated cells for phosphorylated GSK3β at serine 9 (p-GSK3βS9), p16INK4A, and WT-1. Arrows indicate WT-1–positive urinary podocytes with p-GSK3βS9-lop16hi staining pattern. Arrowheads indicate WT-1–positive urinary podocytes with p-GSK3βS9-hip16lo staining pattern. Scale bars: 100 μm. (D) Quantification of cells with high and low expression of p16INK4A among all WT-1+ urinary cells. **P < 0.01 (n = 12). (E) Immunofluorescent staining of urinary exfoliated cells for synaptopodin (SYNPO) followed by counterstaining with DAPI. Scale bars: 20 μm. (F) Immunofluorescent staining of urine exfoliated cells for γH2AX followed by counterstaining with DAPI. Scale bars: 20 μm. Absolute count of the number of γH2AX-positive cells as percentage of the number of urinary exfoliated cells per microscopic field. **P < 0.01 (n = 12). Data are expressed as mean ± SD. Panels D and F were analyzed by 2-tailed, unpaired Student’s t test.

Comment in

  • GSK3β and the aging kidney.
    Kreidberg JA, Schumacher VA. Kreidberg JA, et al. J Clin Invest. 2022 Feb 15;132(4):e155885. doi: 10.1172/JCI155885. J Clin Invest. 2022. PMID: 35166232 Free PMC article.
  • GSKβ as a target in podocyte aging.
    Shankland SJ, Wessely O. Shankland SJ, et al. Kidney Int. 2022 Sep;102(3):463-465. doi: 10.1016/j.kint.2022.04.041. Epub 2022 Jun 1. Kidney Int. 2022. PMID: 35660495 No abstract available.

References

    1. O’Sullivan ED, et al. Renal aging: causes and consequences. J Am Soc Nephrol. 2017;28(2):407–420. doi: 10.1681/ASN.2015121308. - DOI - PMC - PubMed
    1. Hommos MS, et al. Structural and functional changes in human kidneys with healthy aging. J Am Soc Nephrol. 2017;28(10):2838–2844. doi: 10.1681/ASN.2017040421. - DOI - PMC - PubMed
    1. Zhou XJ, et al. The aging kidney. Kidney Int. 2008;74(6):710–720. doi: 10.1038/ki.2008.319. - DOI - PubMed
    1. Fang Y, et al. The ageing kidney: molecular mechanisms and clinical implications. Ageing Res Rev. 2020;63:101151. doi: 10.1016/j.arr.2020.101151. - DOI - PMC - PubMed
    1. Schmitt R, Melk A. Molecular mechanisms of renal aging. Kidney Int. 2017;92(3):569–579. doi: 10.1016/j.kint.2017.02.036. - DOI - PubMed

Publication types

Substances