. 2022 Feb 15;132(4):e149464.
doi: 10.1172/JCI149464.

LPAR1 regulates enteric nervous system function through glial signaling and contributes to chronic intestinal pseudo-obstruction

Affiliations

LPAR1 regulates enteric nervous system function through glial signaling and contributes to chronic intestinal pseudo-obstruction

Mohammad M Ahmadzai et al. J Clin Invest. .

Abstract

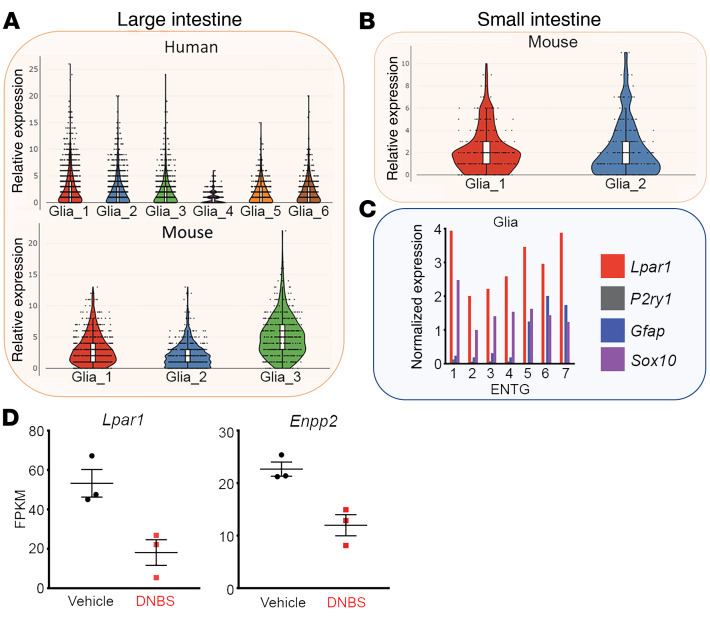
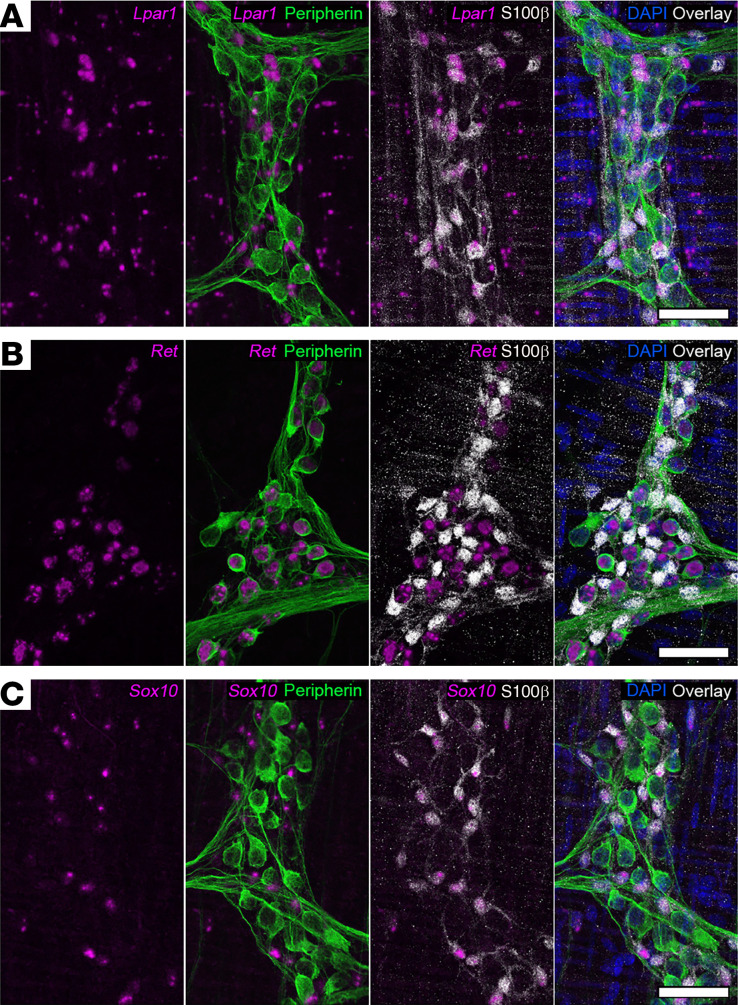
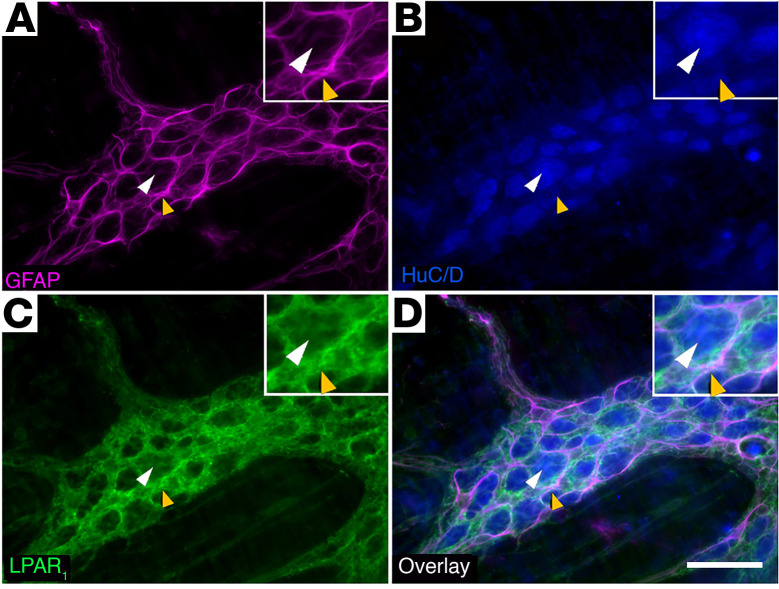
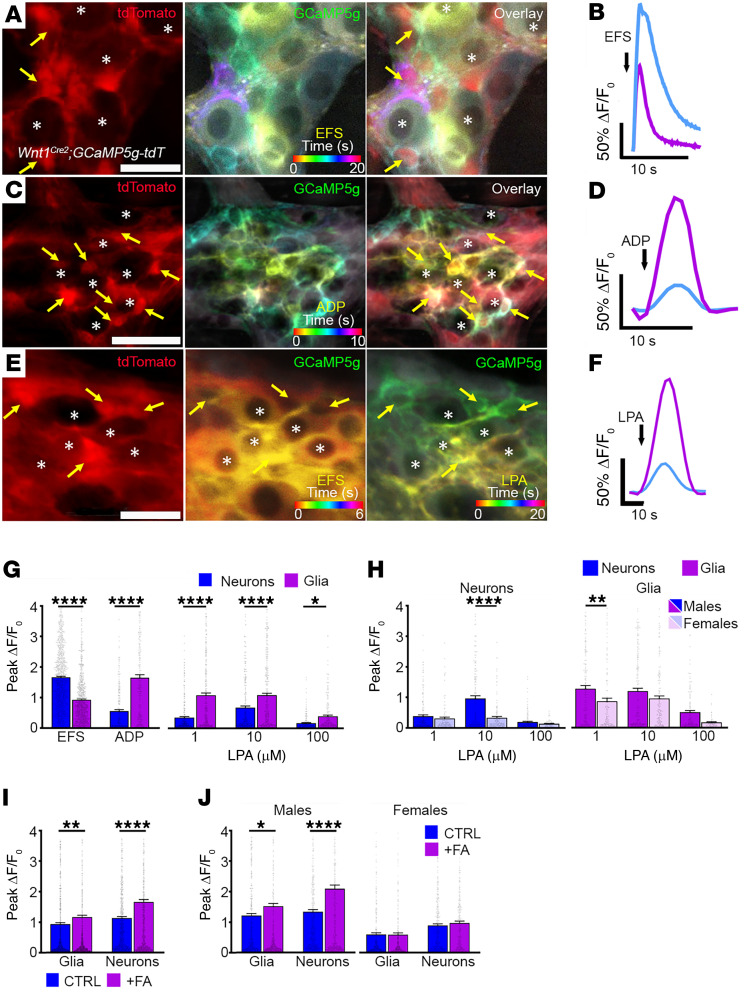
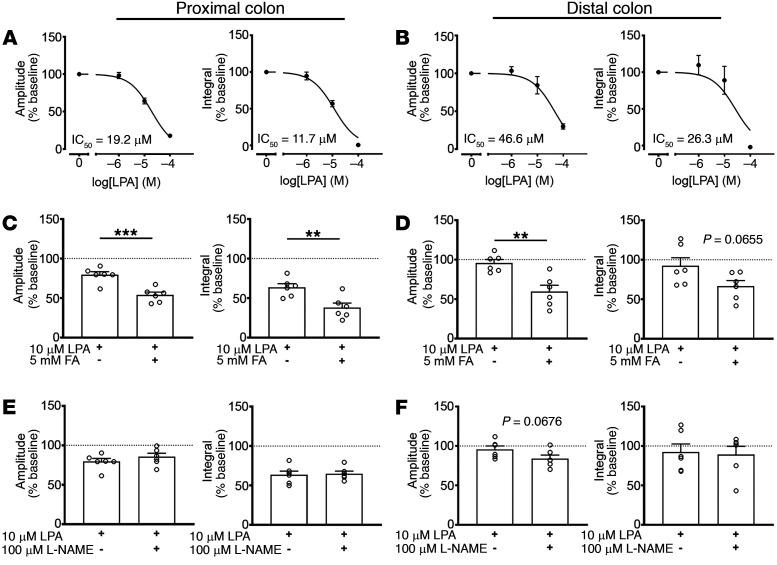
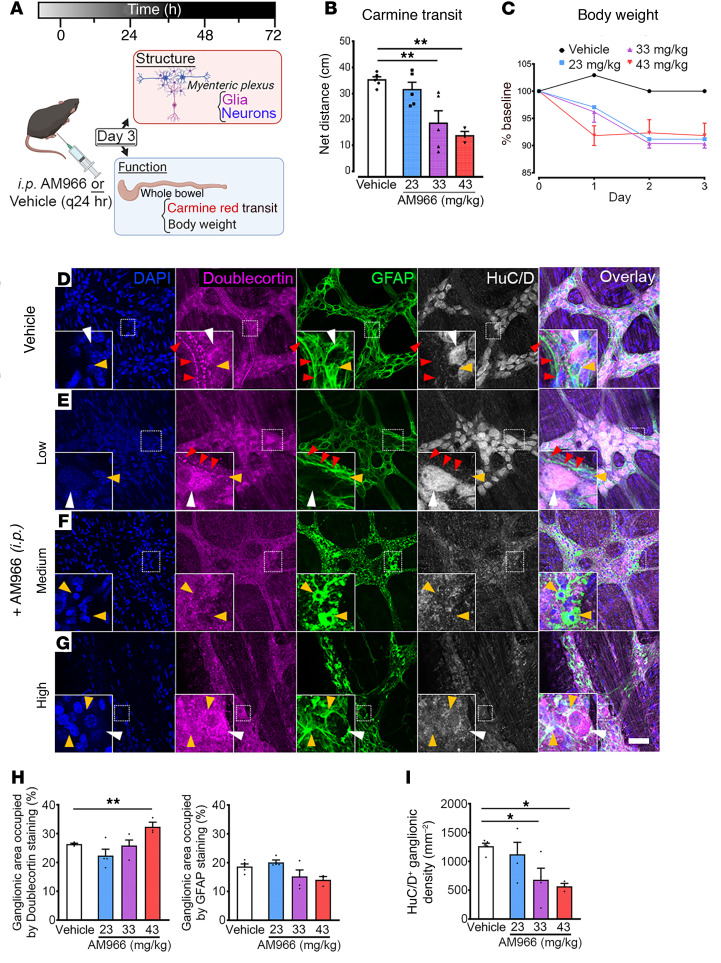
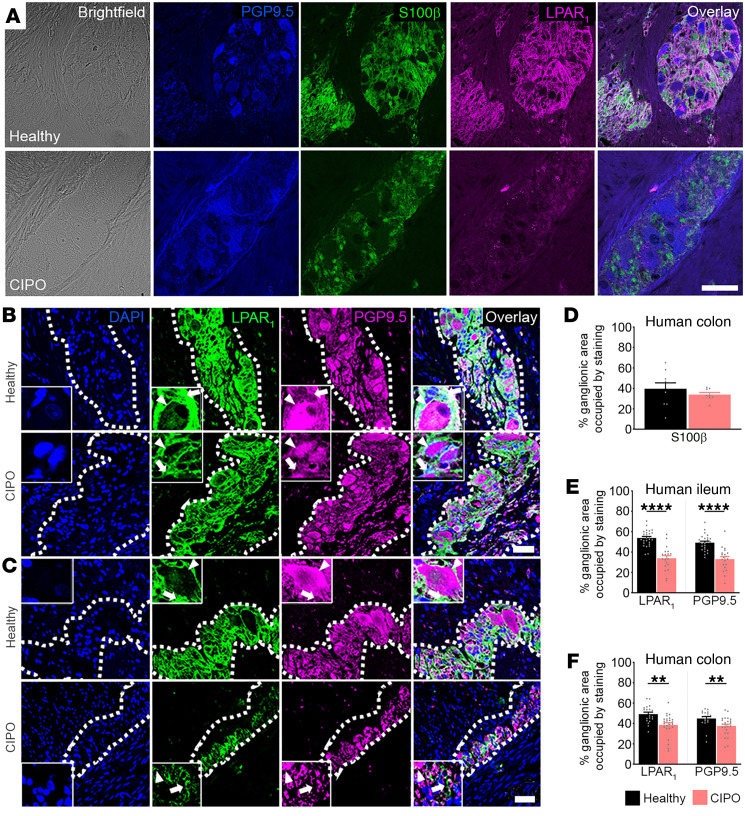
Gastrointestinal motility disorders involve alterations to the structure and/or function of the enteric nervous system (ENS) but the causal mechanisms remain unresolved in most cases. Homeostasis and disease in the ENS are processes that are regulated by enteric glia. Signaling mediated through type I lysophosphatidic acid receptors (LPAR1) has recently emerged as an important mechanism that contributes to disease, in part, through effects on peripheral glial survival and function. Enteric glia express LPAR1 but its role in ENS function and motility disorders is unknown. We used a combination of genetic, immunohistochemical, calcium imaging, and in vivo pharmacological approaches to investigate the role of LPAR1 in enteric glia. LPAR1 was enriched in enteric glia in mice and humans and LPA stimulated intracellular calcium responses in enteric glia, subsequently recruiting activity in a subpopulation of myenteric neurons. Blocking LPAR1 in vivo with AM966 attenuated gastrointestinal motility in mice and produced marked enteric neuro- and gliopathy. Samples from humans with chronic intestinal pseudo-obstruction (CIPO), a severe motility disorder, showed reduced glial LPAR1 expression in the colon and ileum. These data suggest that enteric glial LPAR1 signaling regulates gastrointestinal motility through enteric glia and could contribute to severe motility disorders in humans such as CIPO.

Keywords: Calcium signaling; G protein–coupled receptors; Gastroenterology; Homeostasis; Neuroscience.


Conflict of interest statement

Conflict of interest: The authors have declared that no conflict of interest exists.

Figures

Figure 1
Figure 1. LPAR1/Lpar1 gene expression in mouse and human enteric glia.
(A and B) Single-cell RNA sequencing data sourced from ref. 40, showing LPAR1/Lpar1 expression among enteric glial subtypes in the human (A, top) and mouse (A, bottom) large intestine and mouse small intestine (B). (C) Single-cell RNA sequencing data sourced from ref. 39, showing normalized glial Lpar1 expression in comparison to Sox10, Gfap, P2ry1. Expression in enteric neurons is shown in Supplemental Figure 1. (D) Bulk RNA sequencing data sourced from ref. 22, showing that colonic glia exhibit reduced expression of Lpar1 (left) and Enpp2 (right) during acute DNBS-mediated colitis. Enpp2 is an ecto-enzyme that catalyzes production of lysophospholipids acting at LPAR1. FPKM, fragments per kilobase of transcript per million mapped reads.
Figure 2
Figure 2. Distribution of Lpar1 mRNA in the mouse colon myenteric plexus.
(A) Combined in situ hybridization (RNAscope) and immunofluorescence showing Lpar1 mRNA (magenta) expression in combination with markers of neurons (peripherin, green) and glia (S100β, gray). Lpar1 is primarily expressed by S100β-positive glia in the myenteric plexus. (B and C) Validation of RNAscope protocol sensitivity and specificity in the murine ENS. RNAscope probes for Ret (B, leftmost panel, magenta) and Sox10 (C, leftmost panel, magenta) demonstrate neuronal (peripherin, green) and glial (S100β, gray) specificity, respectively. Images are representative of labeling in n = 3 animals. Scale bars in AC = 50 μm.
Figure 3
Figure 3. Distribution of LPAR1 protein expression in the mouse colon myenteric plexus.
Representative example of a myenteric ganglion from the mouse colon labeled with antibodies against glial fibrillary acidic protein (A, GFAP, magenta), HuC/D (B, blue), and LPAR1 (C, green). Overlay shown in D. Note that LPAR1 immunofluorescence is strong in GFAP-positive glia (examples highlighted by yellow arrowheads) and absent in neuron cell bodies (highlighted by white arrowheads). Images are representative of labeling in n = 9 animals. Scale bar in D = 20 μm and it pertains to AD.
Figure 4
Figure 4. LPAR1 activation drives Ca2+ responses in myenteric glia.
Representative examples of Ca2+ responses in single myenteric ganglia from the colons of Wnt1Cre2 GCaMP5g-tdT mice. (A, C, and E) tdT fluorescence (red, left panels) is high in glia and low in neurons in Wnt1Cre2 GCaMP5g-tdT mice. GCaMP5g fluorescence (center and right panels) is broadly distributed among neurons and glia. Panels in A and B (centers) and E (center and right) display representative responses (GCaMP5g fluorescence) to stimuli as a temporal color-coded projection. Representative examples of glia (yellow arrows) and neurons (asterisks) that responded to electrical field stimulations (EFS), ADP, or EFS/18:1 LPA are highlighted (A, C, and E, respectively). Note that EFS evokes broad Ca2+ activity among enteric neurons followed by activity in enteric glia, while responses to ADP and LPA are predominantly confined to glia. (B, D, and F) Quantification of neuron and glial Ca2+ responses evoked by EFS, ADP, and LPA in myenteric ganglia, respectively. (G) Summary of EFS, ADP, and LPA-mediated Ca2+ responses in myenteric neurons and glia. (H) Summary data showing neuronal and glial responses to various concentrations of LPA in samples from male and female mice. (I) Summary data showing neuronal and glial responses to 1 μM LPA in control (CTRL) and fluoroacetate-treated (FA) tissues and (J) their stratification between male and female mice. n = 141–1073 glia and 153–1064 neurons in AJ; *P < .05, **P < .01, and ****P < .0001, by 2-tailed t test and 1-way ANOVA. Scale bars in A and E = 25 μm and in C = 50 μm.
Figure 5
Figure 5. Effects of LPAR1-mediated signaling on intestinal motility.
(A and B) Acute stimulation of LPAR1 with bath-applied 18:1 LPA attenuates CMC contractile force in a concentration-dependent manner. (C and D) Impairing glial metabolism with FA exacerbates the inhibitory effect of 18:1 LPA on CMC contractile force. (E and F) Blocking nNOS activity with L-NAME does not alter the reduction in CMC contractile force following 18:1 LPA. n = 5–6 mice in AF, **P < .01 and ***P < .001, by 2-tailed t test (CF).
Figure 6
Figure 6. Effects of blocking LPAR1-mediated signaling in vivo.
(A) Experimental paradigm illustrating in vivo pharmacological blockade of LPAR1 signaling. (B) Whole gut transit in mice treated with AM966 as measured by carmine red transit. (C) Body weight measurements in mice treated with AM966. (DG) Representative examples of myenteric ganglia from the colons of control and AM966-treated mice immunolabeled for DAPI (nuclei, blue), doublecortin (nascent neurons, magenta), GFAP (glia, green), and HuC/D (neurons, gray). (D) In vehicle-treated colonic tissue, doublecortin staining can be visualized in fiber tracts coursing through the myenteric plexus alongside GFAP-positive fibers. This staining pattern is largely conserved in animals injected with low-dose AM966 (E) but is generally absent at higher doses (F and G). Both moderate (F) and high doses (G) of AM966 injection appeared to promote remodeling of glial morphology in the myenteric plexus with accompanying loss of enteric neurons. This pathological pattern is characterized by diffuse, hyperintense GFAP staining (green-channel). (H) Percentage of ganglionic area of doublecortin and GFAP staining. (I) Ganglionic HuC/D+ neuron density. n = 3–5 mice in BI, *P < .05 and **P < .01, by 1-way ANOVA with Dunnett’s test. Scale bar in D = 50 μm and it pertains to AD.
Figure 7
Figure 7. Glial LPAR1 expression is reduced in humans with CIPO.
(A) Representative images of brightfield, PGP9.5 (blue), S100β (green), and LPAR1 (magenta) in cross-sections from healthy and CIPO human colons (top and bottom rows, respectively) in 8–9 ganglia from 4 patient samples. Note that LPAR1 localizes to enteric glia (S100β) while absent in enteric neurons (PGP9.5). (B) Top: Representative images of LPAR1 (green) and PGP9.5 (magenta) in the healthy human ileum. LPAR1 is expressed by enteric glial cells (white arrow) throughout the myenteric ganglion. By comparison, LPAR1 expression is nearly absent from adjacent enteric neurons (white arrowhead), which express high levels of PGP9.5. Bottom: In CIPO, LPAR1 and PGP9.5 expression is reduced in glia and neurons, respectively. (C) Top: Representative images of LPAR1 (green) and PGP9.5 (magenta) expression in the myenteric plexus of the healthy human colon. Like the ileum, LPAR1 is localized to regions surrounding neurons, indicating glial-specific expression in the human colon. Bottom: LPAR1 and PGP9.5 expression are reduced in CIPO. (D) Semiquantification of cross-sectional protein expression of S100β in healthy and CIPO samples of human colons. Semiquantification of cross-sectional protein expression of LPAR1 and PGP9.5 in CIPO relative to healthy controls in ileum and colon (E and F, respectively). n = 19–27 ganglia from 4–6 patient samples in BF, **P < .01 and ****P < .0001, by 2-tailed t test. Scale bar in A = 50 μm; scale bar in C = 20 μm and it pertains to B and C.

Similar articles

Cited by

References

    1. Palsson OS, et al. Prevalence of Rome IV functional bowel disorders among adults in the United States, Canada, and the United Kingdom. Gastroenterology. 2020;158(5):1262–1273. doi: 10.1053/j.gastro.2019.12.021. - DOI - PubMed
    1. Drossman DA. Functional gastrointestinal disorders: history, pathophysiology, clinical features and Rome IV. Gastroenterology. 2016;150(6):1262–1279. doi: 10.1053/j.gastro.2016.02.032. - DOI - PubMed
    1. De Giorgio R, et al. Chronic intestinal pseudo-obstruction: clinical features, diagnosis, and therapy. Gastroenterol Clin North Am. 2011;40(4):787–807. doi: 10.1016/j.gtc.2011.09.005. - DOI - PubMed
    1. De Giorgio R, et al. New insights into human enteric neuropathies. Neurogastroenterol Motil. 2004;16(s1):143–147. doi: 10.1111/j.1743-3150.2004.00491.x. - DOI - PubMed
    1. Boeckxstaens GE, et al. Abnormal distribution of the interstitial cells of cajal in an adult patient with pseudo-obstruction and megaduodenum. Am J Gastroenterol. 2002;97(8):2120–2126. doi: 10.1111/j.1572-0241.2002.05932.x. - DOI - PubMed

Publication types

Substances