. 2022 Apr 26;34(5):1890-1911.
doi: 10.1093/plcell/koac047.

The maize single-nucleus transcriptome comprehensively describes signaling networks governing movement and development of grass stomata

Affiliations

The maize single-nucleus transcriptome comprehensively describes signaling networks governing movement and development of grass stomata

Guiling Sun et al. Plant Cell. .

Abstract

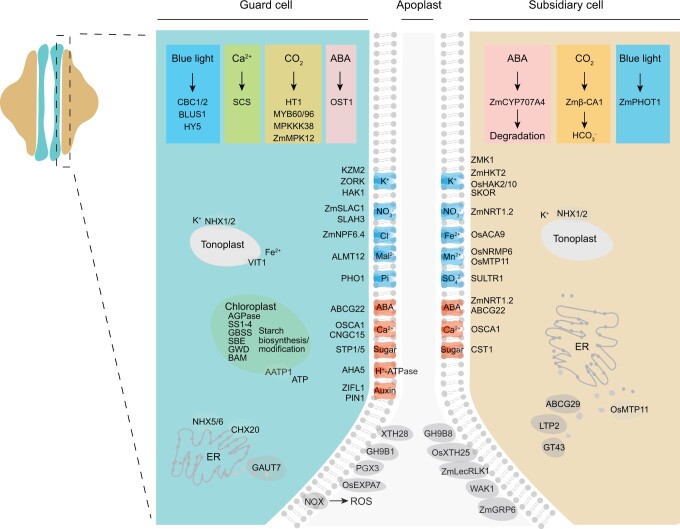
The unique morphology of grass stomata enables rapid responses to environmental changes. Deciphering the basis for these responses is critical for improving food security. We have developed a planta platform of single-nucleus RNA-sequencing by combined fluorescence-activated nuclei flow sorting, and used it to identify cell types in mature and developing stomata from 33,098 nuclei of the maize epidermis-enriched tissues. Guard cells (GCs) and subsidiary cells (SCs) displayed differential expression of genes, besides those encoding transporters, involved in the abscisic acid, CO2, Ca2+, starch metabolism, and blue light signaling pathways, implicating coordinated signal integration in speedy stomatal responses, and of genes affecting cell wall plasticity, implying a more sophisticated relationship between GCs and SCs in stomatal development and dumbbell-shaped guard cell formation. The trajectory of stomatal development identified in young tissues, and by comparison to the bulk RNA-seq data of the MUTE defective mutant in stomatal development, confirmed known features, and shed light on key participants in stomatal development. Our study provides a valuable, comprehensive, and fundamental foundation for further insights into grass stomatal function.


Figures

Figure 1
Figure 1
Cell type identification in snRNA-seq data of the maize peels. A, Visualization of nuclear classification after integrating three maize peel replicates using UMAP. Dots and colors represent individual nuclei and different cell types. PCs-N, PCs without active anthocyanin biosynthesis; PCs-A, PCs with active anthocyanin biosynthesis. B, Dot plot of known marker genes used for cell-type identification. The proportion and average expression levels are, respectively, denoted by the sizes and colors of the circles. The full names and gene IDs are provided in Supplemental Data Set 2. C and D, Expression of ZmGRP6 (Zm00001d045877) and ZmSCS1 (Zm00001d014325) in the epidermis. The expression patterns were analyzed by UMAP plots and promoter-driven ZmHTA6-YFP reporter lines. The YFP fluorescence signals of ZmGRP6 and ZmSCS1 are respectively specific to SCs in transgenic maize (C), and to GCs in transgenic rice (D). The cell outlines are revealed by staining with PI. The cluster assignment in the UMAP plots is shown in Figure 1A. The insets with boxed regions and dashed arrows show the GC cluster at higher resolution. Scale bar = 20 μm. The non-specific expression of ZmGRP6 in GC cluster and ZmSCS1 in SC cluster might be partially due to ambient RNA during nuclei purification.
Figure 2
Figure 2
Transcriptome dynamics and signaling pathway in GCs and SCs. A, Dot plot of photosynthesis-related genes within the different cell types, predominantly in MCs, BSCs, and GCs. B, Dot plots of known genes or orthologs involved in stomatal movement. The proportions and average expression values are, respectively, denoted by the sizes and colors of circles. The gene names are inferred from Arabidopsis and rice orthologs if the cell-type specific or enriched expression not reported in maize. C, Expression of GC and SC marker genes in the epidermis. The expression patterns were analyzed and displayed using UMAP plots, and by the images of the cellular locations of fluorescence from promoter-driven ZmHTA6-YFP reporters in transgenic rice (OST1, Zm00001d033339; ZIFL1, Zm00001d005002; CHX20, Zm00001d035631; CNGC15, Zm00001d017281; and PGX3, Zm00001d040725) and in transgenic maize and rice (ZmLecRLK1, Zm00001d046802). The cell outlines are revealed by staining with PI. The cluster assignment in the UMAP plots is shown in Figure 1A. The insets with boxed regions and dashed arrows show the GC cluster at higher resolution. Scale bar = 20 μm.
Figure 3
Figure 3
Integrated signaling pathways of ABA or CO2 between GCs and SCs that regulate stomatal responses. A, ABA contents in X. laevis oocytes expressing injected transgenic transcripts and the corresponding water-injected control, preloaded with 46 nL of 1 mM (12.1 ng) ABA. The data are presented as means ± se, n = 4, 3 oocytes per replicate. P < 0.01. B, Current–Voltage relationships from TEVC recordings of whole X. laevis oocytes expressing ZmNRT1.2- and the water-injected control. The data are presented as means ± se, n ≥ 12, P < 0.01 by t test. C, Violin plots of ZmCYP707A4 (Zm00001d020717), ZmNRT1.2 (Zm00001d046383), Zmβ-CA1 (Zm00001d044099), and ZmMPK12 (Zm00001d024568). Each point represents the expression value (UMI) in a single cell. D, The volume distributions of GCs and SCs. A total 25 stomatal complexes were measured, comprising 50 GCs and 50 SCs. The data are presented as means ± se, n = 50. The border of the boxes, horizontal lines, and whiskers indicate the first and third quartiles, the median values, the minimum and maximum values, respectively. E, The ABA concentrations in GCs and SCs. ABA concentrations were obtained by ABA content/cell divided by the mean volumes of GCs and SCs. ABA contents were measured for 571–848 SCs and 3,160–4,370 GCs. The border of the boxes, horizontal lines, and whiskers indicate the first and third quartiles, the median values, the minimum and maximum values, respectively. F, Current–voltage relationship from TEVC recordings of whole X. laevis oocytes expressing cRNA combined from OST1+AtSLAC1, AtRHC1 + AtHT1 + OST1 + AtSLAC1, and Zmβ-CA1 + AtRHC1 + AtHT1 + OST1 +  AtSLAC1. OST1 activates SLAC1 and induces anion currents, HCO3 produced by β-CA1 enhances the interaction of RHC1 with HT1 and relieves inhibition of OST1 by HT1, and thus increases anion currents by SLAC1. G, Water-loss measurement of the detached leaves from WT and zmmpk12 mutant maize. The data are presented as means ± se, n ≥ 3, P < 0.01. H, Stomatal conductance of the zmmpk12 mutant under different concentration of CO2. Control, 400 p.p.m; High, 1,200 p.p.m; Low, 50 p.p.m. The data are presented as means ± se, n ≥ 3, P < 0.01 by t test.
Figure 4
Figure 4
Developmental trajectories of maize stomata. A, UMAP visualization of the nuclear classification of the leaf base. Colors represent their respective Louvain components, and curved lines represent cell populations. Cluster 4 lies adjacent to the other four vasculature clusters in the 3D-UMAP plot. B, Dot plot of known marker genes used for the identification of cell types in the developing epidermis. The proportions and average expression levels are, respectively, denoted by the sizes and colors of the circles. C, Developmental stages of stomata defined in this study and visualization of genes along the pseudo-time trajectory of stomatal development produced by Monocle. Colors indicate different cell types/states, and the arrows show the developmental decisions. D–H, Microscope observation of YFP fluorescence in maize and rice transformation lines. D, CST1; (E), ZmGELP1 (Zm00001d040239); (F), ZmGELP2 (Zm00001d018474); G, ZmMPK12 (Zm00001d024568); H, ZmMUM2 (Zm00001d042656). The cell outlines are stained using PI. Scale bar = 20 μm. I, Model of stomatal development according to previous studies and our data. Six main developmental stages are shown: (1) Specification of the stomatal file; (2) GMC formation; (3) Formation and polarization of SMC; (4) Asymmetric division of SMCs to generate SCs; (5) Symmetric division of GMCs producing paired GCs; (6) Differentiation and morphogenesis of the four-celled stomatal complex.
Figure 5
Figure 5
The heatmaps of genes involved in maize stomatal development of different cell types/states and of candidate genes regulated by ZmMUTE. A, The heatmap of marker genes specifically expressed in different cell types/states of maize stomata. B, Venn diagram of the marker genes from bulk RNA-seq data (left) and Cluster 11 of the leaf base snRNA-seq sample (right). C, Expression heatmap of the shared marker genes in the bulk RNA-seq data from ZmMUTE mutants. bzu2, the ZmMUTE mutant. Scale bar = 20 μm.
Figure 6
Figure 6
Model of cell type-specific genes that are potentially involved in maize stomatal movement. The known genes or orthologs involved in stomatal movement are displayed. Transporters of non-signaling cations/anions and signaling molecules are indicated in blue and orange, respectively. Genes in cell wall plasticity are shown in gray. The signaling modules of ABA, CO2, Ca2+, and blue light in GCs and SCs are indicated via different background colors.

Comment in

References

    1. Acevedo-Garcia J, Kusch S, Panstruga R (2014) Magical mystery tour: MLO proteins in plant immunity and beyond. New Phytol 204: 273–281 - PubMed
    1. Alejandro S, Lee Y, Tohge T, Sudre D, Osorio S, Park J, Bovet L, Lee Y, Geldner N, Fernie AR (2012) AtABCG29 is a monolignol transporter involved in lignin biosynthesis. Curr Biol 22: 1207–1212 - PubMed
    1. Apostolakos P, Livanos P, Giannoutsou E, Panteris E, Galatis B (2018) The intracellular and intercellular cross-talk during subsidiary cell formation in Zea mays: existing and novel components orchestrating cell polarization and asymmetric division. Ann Bot 122: 679–696 - PMC - PubMed
    1. Atmodjo MA, Sakuragi Y, Zhu X, Burrell AJ, Mohanty SS, Atwood JA 3rd, Orlando R, Scheller HV, Mohnen D (2011) Galacturonosyltransferase (GAUT)1 and GAUT7 are the core of a plant cell wall pectin biosynthetic homogalacturonan:galacturonosyltransferase complex. Proc Natl Acad Sci USA 108: 20225–20230 - PMC - PubMed
    1. Azoulay-Shemer T, Bagheri A, Wang C, Palomares A, Stephan AB, Kunz HH, Schroeder JI (2016) Starch biosynthesis in guard cells but not in mesophyll cells is involved in CO2-induced stomatal closing. Plant Physiol 171: 788–798 - PMC - PubMed

Publication types

LinkOut - more resources