. 2022 Feb 22;7(1):e0094721.
doi: 10.1128/msystems.00947-21. Epub 2022 Feb 15.

Phenotypic and Genomic Diversification in Complex Carbohydrate-Degrading Human Gut Bacteria

Affiliations

Phenotypic and Genomic Diversification in Complex Carbohydrate-Degrading Human Gut Bacteria

Nicholas A Pudlo et al. mSystems. .

Abstract

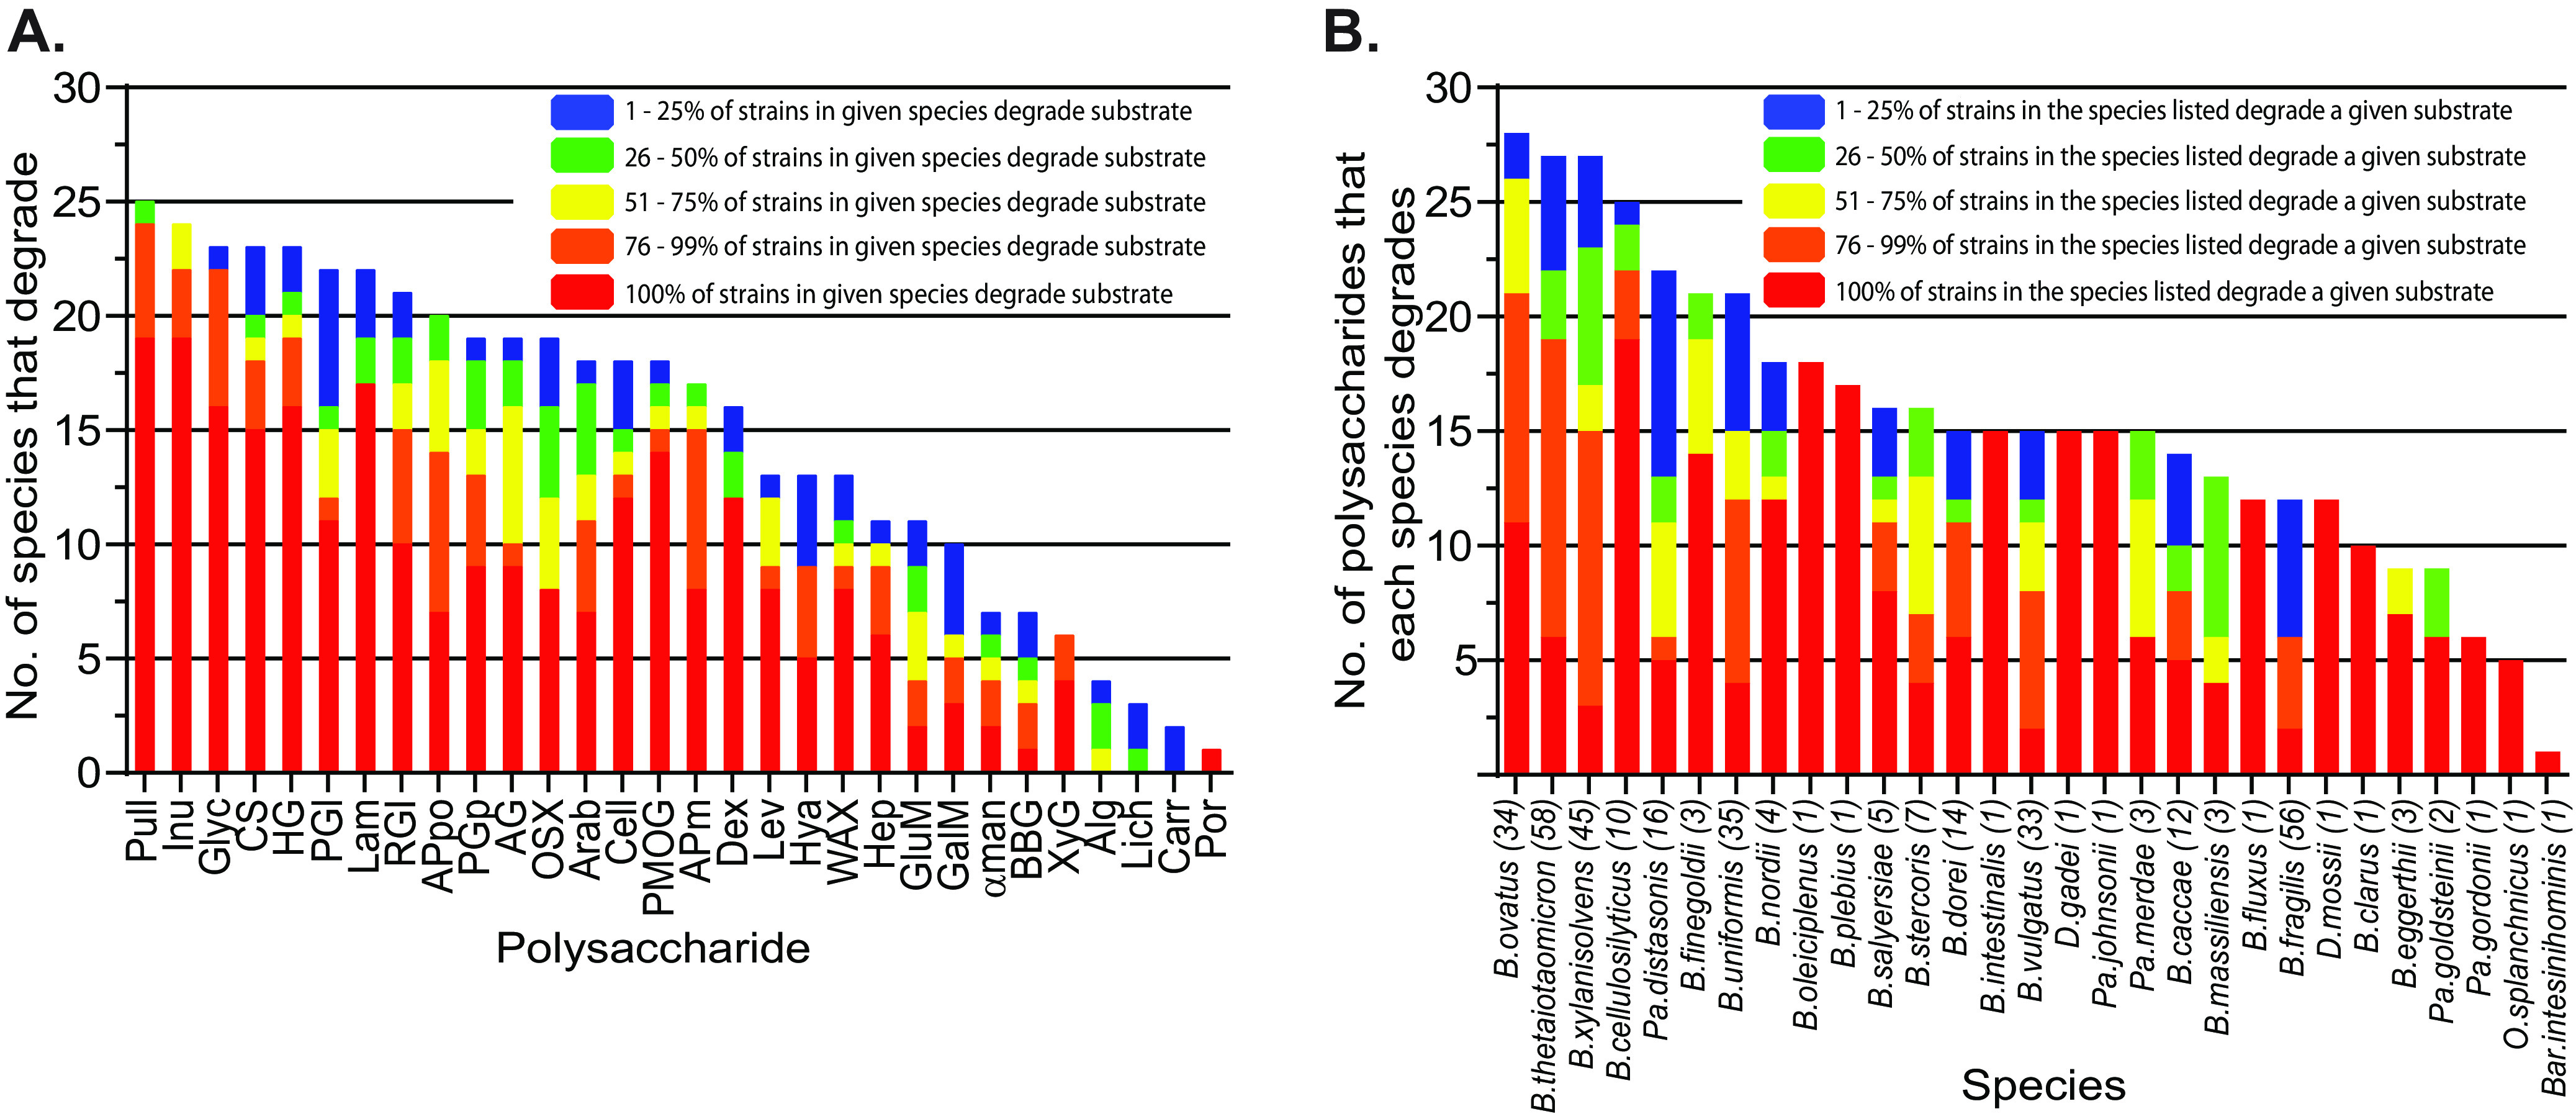
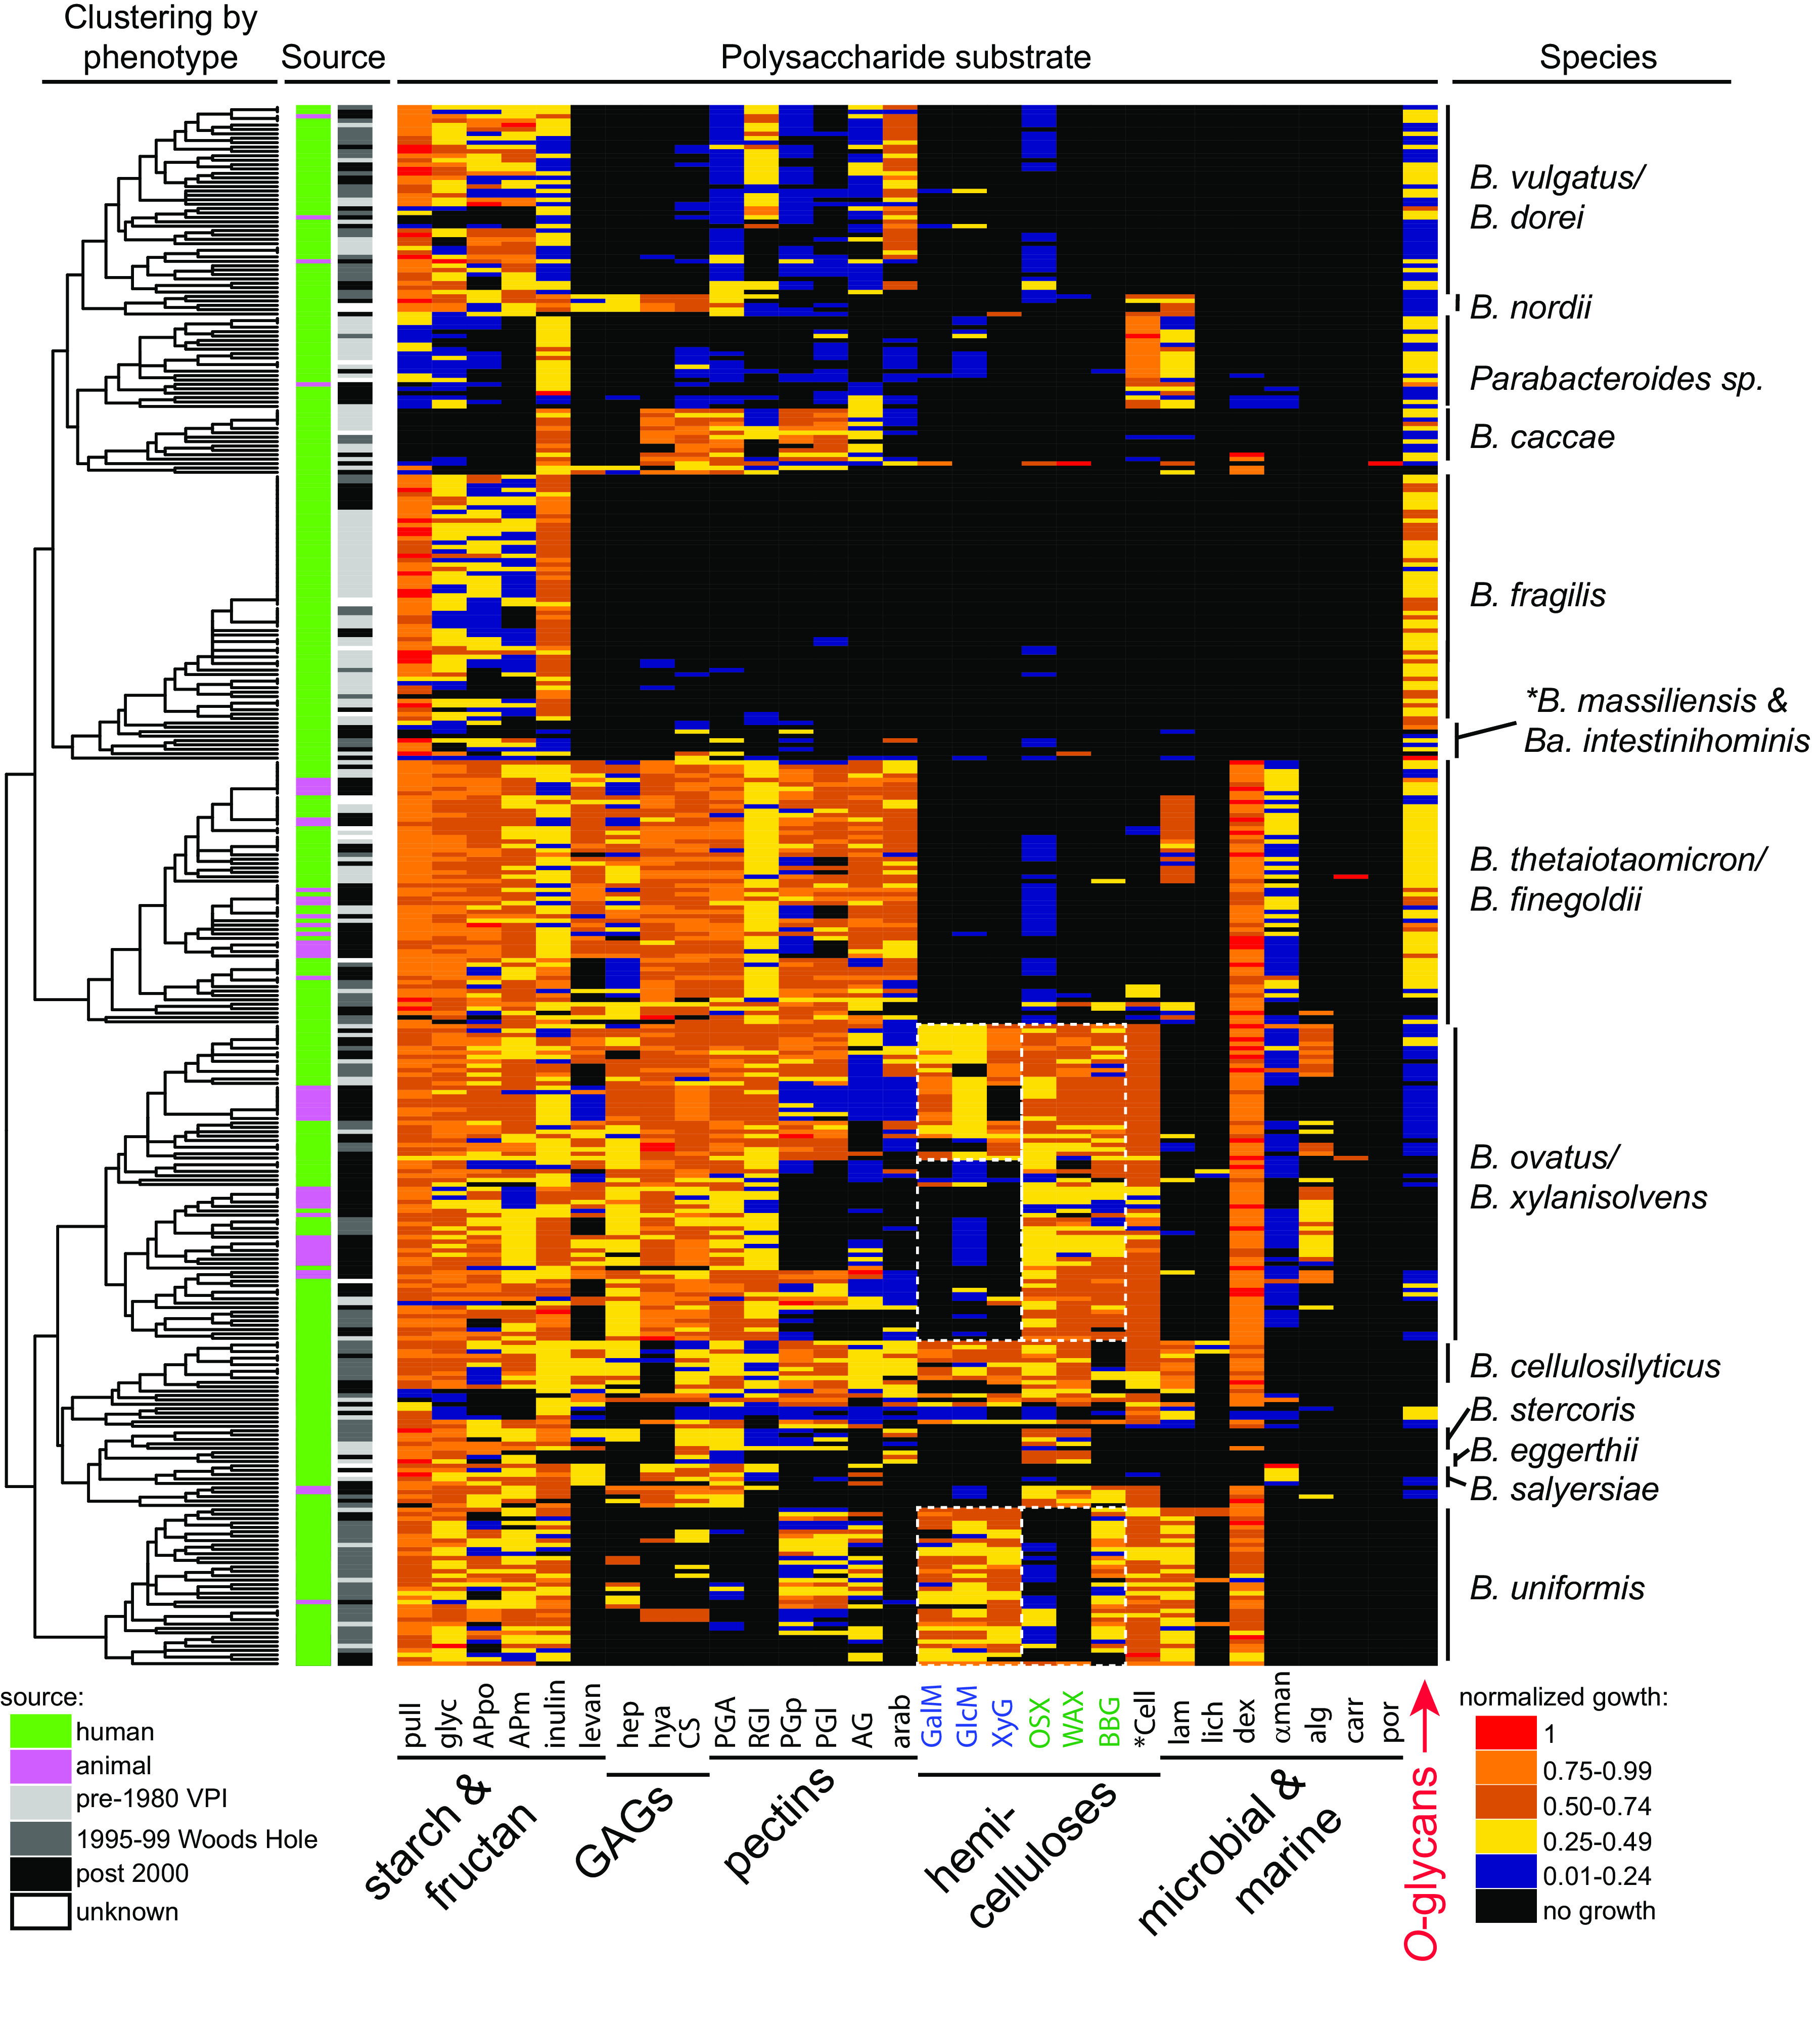
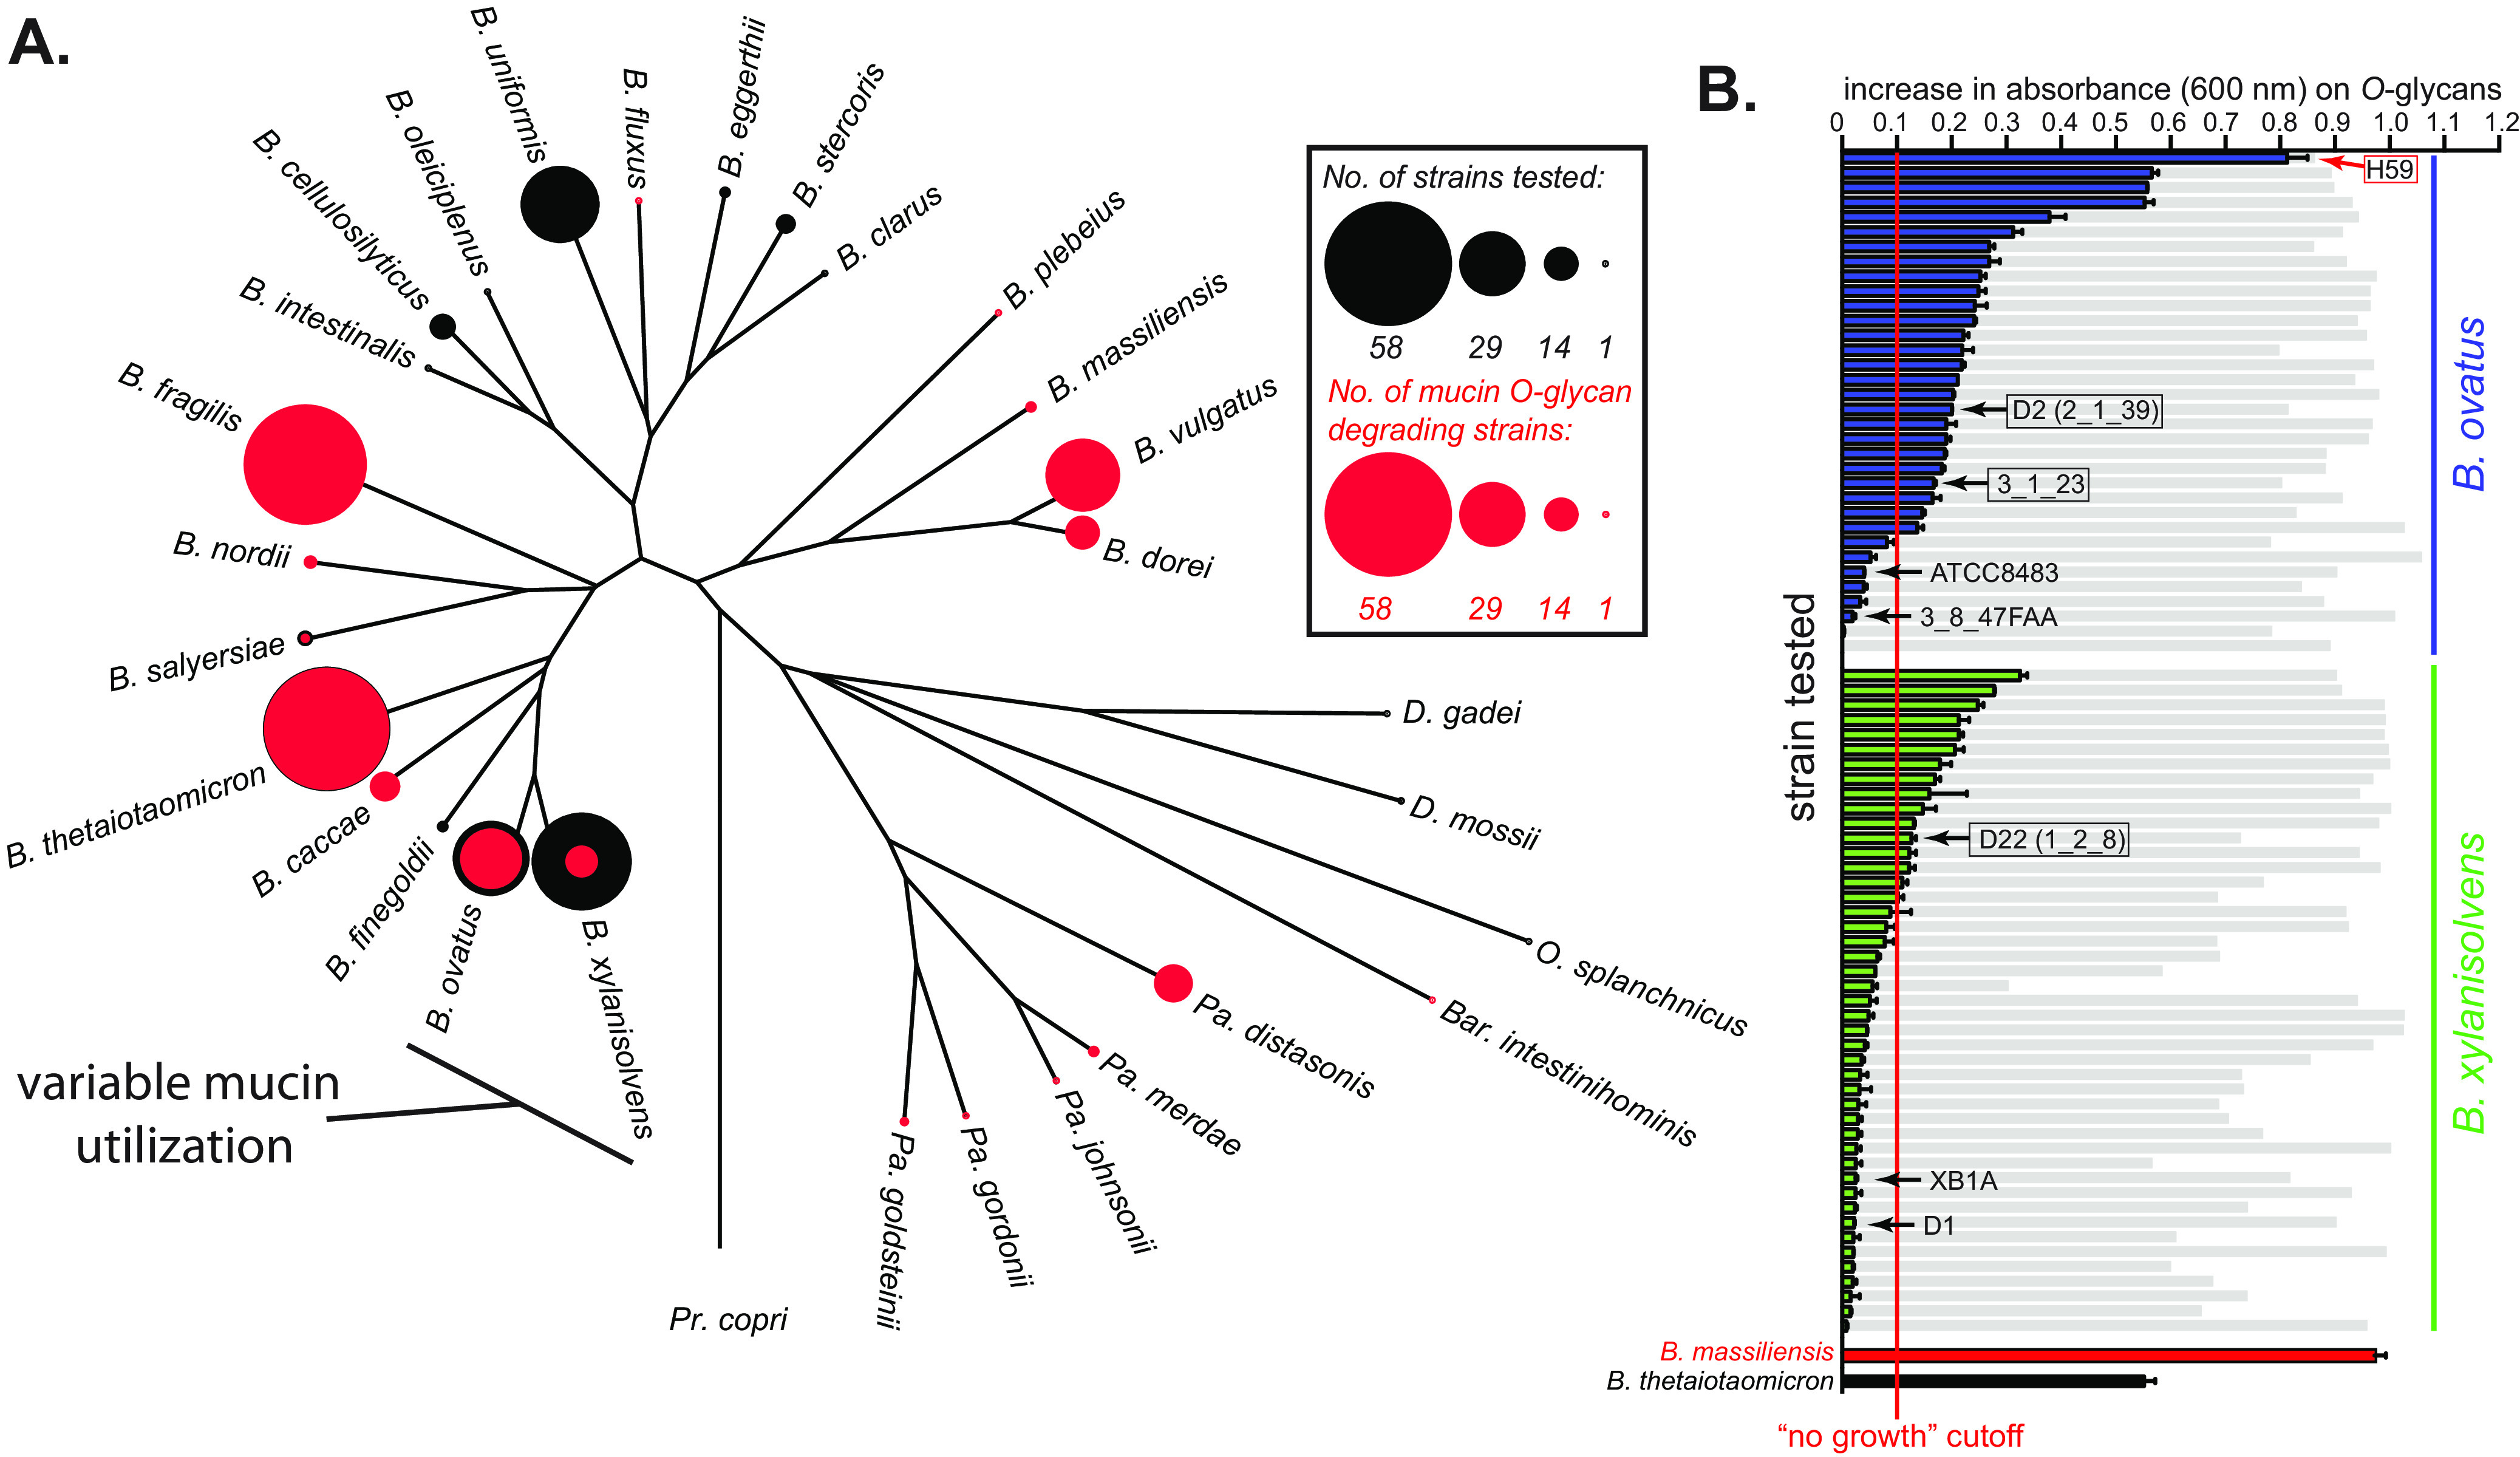
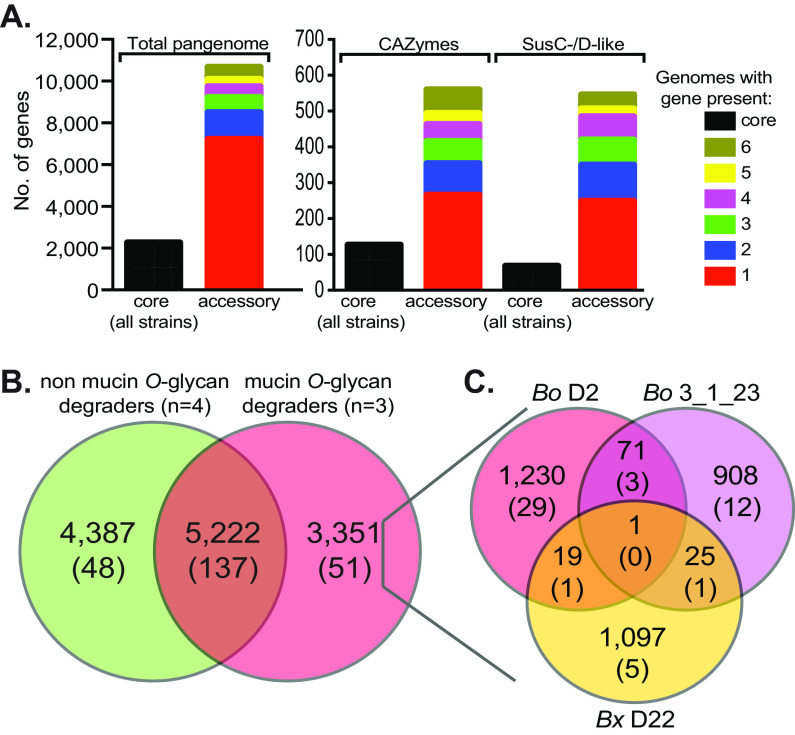
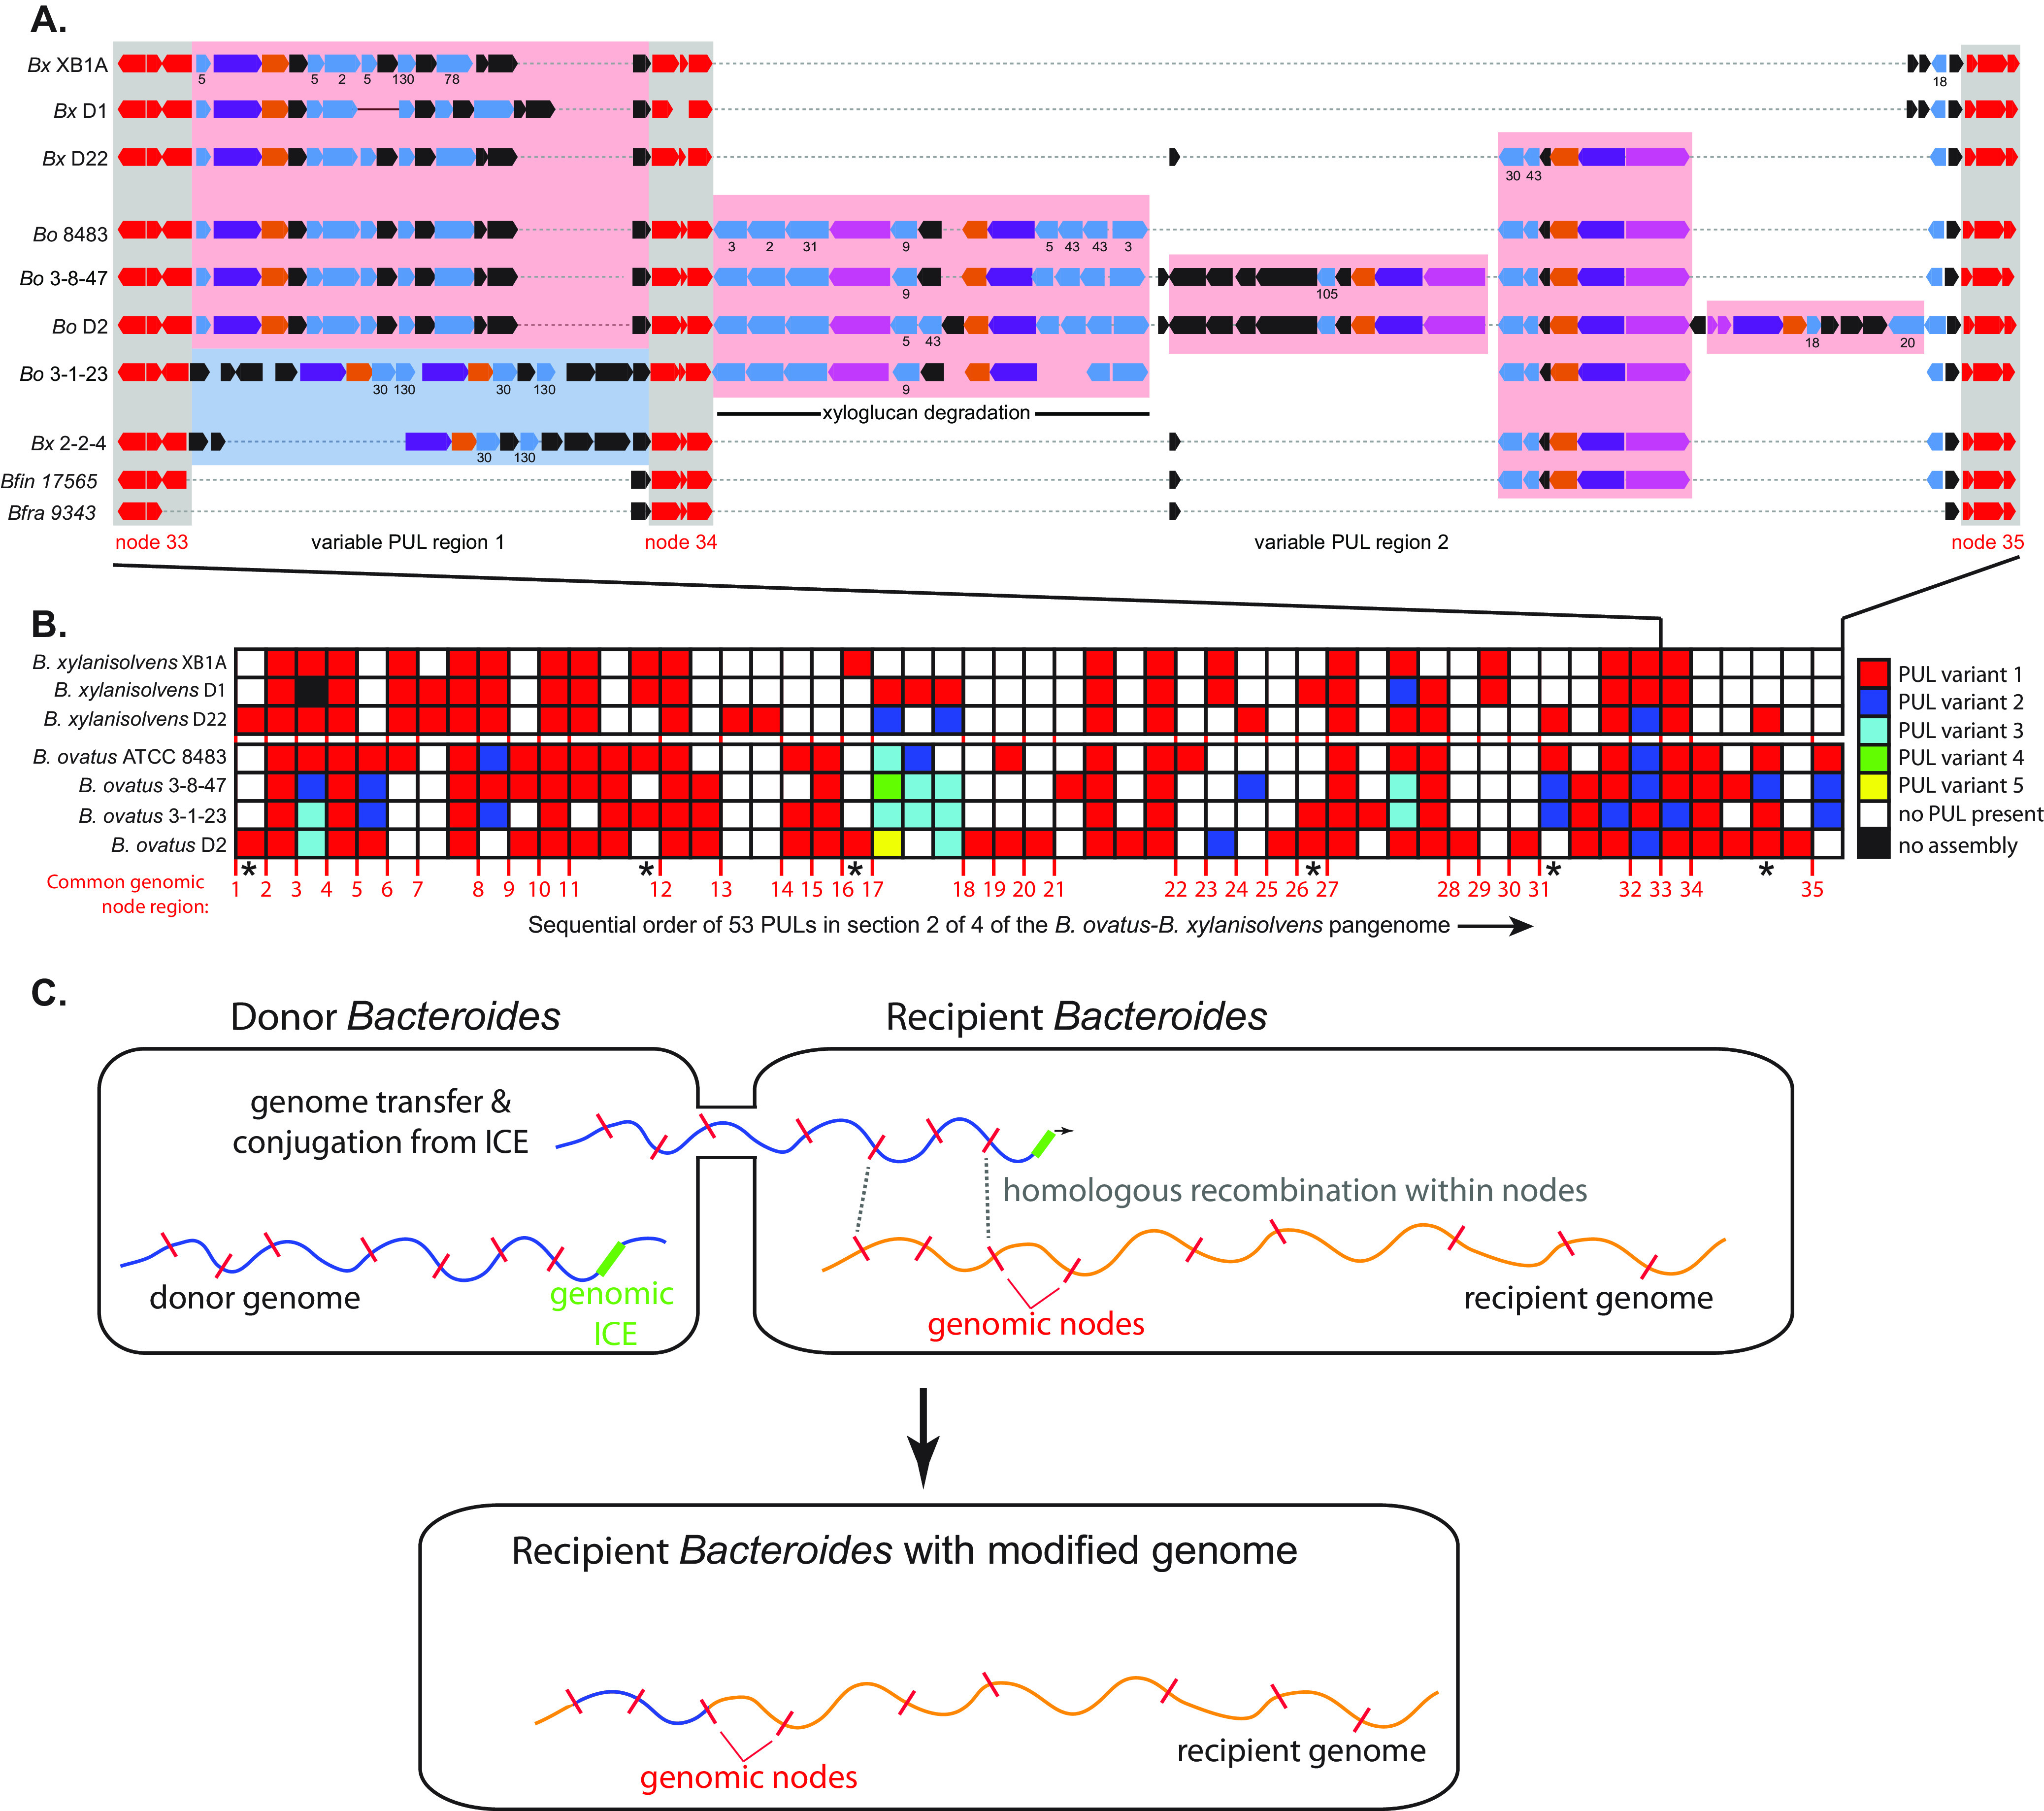
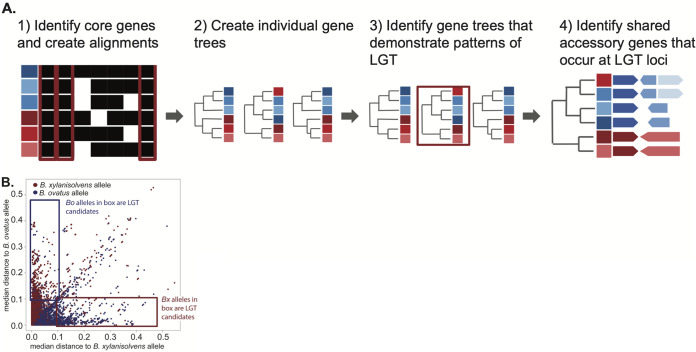
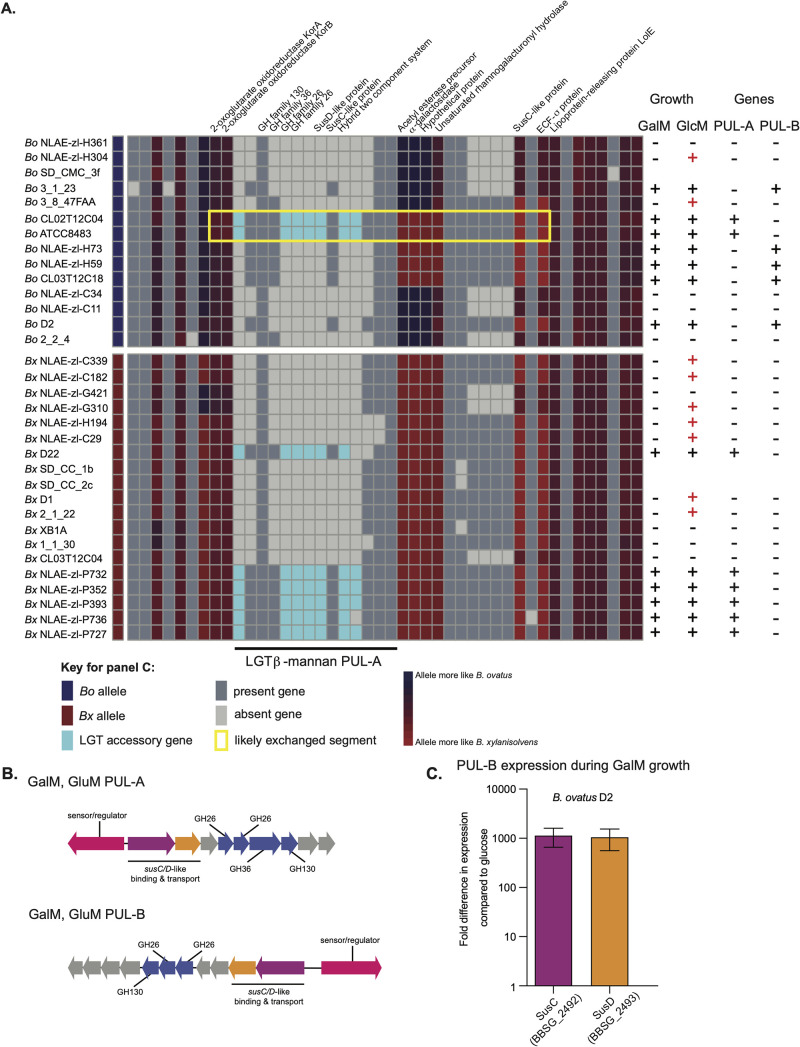
Symbiotic bacteria are responsible for the majority of complex carbohydrate digestion in the human colon. Since the identities and amounts of dietary polysaccharides directly impact the gut microbiota, determining which microorganisms consume specific nutrients is central for defining the relationship between diet and gut microbial ecology. Using a custom phenotyping array, we determined carbohydrate utilization profiles for 354 members of the Bacteroidetes, a dominant saccharolytic phylum. There was wide variation in the numbers and types of substrates degraded by individual bacteria, but phenotype-based clustering grouped members of the same species indicating that each species performs characteristic roles. The ability to utilize dietary polysaccharides and endogenous mucin glycans was negatively correlated, suggesting exclusion between these niches. By analyzing related Bacteroides ovatus/Bacteroides xylanisolvens strains that vary in their ability to utilize mucin glycans, we addressed whether gene clusters that confer this complex, multilocus trait are being gained or lost in individual strains. Pangenome reconstruction of these strains revealed a remarkably mosaic architecture in which genes involved in polysaccharide metabolism are highly variable and bioinformatics data provide evidence of interspecies gene transfer that might explain this genomic heterogeneity. Global transcriptomic analyses suggest that the ability to utilize mucin has been lost in some lineages of B. ovatus and B. xylanisolvens, which harbor residual gene clusters that are involved in mucin utilization by strains that still actively express this phenotype. Our data provide insight into the breadth and complexity of carbohydrate metabolism in the microbiome and the underlying genomic events that shape these behaviors. IMPORTANCE Nonharmful bacteria are the primary microbial symbionts that inhabit the human gastrointestinal tract. These bacteria play many beneficial roles and in some cases can modify disease states, making it important to understand which nutrients sustain specific lineages. This knowledge will in turn lead to strategies to intentionally manipulate the gut microbial ecosystem. We designed a scalable, high-throughput platform for measuring the ability of gut bacteria to utilize polysaccharides, of which many are derived from dietary fiber sources that can be manipulated easily. Our results provide paths to expand phenotypic surveys of more diverse gut bacteria to understand their functions and also to leverage dietary fibers to alter the physiology of the gut microbial community.

Keywords: Bacteroides; microbiome; pangenome; polysaccharides.


Conflict of interest statement

The authors declare no conflict of interest.

We declare no competing interests.

Figures

FIG 1
FIG 1
Glycan degradation abilities among gut Bacteroidetes. (A) The number of species out of 29 tested that degrade each polysaccharide is listed in order of decreasing degradation frequency from left to right. Since not all strains within a given species necessarily have the metabolic potential to utilize each polysaccharide, colors illustrate the percentage of strains within each degrading species that possess the indicated ability. (B) The number of polysaccharides that a given species degrades is shown in decreasing order. The number of strains tested for each species is listed in parentheses, and colors represent the percentage of strains in each indicated species that degrade each glycan counted toward the total.
FIG 2
FIG 2
Heatmap of individual polysaccharide utilization traits. Species are clustered by glycan utilization phenotype based on normalized total growth level (Fig. S4B). The magnitude of growth is indicated by the heatmap scale at the bottom right. Columns at the left indicate the source (human or animal) and time period of isolation. The cladogram at the far left shows the results of unsupervised clustering of the data based on the normalized growth data shown. The species designations at the right are the results of 16S rRNA gene sequencing (>98% identity to the species type strain was used to assign species). The region containing mucin specialists B. massiliensis and B. intestinihominis is indicated but marked with an asterisk because the 4 strains in these 2 species are not clustered perfectly in this region. All raw and normalized growth and rate data for individual strains may be found in Table S1. See Fig. S3 for an expanded heatmap with monosaccharide data and individual strain names labeled. All processed growth curves are available as source data.
FIG 3
FIG 3
Host mucin O-glycan metabolism within the Bacteroides. (A) A phylogenetic tree based on housekeeping genes that compares mucin O-glycan utilization across species. The diameter of the black circles represents the number of strains tested within each species (sample depth), whereas the size of the overlaid red circle corresponds to the number of strains exhibiting O-glycan metabolism. Note that some species have either full or no penetrance of this phenotypic trait and yet others like B. ovatus/B. xylanisolvens have more extensive variability among strains. (B) Strains of B. ovatus (blue) and B. xylanisolvens (green) that show variable growth abilities on mucin O-glycan (n = 2 growth assays per bar, error bars are range between values). Gray histogram bars are total growth controls on an aggregate of the monosaccharides that all strains of these two species grow on (Table S1) and are provided as a reference for overall growth ability on a non O-glycan substrate. Data from two established O-glycan degraders, namely, B. massiliensis and B. thetaiotaomicron, are also shown for reference. Species with black arrows were used for pangenome analyses to compare genetic traits associated with mucin O-glycan metabolism. We performed RNA-seq on three strains included in this pangenome analysis (black boxes) that were positive for O-glycan utilization and an additional strain, namely, B. ovatus NLAE-zl-H59 (red arrow, box), to see if there were unique genes/PULs present in strains that have the ability to grow on mucin O-glycans.
FIG 4
FIG 4
Distribution of all genes as well as core polysaccharide utilization functions in the B. ovatus/B. xylanisolvens pangenome. (A) Left, shows the number of core genes (i.e., those present in all 7 strains used for pangenome construction) compared with genes present in 2 to 7 of the individual strains. Right, shows the same distribution of genes assigned to PULs or particular degradative CAZyme families (GH, PL, and CE) (see Tables S2 and S3 for more detailed assignments). (B) The distribution of genes between mucin-degrading (n = 3) and nondegrading (n = 4) strains used to construct the pangenome. Top numbers indicate total genes, while numbers in parentheses indicate the number of PULs (not individual PUL genes) in each category. (C) Distribution of the genes that are unique to the three mucin-degrading strains within each genome. Genes/PULs are numbered as described for panel B. Note that no PULs are shared by all three strains.
FIG 5
FIG 5
Pangenome diversification in B. ovatus and B. xylanisolvens. (A) A higher-resolution view of a region of the B. ovatus/B. xylanisolvens pangenome shows the variable presence of at least 6 different PULs occurring between 3 genomic nodes (nodes 33 to 35 in this quarter of the total pangenome). Segment 2 of the physical pangenome map was selected because the first segment was initiated with numerous small contigs and this segment contained previously validated genes for xyloglucan metabolism (54). Node genes are colored red; while susC-like and susD-like genes are colored purple and orange, respectively; and glycoside hydrolase genes in light blue. GH family numbers are given below select PULs starting from the top to indicate potential specificity, and new numbers are only added going down the schematic if the family assignments are different, indicating a different PUL. A well-studied B. ovatus PUL for xyloglucan degradation (54) is shown in the center and occurs variably between two nodes and also has variable gene content. The two bottom genomes are from different species, namely, Bacteroides finegoldii (Bfin) and Bacteroides fragilis (Bfra) and show less complex genome architecture with the Bacteroides fragilis region possessing no PULs. (B) A broader view of the genome region in panel A, showing that the same mosaic pattern is common across the pangenome. Only PULs are illustrated, although many other genes were also variable in these regions. The numbers at the bottom delineate the presence of 35 different core gene nodes (as in panel A, some nodes contain multiple core genes) in this section of the genome, and the presence of homologous or unique PULs is illustrated according to the color code at right (see Fig. S6 for high-resolution physical maps of the pangenome with PUL annotations). Note that in some cases up to five different PULs were located at one location. (C) A schematic showing the proposed mechanism of genome exchange based on previous studies (42–44) and observations presented here. Genomic ICEs that are either partially active (excision deficient but capable of initiating DNA strand breakage and conjugation) or activated in trans by the presence of an exogenous conjugative transposon initiate genome mobilization from a donor into a recipient. If sufficient homology between node genes exists in the recipient, homologous recombination between two nodes can replace a section of the recipient with a segment from the donor. Note that genomic regions are shown as linear fragments for simplicity but would be circular.
FIG 6
FIG 6
Identification of putative lateral gene transfer events. (A) Schematic of the workflow to identify putative LGT core genes, which is described as follows: align genes and build corresponding trees for each core gene, determine the median substitution distances for each allele of a core gene in a given strain to both species, and identify loci with an identical conserved structure between isolates of opposite species. (B) Plot of median distances for all core genes identified in the 33 genomes analyzed. The boxes show the regions containing genes for which the median distance was >0.1 to the assigned species for a given strain and ≤0.1 for the opposite species to which a strain is assigned. These genes were determined to be high-confidence examples of core/node genes that had been replaced by an allele from the other species.
FIG 7
FIG 7
Evidence that a PUL for β-mannan metabolism has been laterally transferred into B. ovatus. (A) A region of the B. ovatus/B. xylanisolvens pangenome that contains a PUL involved in galactomannan (GalM) and glucomannan (GluM) degradation. This PUL is present in six strains of B. xylanisolvens and two strains of B. ovatus, and in the latter cases, flanking node genes exhibit signatures of being derived from LGT with a B. xylanisolvens donor (the yellow box highlights a potential recombination region). The columns at the left indicate the growth of each strain on GalM or GluM. The ability to grow on GalM is correlated fully with the presence of one of two different PULs, or both, that are transcriptionally activated during growth on this substrate (23). Notably, some strains (red “+”) are able to grow weakly on GluM but do not possess either of the identified PULs, suggesting that additional, partially orthologous PULs exist that confer the ability to use only GluM. (B) Schematics of PUL-A and PUL-B associated with GalM and GlcM utilization. In B. ovatus ATCC 8384, elimination of PUL-A eliminates both of these growth abilities. (C) Expression analysis by qPCR of two sentinel genes from PUL-B in B. ovatus strain D2 that lacks PUL-A but still exhibits robust growth on GalM.

Comment in

Similar articles

Cited by

References

    1. Koropatkin NM, Cameron EA, Martens EC. 2012. How glycan metabolism shapes the human gut microbiota. Nat Rev Microbiol 10:323–335. doi: 10.1038/nrmicro2746. - DOI - PMC - PubMed
    1. Flint HJ, Scott KP, Duncan SH, Louis P, Forano E. 2012. Microbial degradation of complex carbohydrates in the gut. Gut Microbes 3:289–306. doi: 10.4161/gmic.19897. - DOI - PMC - PubMed
    1. Porter NT, Martens EC. 2017. The critical roles of polysaccharides in gut microbial ecology and physiology. Annu Rev Microbiol 71:349–369. doi: 10.1146/annurev-micro-102215-095316. - DOI - PubMed
    1. El Kaoutari A, Armougom F, Gordon JI, Raoult D, Henrissat B. 2013. The abundance and variety of carbohydrate-active enzymes in the human gut microbiota. Nat Rev Microbiol 11:497–504. doi: 10.1038/nrmicro3050. - DOI - PubMed
    1. McNeil NI. 1984. The contribution of the large intestine to energy supplies in man. Am J Clin Nutr 39:338–342. doi: 10.1093/ajcn/39.2.338. - DOI - PubMed

Publication types

Supplementary concepts

LinkOut - more resources