. 2022 Sep;304(3):553-562.
doi: 10.1148/radiol.212559. Epub 2022 Feb 15.

Myocardial Injury Pattern at MRI in COVID-19 Vaccine-Associated Myocarditis

Affiliations

Myocardial Injury Pattern at MRI in COVID-19 Vaccine-Associated Myocarditis

Matteo Fronza et al. Radiology. 2022 Sep.

Abstract

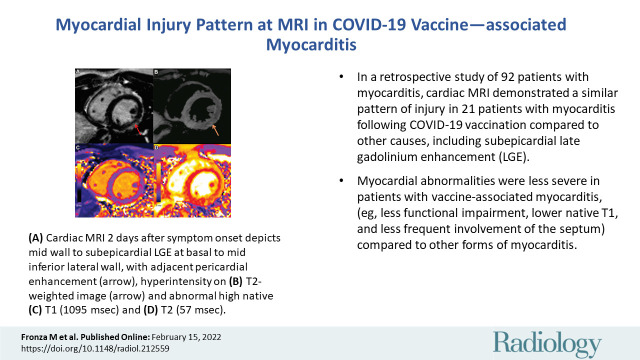
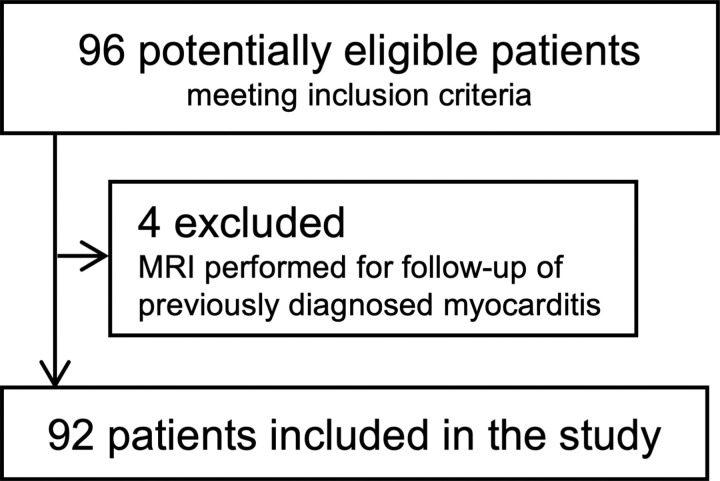
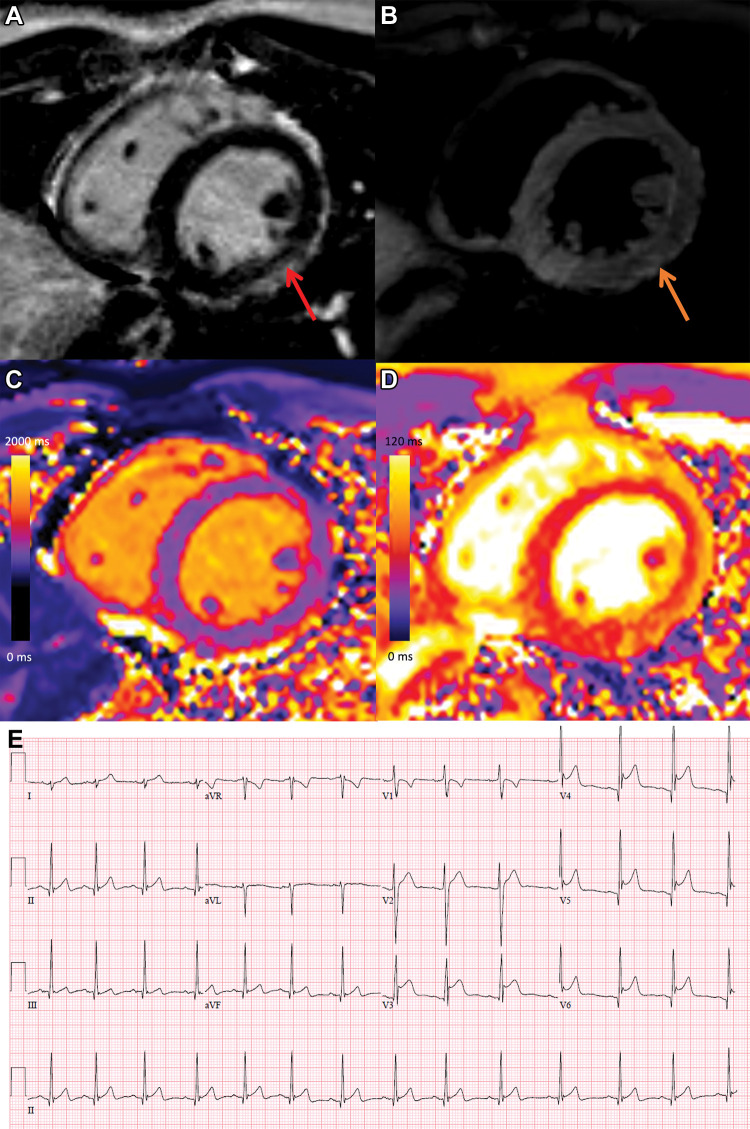
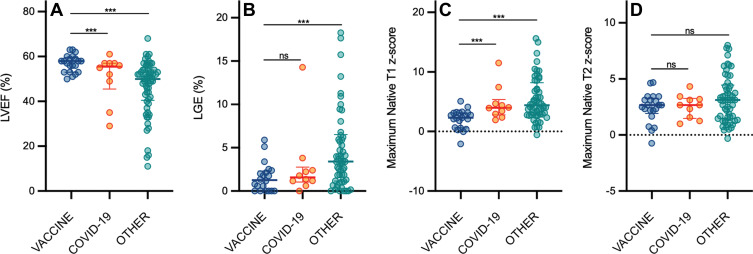
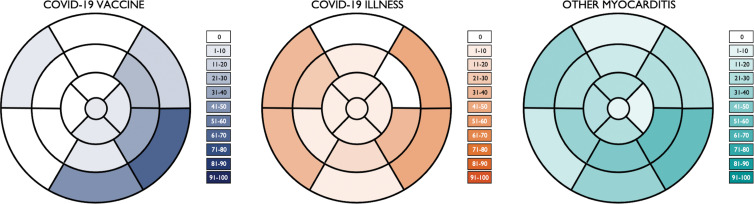
Background There are limited data on the pattern and severity of myocardial injury in patients with COVID-19 vaccination-associated myocarditis. Purpose To describe myocardial injury following COVID-19 vaccination and to compare these findings to other causes of myocarditis. Materials and Methods In this retrospective cohort study, consecutive adult patients with myocarditis with at least one T1-based and at least one T2-based abnormality at cardiac MRI performed at a tertiary referral hospital from December 2019 to November 2021 were included. Patients were classified into one of three groups: myocarditis following COVID-19 vaccination, myocarditis following COVID-19 illness, and other myocarditis not associated with COVID-19 vaccination or illness. Results Of the 92 included patients, 21 (23%) had myocarditis following COVID-19 vaccination (mean age, 31 years ± 14 [SD]; 17 men; messenger RNA-1273 in 12 [57%] and BNT162b2 in nine [43%]). Ten of 92 (11%) patients had myocarditis following COVID-19 illness (mean age, 51 years ± 14; three men) and 61 of 92 (66%) patients had other myocarditis (mean age, 44 years ± 18; 36 men). MRI findings in the 21 patients with vaccine-associated myocarditis included late gadolinium enhancement (LGE) in 17 patients (81%) and left ventricular dysfunction in six (29%). Compared with other causes of myocarditis, patients with vaccine-associated myocarditis had a higher left ventricular ejection fraction and less extensive LGE, even after controlling for age, sex, and time from symptom onset to MRI. The most frequent location of LGE in all groups was subepicardial at the basal inferolateral wall, although septal involvement was less common in vaccine-associated myocarditis. At short-term follow-up (median, 22 days [IQR, 7-48 days]), all patients with vaccine-associated myocarditis were asymptomatic with no adverse events. Conclusion Cardiac MRI demonstrated a similar pattern of myocardial injury in vaccine-associated myocarditis compared with other causes, although abnormalities were less severe, with less frequent septal involvement and no adverse events over the short-term follow-up. © RSNA, 2022 Online supplemental material is available for this article. See also the editorial by Raman and Neubauer in this issue.


Conflict of interest statement

Disclosures of conflicts of interest: M.F. No relevant relationships. P.T. No relevant relationships. V.C. No relevant relationships. G.R.K. No relevant relationships. J.A.U. Grants from Amgen, AstraZeneca, Bayer, Boehringer Ingelheim, Janssen, Novartis, Sanofi; consultant, Boehringer Ingelheim, Novartis, Sanofi; honoraria from GlaxoSmithKline and Sanofi. R.M.W. No relevant relationships. R.H. No relevant relationships. K.H. Honoraria from Sanofi Genzyme, Amicus, and Medscape.

Figures

None
Graphical abstract
Flowchart of patient selection.
Figure 1:
Flowchart of patient selection.
COVID-19 vaccine–associated myocarditis. Short-axis 1.5-T MRI
scans and electrocardiographic findings in a 19-year-old man with
myopericarditis who presented with chest pain 3 days following the second
dose of messenger RNA–1273 COVID-19 vaccine. (A) Cardiac MRI late
gadolinium enhanced scan obtained 2 days after symptom onset demonstrates
midwall to subepicardial late gadolinium enhancement at the basal to
mid-inferior lateral wall with adjacent pericardial enhancement (arrow). (B)
T2-weighted MRI scan shows corresponding hyperintensity (arrow). (C, D)
Parametric maps show abnormal high native T1 (C, 1095 msec, maximum region
of interest) and abnormal high native T2 (D, 57 msec, maximum region of
interest). (E) Electrocardiogram demonstrates diffuse concave upward
ST-segment elevation except in leads aVR and V1, upright T waves in the
leads with ST-segment elevation, and PR depression consistent with
pericarditis. The peak high-sensitivity troponin I level was 5772 pg/mL. The
patient was admitted to the hospital and discharged after 2 days following
complete resolution of symptoms and was asymptomatic with normal troponin
levels at short-term follow-up.
Figure 2:
COVID-19 vaccine–associated myocarditis. Short-axis 1.5-T MRI scans and electrocardiographic findings in a 19-year-old man with myopericarditis who presented with chest pain 3 days following the second dose of messenger RNA–1273 COVID-19 vaccine. (A) Cardiac MRI late gadolinium enhanced scan obtained 2 days after symptom onset demonstrates midwall to subepicardial late gadolinium enhancement at the basal to mid-inferior lateral wall with adjacent pericardial enhancement (arrow). (B) T2-weighted MRI scan shows corresponding hyperintensity (arrow). (C, D) Parametric maps show abnormal high native T1 (C, 1095 msec, maximum region of interest) and abnormal high native T2 (D, 57 msec, maximum region of interest). (E) Electrocardiogram demonstrates diffuse concave upward ST-segment elevation except in leads aVR and V1, upright T waves in the leads with ST-segment elevation, and PR depression consistent with pericarditis. The peak high-sensitivity troponin I level was 5772 pg/mL. The patient was admitted to the hospital and discharged after 2 days following complete resolution of symptoms and was asymptomatic with normal troponin levels at short-term follow-up.
Scatterplots show (A) left ventricular ejection fraction (LVEF), (B)
late gadolinium enhancement (LGE), (C) native T1, and (D) native T2
according to patient group. Graphs for MRI parameters depict individual
patient data points with error bars displayed as medians and IQRs. There
were significant differences in the maximum native T1 z score, maximum
native T2 z score, and LGE extent (as a percentage of left ventricular mass)
between patients with vaccine-associated myocarditis (vaccine) and those
with other myocarditis (other). All other comparisons between patients with
vaccine-associated myocarditis and patients with COVID-19 illness (COVID-19)
or other myocarditis were not significant (ns). *** = P
< .05; statistically significant.
Figure 3:
Scatterplots show (A) left ventricular ejection fraction (LVEF), (B) late gadolinium enhancement (LGE), (C) native T1, and (D) native T2 according to patient group. Graphs for MRI parameters depict individual patient data points with error bars displayed as medians and IQRs. There were significant differences in the maximum native T1 z score, maximum native T2 z score, and LGE extent (as a percentage of left ventricular mass) between patients with vaccine-associated myocarditis (vaccine) and those with other myocarditis (other). All other comparisons between patients with vaccine-associated myocarditis and patients with COVID-19 illness (COVID-19) or other myocarditis were not significant (ns). *** = P < .05; statistically significant.
Segmental distribution of MRI abnormalities. Color-shaded
bull's-eye plots represent the percentage of patients in each group
with late gadolinium enhancement and/or hyperintensity on T2-weighted images
for each myocardial segment according to a standardized 17-segment model.
COVID-19 vaccine = patients with vaccine-associated myocarditis, COVID-19
illness = patients with myocarditis who had recovered from COVID-19, other
myocarditis = patients with other causes of myocarditis.
Figure 4:
Segmental distribution of MRI abnormalities. Color-shaded bull's-eye plots represent the percentage of patients in each group with late gadolinium enhancement and/or hyperintensity on T2-weighted images for each myocardial segment according to a standardized 17-segment model. COVID-19 vaccine = patients with vaccine-associated myocarditis, COVID-19 illness = patients with myocarditis who had recovered from COVID-19, other myocarditis = patients with other causes of myocarditis.

Comment in

Similar articles

Cited by

References

    1. Sanchez Tijmes F , Thavendiranathan P , Udell JA , Seidman MA , Hanneman K . Cardiac MRI Assessment of Nonischemic Myocardial Inflammation: State of the Art Review and Update on Myocarditis Associated with COVID-19 Vaccination . Radiol Cardiothorac Imaging 2021. ; 3 ( 6 ): e210252 . - PMC - PubMed
    1. Aretz HT , Billingham ME , Edwards WD , et al. . Myocarditis. A histopathologic definition and classification . Am J Cardiovasc Pathol 1987. ; 1 ( 1 ): 3 – 14 . - PubMed
    1. Ammirati E , Cipriani M , Moro C , et al. . Clinical Presentation and Outcome in a Contemporary Cohort of Patients With Acute Myocarditis: Multicenter Lombardy Registry . Circulation 2018. ; 138 ( 11 ): 1088 – 1099 . - PubMed
    1. Su JR , McNeil MM , Welsh KJ , et al. . Myopericarditis after vaccination, Vaccine Adverse Event Reporting System (VAERS), 1990-2018 . Vaccine 2021. ; 39 ( 5 ): 839 – 845 . - PubMed
    1. Luk A , Clarke B , Dahdah N , et al. . Myocarditis and Pericarditis After COVID-19 mRNA Vaccination: Practical Considerations for Care Providers . Can J Cardiol 2021. ; 37 ( 10 ): 1629 – 1634 . - PMC - PubMed

Publication types