. 2022 Jun;32(3):151-162.
doi: 10.1089/nat.2021.0071. Epub 2022 Feb 14.

Acute Neurotoxicity of Antisense Oligonucleotides After Intracerebroventricular Injection Into Mouse Brain Can Be Predicted from Sequence Features

Affiliations

Acute Neurotoxicity of Antisense Oligonucleotides After Intracerebroventricular Injection Into Mouse Brain Can Be Predicted from Sequence Features

Peter H Hagedorn et al. Nucleic Acid Ther. 2022 Jun.

Abstract

Antisense oligonucleotides are a relatively new therapeutic modality and safety evaluation is still a developing area of research. We have observed that some oligonucleotides can produce acute, nonhybridization dependent, neurobehavioral side effects after intracerebroventricular (ICV) dosing in mice. In this study, we use a combination of in vitro, in vivo, and bioinformatics approaches to identify a sequence design algorithm, which can reduce the number of acutely toxic molecules synthesized and tested in mice. We find a cellular assay measuring spontaneous calcium oscillations in neuronal cells can predict the behavioral side effects after ICV dosing, and may provide a mechanistic explanation for these observations. We identify sequence features that are overrepresented or underrepresented among oligonucleotides causing these reductions in calcium oscillations. A weighted linear combination of the five most informative sequence features predicts the outcome of ICV dosing with >80% accuracy. From this, we develop a bioinformatics tool that allows oligonucleotide designs with acceptable acute neurotoxic potential to be identified, thereby reducing the number of toxic molecules entering drug discovery pipelines. The informative sequence features we identified also suggest areas in which to focus future medicinal chemistry efforts.

Keywords: antisense oligonucleotides; calcium oscillations; intracerebroventricular dosing; neurotoxicity; sequence design algorithm.


Conflict of interest statement

P.H.H., A.M.H., and M.L.M. are employees of F. Hoffmann-La Roche, a company developing nucleic acid-based medicines. J.M.B., A.E., M.P., K.J., R.E.O., S.E.M., D.L., J.L., M.G., and A.M.C. are former or current employees of Bristol Myers Squibb and may hold company stock or stock options.

Figures

FIG. 1.
FIG. 1.
Distribution and grouping of acute tolerability scores. (A) Distribution of tolerability scores represented by histogram as gray bars. (B) Cumulative distribution of tolerability scores with ASOs grouped into mild (scores <4), moderate (scores between 4 and 7), marked (scores between 7 and 18), and severe (scores >18) tolerability classes. Percentages indicate fraction of ASOs in each tolerability class. ASOs, antisense oligonucleotides.
FIG. 2.
FIG. 2.
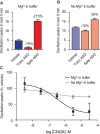
Effect of Mg2+ and CNQX on calcium oscillations. The number of oscillations measured over 3 min for vehicle control, an ASO with acute tolerability score of 13 in mice (Toxic ASO), and an ASO with acute tolerability score of 0 (Safe ASO), with (A) 1 Mg2+ added in the buffer, or (B) No Mg2+ in the buffer. Percentages indicate increase or decrease relative to vehicle level. Error bars indicate 1 SD (n = 4). See Supplementary Table S1 for sequence information on ASOs. (C) Effect of AMPA receptor antagonist CNQX on number of oscillations measured over 3 min relative to vehicle control in the presence (black line) or absence (gray line) of Mg2+ in the buffer. Error bars indicate 1 SD (n = 4). Sigmoidal concentration–response curves with variable slopes fitted to data points by least squares. AMPA, α-amino-3-hydroxy-5-methyl-4-isoxazolepropionic acid; CNQX, cyanquixaline; SD, standard deviation.
FIG. 3.
FIG. 3.
Association between acute tolerability and reductions in spontaneous calcium oscillations in neuronal cells. (A) Scatter plot of acute tolerability scores assessed in mice versus calcium oscillation scores evaluated in cells for n = 148 ASOs. Nonparametric correlation coefficient calculated as Spearman's rank correlation (⍴) with test for significance (P) using an asymptotic approximation to the Student's t-distribution. (B) Box plots showing distributions of calcium oscillation scores for ASOs grouped into mild (scores <4), moderate (scores between 4 and 7), marked (scores between 7 and 18), and severe (scores >18) tolerability classes based on the tolerability scores assessed in mice. Significance (P) evaluated by nonparametric Kruskal–Wallis rank sum test.
FIG. 4.
FIG. 4.
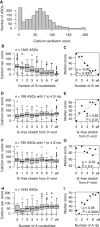
Associations between sequence features and calcium oscillation scores. (A) Distribution of calcium oscillation scores evaluated in neuronal cells represented by histogram as gray bars for n = 1,645 ASOs. Scores >200 were set to 200. (B) Box plots showing distributions of calcium oscillation scores for ASOs grouped based on the number of guanine (G) nucleotides. (C) Scatter plot of median calcium oscillation scores for ASOs with a given number of G nucleotides. Nonparametric correlation coefficient calculated as Spearman's rank correlation (⍴) with test for significance (P) using an asymptotic approximation of the Student's t-distribution. Dashed trend line calculated by linear least-square fitting. (D) Distributions of calcium oscillation scores for ASOs with 1 to 4 G nucleotides, grouped based on the length of the stretch of nucleotides counting from the 3′ end that are not G nucleotides. (E) Similar to (C), but for ASOs with 1 to 4 G nucleotides grouped based on the length of the G-free stretch from the 3′ end. (F, G) Similar to (D) and (E), but with ASOs grouped based on the length of the stretch of nucleotides counting from the 5′-end. (H, I) Similar to (B) and (C), but for adenosine (A) nucleotides.
FIG. 5.
FIG. 5.
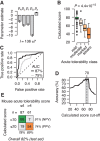
Linear combination of informative sequence used to classify acute tolerability classes in mice for a test set of ASOs. (A) Fitted parameters for the linear model (Equation 1). Error bars indicate 1 SD. (B) Box plots showing distributions of calculated scores for ASOs in the test set of n = 148 ASOs grouped into mild, moderate, marked, and severe tolerability classes based on the tolerability scores assessed in mice. Significance (P) evaluated by nonparametric Kruskal–Wallis rank sum test. (C) Receiver operating characteristics curve for acute tolerability scores grouped into ASOs with mild (scores ≤4) or moderate to severe (scores >4) tolerability scores, varying the score threshold calculated from the linear model (black line), or the measured calcium oscillations (gray line). (D) Accuracy of the classification of ASOs in the test set as a function of the cutoff chosen for the scores calculated from the linear model. Gray area indicates the score region from 65 to 75 where highest overall accuracy is observed. Vertical dashed line indicates midpoint of this score range. (E) Classification performance in the test set using scores calculated from the linear model with optimal cutoff score at 70. AUC, area under the curve; NPV, negative predictive value; PPV, positive predictive value.
FIG. 6.
FIG. 6.
Linear combination of informative sequence used to classify acute tolerability classes in mice for a validation set of ASOs. (A) Scatter plot of acute tolerability scores assessed in mice versus scores calculated from the linear model for a validation set of n = 19 ASOs. (B) Classification performance in the validation set using scores calculated from the linear model with cutoff score at 70.

References

    1. Leavitt BR and Tabrizi SJ. (2020). Antisense oligonucleotides for neurodegeneration. Science 367:1428–1429. - PubMed
    1. Mercuri E, Darras BT, Chiriboga CA, Day JW, Campbell C, Connolly AM, Iannaccone ST, Kirschner J, Kuntz NL, et al. (2018). Nusinersen versus Sham control in later-onset spinal muscular atrophy. N Engl J Med 378:625–635. - PubMed
    1. Schoch KM and Miller TM. (2017). Antisense oligonucleotides: translation from mouse models to human neurodegenerative diseases. Neuron 94:1056–1070. - PMC - PubMed
    1. Haley TJ and McCormick WG. (1957). Pharmacological effects produced by intracerebral injection of drugs in the conscious mouse. Br J Pharmacol Chemother 12:12–15. - PMC - PubMed
    1. DeVos SL and Miller TM. (2013). Direct intraventricular delivery of drugs to the rodent central nervous system. J Vis Exp 75:e50326. - PMC - PubMed

Substances