

A Comparative Analysis of In-Hospital Mortality per Disease Groups in Germany Before and During the COVID-19 Pandemic From 2016 to 2020
- PMID: 35166779
- PMCID: PMC8848198
- DOI: 10.1001/jamanetworkopen.2021.48649
A Comparative Analysis of In-Hospital Mortality per Disease Groups in Germany Before and During the COVID-19 Pandemic From 2016 to 2020
Abstract
Importance: Throughout the ongoing SARS-CoV-2 pandemic, it has been critical to understand not only the viral disease itself but also its implications for the overall health care system. Reports about excess mortality in this regard have mostly focused on overall death counts during specific pandemic phases.
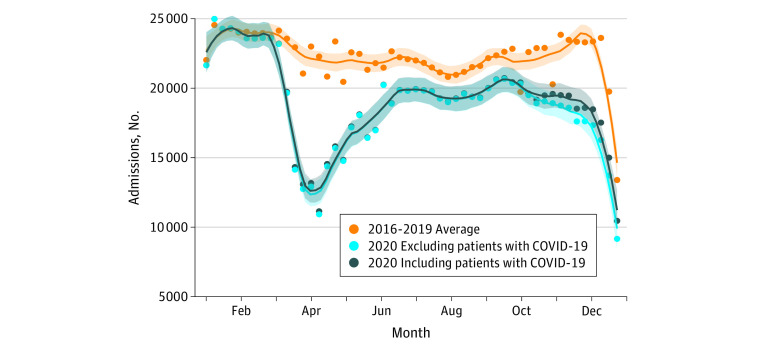
Objective: To investigate hospitalization rates and compare in-hospital mortality rates with absolute mortality incidences across a broad spectrum of diseases, comparing 2020 data with those of prepandemic years.
Design, setting, and participants: Retrospective, cross-sectional, multicentric analysis of administrative data from 5 821 757 inpatients admitted from January 1, 2016, to December 31, 2020, to 87 German Helios primary to tertiary care hospitals.
Exposures: Exposure to SARS-CoV-2.
Main outcomes and measures: Administrative data were analyzed from January 1, 2016, to March 31, 2021, as a consecutive sample for all inpatients. Disease groups were defined according to International Statistical Classification of Diseases and Related Health Problems, 10th Revision (ICD-10; German modification) encoded main discharge diagnoses. Incidence rate ratios (IRRs) for hospital admissions and hospital mortality counts, as well as relative mortality risks (RMRs) comparing 2016-2019 with 2020 (exposure to the SARS-CoV-2 pandemic), were calculated with Poisson regression with log-link function.
Results: Data were examined for 5 821 757 inpatients (mean [SD] age, 56.4 [25.3] years; 51.5% women), including 125 807 in-hospital deaths. Incidence rate ratios for hospital admissions were associated with a significant reduction for all investigated disease groups (IRR, 0.82; 95% CI, 0.79-0.86; P < .001). After adjusting for age, sex, the Elixhauser Comorbidity Index score, and SARS-CoV-2 infections, RMRs were associated with an increase in infectious diseases (RMR, 1.28; 95% CI, 1.21-1.34; P < .001), musculoskeletal diseases (RMR, 1.19; 95% CI, 1.04-1.36; P = .009), and respiratory diseases (RMR, 1.09; 95% CI, 1.05-1.14; P < .001) but not for the total cohort (RMR, 1.00; 95% CI, 0.99-1.02; P = .66). Regarding in-hospital mortality, IRR was associated with an increase within the ICD-10 chapter of respiratory diseases (IRR, 1.28; 95% CI, 1.13-1.46; P < .001) in comparing 2020 with 2016-2019, in contrast to being associated with a reduction in IRRs for the overall cohort and several other subgroups. After exclusion of patients with SARS-CoV-2 infections, IRRs were associated with a reduction in absolute in-hospital mortality for the overall cohort (IRR, 0.78; 95% CI, 0.72-0.84; P < .001) and the subgroup of respiratory diseases (IRR, 0.83; 95% CI, 0.74-0.92; P < .001).
Conclusions and relevance: This cross-sectional study of inpatients from a multicentric German database suggests that absolute in-hospital mortality for 2020 across disease groups was not higher compared with previous years. Higher IRRs of in-hospital deaths observed in patients with respiratory diseases were likely associated with individuals with SARS-CoV-2 infections.
Conflict of interest statement
Figures
References
-
- Calderón-Larrañaga A, Vetrano DL, Rizzuto D, Bellander T, Fratiglioni L, Dekhtyar S. High excess mortality in areas with young and socially vulnerable populations during the COVID-19 outbreak in Stockholm Region, Sweden. BMJ Glob Health. 2020;5(10):e003595. doi: 10.1136/bmjgh-2020-003595 - DOI - PMC - PubMed
Publication types
MeSH terms
LinkOut - more resources
Full Text Sources
Medical
Miscellaneous
