. 2022 Apr 26;34(5):1600-1620.
doi: 10.1093/plcell/koac053.

The origin and evolution of a plant resistosome

Affiliations

The origin and evolution of a plant resistosome

Zhen Gong et al. Plant Cell. .

Abstract

The nucleotide-binding, leucine-rich receptor (NLR) protein HOPZ-ACTIVATED RESISTANCE 1 (ZAR1), an immune receptor, interacts with HOPZ-ETI-DEFICIENT 1 (ZED1)-related kinases (ZRKs) and AVRPPHB SUSCEPTIBLE 1-like proteins to form a pentameric resistosome, triggering immune responses. Here, we show that ZAR1 emerged through gene duplication and that ZRKs were derived from the cell surface immune receptors wall-associated protein kinases (WAKs) through the loss of the extracellular domain before the split of eudicots and monocots during the Jurassic period. Many angiosperm ZAR1 orthologs, but not ZAR1 paralogs, are capable of oligomerization in the presence of AtZRKs and triggering cell death, suggesting that the functional ZAR1 resistosome might have originated during the early evolution of angiosperms. Surprisingly, inter-specific pairing of ZAR1 and AtZRKs sometimes results in the formation of a resistosome in the absence of pathogen stimulation, suggesting within-species compatibility between ZAR1 and ZRKs as a result of co-evolution. Numerous concerted losses of ZAR1 and ZRKs occurred in angiosperms, further supporting the ancient co-evolution between ZAR1 and ZRKs. Our findings provide insights into the origin of new plant immune surveillance networks.


Figures

Figure 1
Figure 1
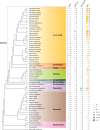
Distribution of ZAR1- and ZRK-related proteins in plants. For each plant species, the copy numbers of ZAR1, ZAR1-sis, ZAR1-basal, and ZRKs are shown next to the species names. The solid and open circles represent the presence and absence of the corresponding proteins, respectively. The size of each solid circle reflects the copy number. The asterisk indicates that the ZAR1 gene was identified using the TBLASTN algorithm to search the genome. The plant phylogeny is based on the literature (Li et al., 2019; One Thousand Plant Transcriptomes, 2019; Zeng et al., 2017).
Figure 2
Figure 2
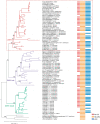
Phylogenetic relationship of ZAR1-related proteins. The phylogeny was reconstructed based on full-length protein sequences using the maximum likelihood method. Four NLRs indicated by gray branches were used as outgroups. The ZAR1-related proteins are classified into three groups: ZAR1 (in red), ZAR1-sis (in purple), and ZAR1-basal (in green). For each protein, the domain architecture is shown next to the protein name. Different domains are indicated using different color stripes, and the color key is shown on the lower right. The asterisks indicate that these proteins were reannotated based on RNA-seq and genomic data. The values near the nodes are UFBoot values.
Figure 3
Figure 3
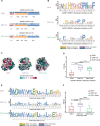
Evolutionary analysis of the ZAR1-related proteins. A, Selection pressures on ZAR1-related proteins. For each group, typical domain architecture is shown with dN/dS ratio on the top. Blue and red short vertical lines represent sites subject to negative selection and positive selection, respectively. Numbers in brackets indicate the numbers of sequences analyzed. B, Sequence logos of the residues crucial for AtZAR1–AtRKS1 interaction. Amino acids are highlighted with different colors based on their polarity and charge, and the color key is shown at the bottom. Red asterisks indicate that these sites are not AtZAR1–AtRKS1 binding sites, but can affect AtZAR1–AtRKS1 interaction. Sites under negative selection are highlighted in red. Numbers in brackets indicate the numbers of sequences analyzed. C, Different conservation patterns of AtZAR1–AtRKS1 interaction interfaces on the structures of ZAR1-related proteins. The structure of ZAR1 (6j5w) and predicted structure models of ZAR1-sis (Potri.006G014400) and ZAR1-basal (RWR85656.1) are colored based on the ConSurf conservation score of each residue. Yellow boxes represent the AtZAR1–AtRKS1 interaction interface. D, Differences in Shannon’s entropy scores for the residues crucial for AtZAR1–AtRKS1 interaction among three ZAR1-related groups. Entropy scores are illustrated using box plots. The upper and lower hinges represent the first and third quartiles, and the line within the box marks the median. The lower whisker extends from the hinge to the smallest value at most 1.5 times that of interquantile range (IQR), and the upper whisker extends from the hinge to the largest value no more than 1.5 times that of IQR. The names of groups are shown on the x-axis. Within the dataset of each group, the entropy score of each site is shown as scatter with no scale on the x-axis. Pairwise significance was determined by Wilcoxon test. E, Sequence logos of the first 23 residues. Amino acids are highlighted with different colors based on their polarity and charge, and the color key is shown at the bottom. Sites under negative selection are highlighted in red. Numbers in brackets indicate the numbers of sequences analyzed. F, Differences in Shannon’s entropy scores for the first 23 residues among three ZAR1-related groups. Entropy scores are illustrated using box plots. The upper and lower hinges represent the first and third quartiles, and the line within the box marks the median. The lower whisker extends from the hinge to the smallest value at most 1.5 times of IQR, and the upper whisker extends from the hinge to the largest value no more than 1.5 times of IQR. The names of groups are shown on the x-axis. Within the dataset of each group, the entropy score of each site is shown as scatter with no scale on the x-axis. Pairwise significance was determined by Wilcoxon test.
Figure 4
Figure 4
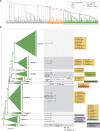
Phylogenetic relationship of ZRK-related proteins. A, Relationship of ZRK-related proteins, WAKs, and other RLKs. The phylogenetic tree was reconstructed based on the kinase domain sequences using the maximum likelihood method. Other ePKs (shown with dashed branches) were used as outgroups. The values near the selected nodes are UFBoot values. B, Enlarged phylogenetic tree of ZRK-related proteins. The values near the nodes are UFBoot values. ZRKs are classified into 12 lineages (collapsed into 12 gray triangles). ZRK domain architectures are displayed near the corresponding lineages. Different domains are highlighted in different color stripes, and the color key is shown on the lower right. The numbers near each domain architecture indicate the copy numbers of the ZRKs with this domain architecture. The numbers in brackets next to the plant species names represent the copy numbers of ZRKs in that plant species.
Figure 5
Figure 5
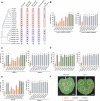
Functional analysis of ZAR1-related proteins. A, Summary of functional analysis results. Solid and open circles represent the presence and absence of the corresponding function, respectively. The phylogenetic relationship of the ZAR1-related proteins is based on Figure 2. Oligomerization and PM association indicate oligomerization and PM association induced by AtRKS1, respectively. B, Multiple ZAR1 orthologs (left) but not paralogs (right) confer AvrAC-induced cell death in protoplasts. Cell viability of Arabidopsis zar1 protoplasts transfected with ZAR1s, AtRKS1, AtPBL2, and AvrAC was measured at 12 h after transfection. Protoplasts expressing AvrAC/AtPBL2/AtRKS1/AtZAR1 served as a positive control (Ctrl) of immune-activated cell death. Protoplasts expressing AvrAC/AtPBL2/AtRKS1 served as a mock control (–). Shown are values relative to the mock control, which is set as 100%. Each bar represents the mean ± standard error (se) from three biological replicates of protoplasts transfected with the indicated constructs. Different letters indicate significant difference at P < 0.05 (one-way ANOVA, Tukey’s post-test). The experiments were repeated 3 times with similar results. C, Multiple ZAR1 orthologs (left) but not paralogs (right) confer AtRKS1-induced cell death in protoplasts. Cell viability of Arabidopsis zar1 protoplasts transfected with ZAR1s and AtRKS1 was measured at 12 h after transfection. Protoplasts expressing AvrAC/AtPBL2/AtRKS1/AtZAR1 served as a positive control (Ctrl) of immune-activated cell death. Protoplasts expressing AtRKS1 alone served as a mock control (–). Shown are values relative to the mock control, which is set as 100%. Each bar represents the mean ± SE from three biological replicates of protoplasts transfected with the indicated constructs. Different letters indicate significant difference at P < 0.05 (one-way ANOVA, Tukey’s post-test). The experiments were performed 3 times with similar results. D, ZAR1 orthologs (left) or paralogs (right) alone cannot trigger cell death in protoplasts, with the exception of LcZAR1. Protoplasts in the zar1 background were transfected with the indicated constructs, and cell viability was measured. Protoplasts expressing AvrAC/AtPBL2/AtRKS1/AtZAR1 served as a positive control (Ctrl) of immune-activated cell death. Shown are values relative to the mock control, which is set as 100%. Each bar represents the mean ± se from three biological replicates of protoplasts transfected with the indicated constructs. Different letters indicate significant difference at P < 0.05 (one-way ANOVA, Tukey’s post-test). The experiments were repeated 3 times with similar results. E, Multiple ZAR1 orthologs (left) but not paralogs (right) confer AtZED1-induced cell death in protoplasts. Cell viability of Arabidopsis zar1 protoplasts transfected with ZAR1s and AtZED1 was measured at 12 h after transfection. Protoplasts expressing AvrAC/AtPBL2/AtRKS1/AtZAR1 served as a positive control (Ctrl) of immune-activated cell death. Protoplasts expressing AtZED1 alone served as a mock control (–). Shown are values relative to the mock control, which is set as 100%. Each bar represents the mean ± se from three biological replicates of protoplasts transfected with the indicated constructs. Different letters indicate significant difference at P < 0.05 (one-way ANOVA, Tukey’s post-test). The experiments were repeated 3 times with similar results. F, AtRKS1 overexpression triggers NbZAR1 activation. The indicated genes were transiently expressed using Agrobacterium in N. benthamiana WT and the zar1-1 mutant. HR (red circles) was assessed 2 days after inoculation. The experiments were performed 3 times with similar results. Scale bars, 1 cm.
Figure 6
Figure 6
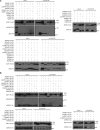
Interaction analysis of ZAR1-related proteins with ZRK-related proteins. A, ZAR1 orthologs and paralogs differentially interact with ZRKs. The indicated constructs were transfected into Arabidopsis zar1 protoplasts. Total protein was subjected to co-IP assays. Co-IP was performed using agarose-conjugated anti-FLAG (α-FLAG) antibodies, and immunoblots were detected with anti-HA and anti-FLAG antibodies. All assays were performed 3 times, and a representative photograph is shown. B, ZAR1 orthologs and paralogs differentially interact with AtRKS1. Protoplasts isolated from Arabidopsis rks1 plants were transfected with the indicated constructs for co-IP assays. Co-IP was performed using α-FLAG antibodies, and immunoblots were detected with anti-HA and anti-FLAG antibodies. All assays were performed 3 times, and a representative photograph is shown.
Figure 7
Figure 7
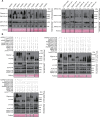
Oligomerization analysis of ZAR1-related proteins. A, ZAR1 orthologs but not paralogs oligomerize upon activation by AtRKS1. BN-PAGE assays show AtRKS1-induced oligomerization of ZAR1 orthologs but not paralogs in Arabidopsis protoplasts. The indicated constructs were transfected into zar1 protoplasts. Total protein was subjected to BN-PAGE and detected by immunoblotting with anti-HA and anti-FLAG antibodies. All assays were performed 3 times, and a representative photograph is shown. B, ZAR1 orthologs but not paralogs oligomerize upon activation by AvrAC. Protoplasts isolated from Arabidopsis zar1 plants were transfected with the indicated constructs for BN-PAGE assays. All assays were performed 3 times, and a representative photograph is shown.
Figure 8
Figure 8
Functional analyses of AtPBL2/AtPBL3 proteins. A, AtPBL2 mutations impair AvrAC-induced cell death in Arabidopsis. Cell viability of pbl2 protoplasts transfected with the indicated constructs was measured at 12 h after transfection. Protoplasts expressing AvrAC/AtRKS1/AtZAR1/AtPBL2 served as a positive control. Protoplasts expressing AvrAC/AtRKS1/AtZAR1 served as a mock control (–). Shown are values relative to the mock control, which is set as 100%. Each bar represents the mean ± se from three biological replicates of protoplasts transfected with the indicated constructs. Different letters indicate significant difference at P < 0.05 (one-way ANOVA, Tukey’s post-test). The experiments were repeated 3 times with similar results. B, AtPBL3 substitutions confer AvrAC-induced cell death in Arabidopsis. Cell viability of pbl2 protoplasts transfected with the indicated constructs was measured at 12 h after transfection. Protoplasts expressing AvrAC/AtRKS1/AtZAR1/AtPBL2 served as a positive control. Protoplasts expressing AvrAC/AtRKS1/AtZAR1 served as a mock control (–). Shown are values relative to the mock control, which is set as 100%. Each bar represents the mean ± se from three biological replicates of protoplasts transfected with the indicated constructs. Different letters indicate significant difference at P < 0.05 (one-way ANOVA, Tukey’s post-test). The experiments were repeated 3 times with similar results. C, AtPBL2 K255 and I257 confer disease resistance to Xcc8004 in Arabidopsis. WT (Col-0) and pbl2 transgenic plants carrying the indicated AtPBL2 transgenes were inoculated with the indicated bacteria, and disease symptoms were photographed 7 days after inoculation. The numbers indicate the number of leaves showing disease symptoms out of the total number of leaves inoculated. Scale bars, 0.5 cm. The experiment was repeated 3 times with similar results. –, pbl2 control plants.
Figure 9
Figure 9
Evolutionary model of the ZAR1 resistosome. The plant phylogeny is based on the literature (Zeng et al., 2017; Li et al., 2019; One Thousand Plant Transcriptomes, 2019). The circles with slashes on the branches represent the loss events of ZAR1 or ZRK proteins. Red dotted box (Event 1) represents the possible evolutionary scenario for the origin of the ZAR1 resistosome. ZAR1 originated through a duplication in the common ancestor of eudicots and monocots, and ZRKs originated from WAKs through the loss of the extracellular domain before the split of eudicots and monocots. ZAR1s were then associated with ZRKs during the early evolution of angiosperms, forming the ZAR1 resistosome. In the blue dotted box (Event 2), ZRK experienced amplification and diversification during the course of angiosperm evolution to recognize various decoys/guardees, including AtPBL2.

Comment in

Similar articles

Cited by

References

    1. Adachi H, Sakai T, Kourelis J, Hernandez JLG, Maqbool A, Kamoun S (2021) Jurassic NLR: conserved and dynamic evolutionary features of the atypically ancient immune receptor ZAR1. bioRxiv, doi: 2020.2010.2012.333484 (December 12, 2021) - PMC - PubMed
    1. Amborella Genome P (2013) The Amborella genome and the evolution of flowering plants. Science 342: 1241089. - PubMed
    1. Antolin-Llovera M, Ried MK, Binder A, Parniske M (2012) Receptor kinase signaling pathways in plant-microbe interactions. Annu Rev Phytopathol 50: 451–473 - PubMed
    1. Ashkenazy H, Abadi S, Martz E, Chay O, Mayrose I, Pupko T, Ben-Tal N (2016) ConSurf 2016: an improved methodology to estimate and visualize evolutionary conservation in macromolecules. Nucleic Acids Res 44: W344–350 - PMC - PubMed
    1. Baudin M, Hassan JA, Schreiber KJ, Lewis JD (2017) Analysis of the ZAR1 immune complex reveals determinants for immunity and molecular interactions. Plant Physiol 174: 2038–2053 - PMC - PubMed

Publication types

MeSH terms

LinkOut - more resources