

True oxygen reduction capacity during photosynthetic electron transfer in thylakoids and intact leaves
- PMID: 35166847
- PMCID: PMC9070831
- DOI: 10.1093/plphys/kiac058
True oxygen reduction capacity during photosynthetic electron transfer in thylakoids and intact leaves
Abstract
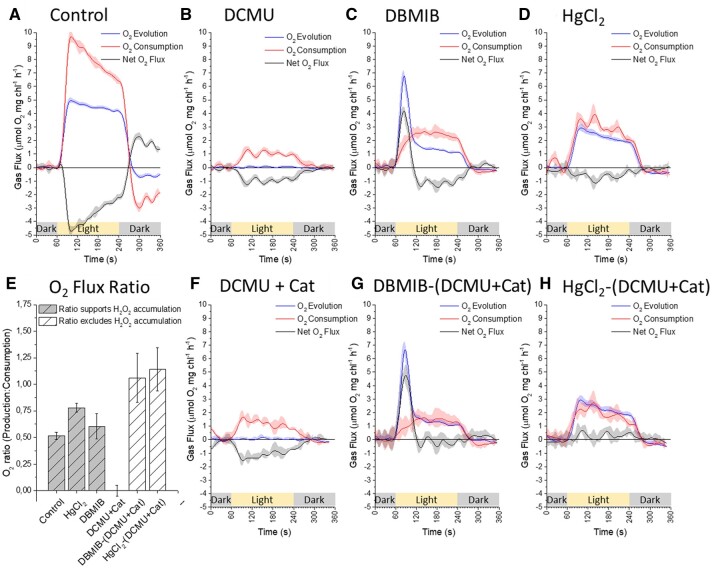
Reactive oxygen species (ROS) are generated in electron transport processes of living organisms in oxygenic environments. Chloroplasts are plant bioenergetics hubs where imbalances between photosynthetic inputs and outputs drive ROS generation upon changing environmental conditions. Plants have harnessed various site-specific thylakoid membrane ROS products into environmental sensory signals. Our current understanding of ROS production in thylakoids suggests that oxygen (O2) reduction takes place at numerous components of the photosynthetic electron transfer chain (PETC). To refine models of site-specific O2 reduction capacity of various PETC components in isolated thylakoids of Arabidopsis thaliana, we quantified the stoichiometry of oxygen production and consumption reactions associated with hydrogen peroxide (H2O2) accumulation using membrane inlet mass spectrometry and specific inhibitors. Combined with P700 spectroscopy and electron paramagnetic resonance spin trapping, we demonstrate that electron flow to photosystem I (PSI) is essential for H2O2 accumulation during the photosynthetic linear electron transport process. Further leaf disc measurements provided clues that H2O2 from PETC has a potential of increasing mitochondrial respiration and CO2 release. Based on gas exchange analyses in control, site-specific inhibitor-, methyl viologen-, and catalase-treated thylakoids, we provide compelling evidence of no contribution of plastoquinone pool or cytochrome b6f to chloroplastic H2O2 accumulation. The putative production of H2O2 in any PETC location other than PSI is rapidly quenched and therefore cannot function in H2O2 translocation to another cellular location or in signaling.
© The Author(s) 2022. Published by Oxford University Press on behalf of American Society of Plant Biologists.
Figures


Similar articles
-
Participation of photosynthetic electron transport in production and scavenging of reactive oxygen species.Antioxid Redox Signal. 2003 Feb;5(1):43-53. doi: 10.1089/152308603321223531. Antioxid Redox Signal. 2003. PMID: 12626116 Review.
-
Enhanced chloroplastic generation of H2O2 in stress-resistant Thellungiella salsuginea in comparison to Arabidopsis thaliana.Physiol Plant. 2015 Mar;153(3):467-76. doi: 10.1111/ppl.12248. Epub 2014 Aug 5. Physiol Plant. 2015. PMID: 24961163 Free PMC article.
-
Chloroplastic ATP synthase builds up a proton motive force preventing production of reactive oxygen species in photosystem I.Plant J. 2017 Jul;91(2):306-324. doi: 10.1111/tpj.13566. Epub 2017 May 23. Plant J. 2017. PMID: 28380278
-
Cooperation of photosystem I with the plastoquinone pool in oxygen reduction in higher plant chloroplasts.Biochemistry (Mosc). 2008 Jan;73(1):112-8. doi: 10.1134/s0006297908010173. Biochemistry (Mosc). 2008. PMID: 18294139
-
Computer modeling of electron and proton transport in chloroplasts.Biosystems. 2014 Jul;121:1-21. doi: 10.1016/j.biosystems.2014.04.007. Epub 2014 May 14. Biosystems. 2014. PMID: 24835748 Review.
Cited by
-
Differential FeS cluster photodamage plays a critical role in regulating excess electron flow through photosystem I.Nat Plants. 2024 Oct;10(10):1592-1603. doi: 10.1038/s41477-024-01780-2. Epub 2024 Sep 13. Nat Plants. 2024. PMID: 39271942
-
Hypericum Perforatum-Derived Exosomes-Like Nanovesicles: A Novel Natural Photosensitizer for Effective Tumor Photodynamic Therapy.Int J Nanomedicine. 2025 Feb 4;20:1529-1541. doi: 10.2147/IJN.S510339. eCollection 2025. Int J Nanomedicine. 2025. PMID: 39925681 Free PMC article.
-
The Resistance of Germinating Pea (Pisum sativum L.) Seeds to Silver Nanoparticles.Plants (Basel). 2025 May 23;14(11):1594. doi: 10.3390/plants14111594. Plants (Basel). 2025. PMID: 40508269 Free PMC article.
-
PSI Photoinhibition and Changing CO2 Levels Initiate Retrograde Signals to Modify Nuclear Gene Expression.Antioxidants (Basel). 2023 Oct 24;12(11):1902. doi: 10.3390/antiox12111902. Antioxidants (Basel). 2023. PMID: 38001755 Free PMC article.
-
ROS production and signalling in chloroplasts: cornerstones and evolving concepts.Plant J. 2022 Aug;111(3):642-661. doi: 10.1111/tpj.15856. Epub 2022 Jun 28. Plant J. 2022. PMID: 35665548 Free PMC article. Review.
References
-
- Allen J (1977) Oxygen—a physiological electron acceptor in photosynthesis? Curr Adv Plant Sci 9: 459–469
-
- Asada K (1999) THE WATER–WATER CYCLE IN CHLOROPLASTS: Scavenging of active oxygens and dissipation of excess photons. Annu Rev Plant Physiol Plant Mol Biol 50: 601–639 - PubMed
-
- Bauer R, Wijnands MJG (1974) The inhibition of photosynthetic electron transport by DBMIB and its restoration by p-phenylenediamines; studied by means of prompt and delayed chlorophyll fluorescence of green algae. Z Naturforsch C J Biosci 29: 725–732
MeSH terms
Substances
LinkOut - more resources
Full Text Sources
