. 2022 May;47(3):387-402.
doi: 10.1007/s13318-022-00756-x. Epub 2022 Feb 15.

Population Pharmacokinetic Model for Tramadol and O-desmethyltramadol in Older Patients

Affiliations

Population Pharmacokinetic Model for Tramadol and O-desmethyltramadol in Older Patients

Aymen A Al-Qurain et al. Eur J Drug Metab Pharmacokinet. 2022 May.

Abstract

Background and objectives: Tramadol is commonly prescribed to manage chronic pain in older patients. However, there is a gap in the literature describing the pharmacokinetic parameters for tramadol and its active metabolite (O-desmethyltramadol [ODT]) in this population. The objective of this study was to develop and evaluate a population pharmacokinetic model for tramadol and ODT in older patients.

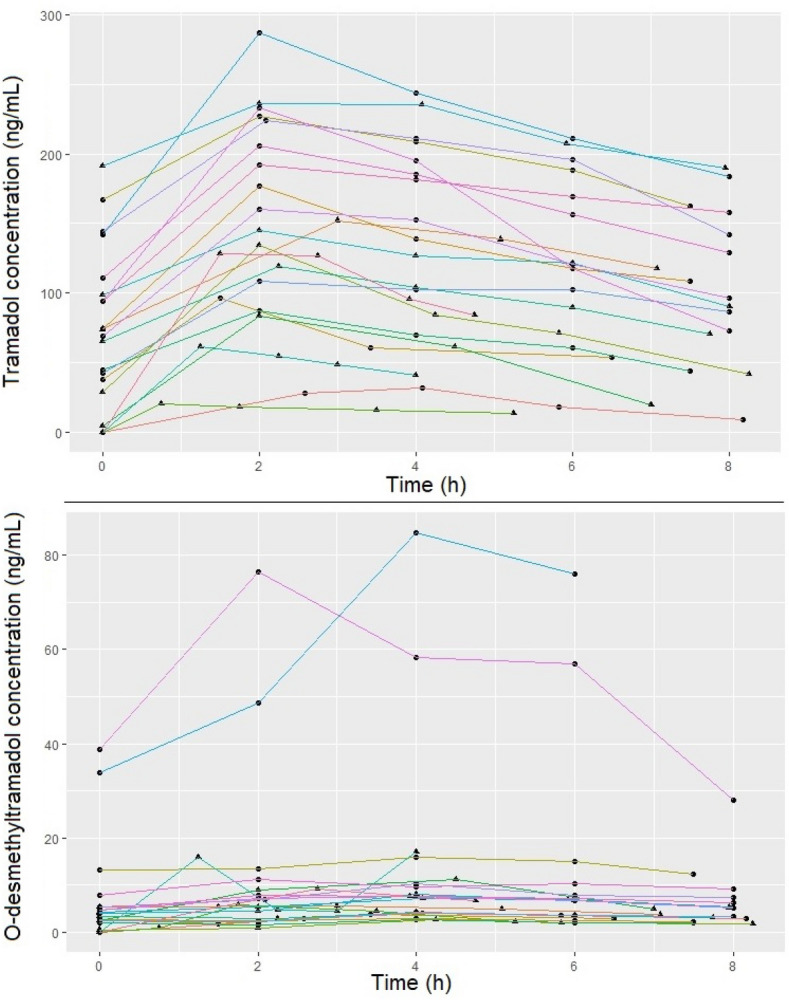
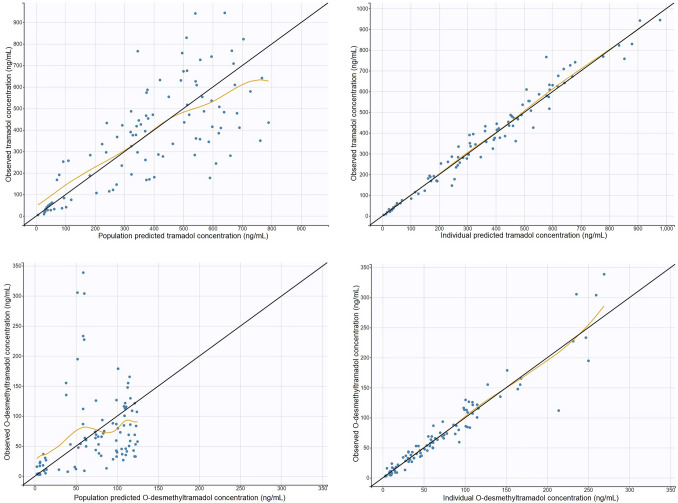
Methods: Twenty-one patients who received an extended-release oral tramadol dose (25-100 mg) were recruited. Tramadol and ODT concentrations were determined using a validated liquid chromatography/tandem mass spectrometry method. A population pharmacokinetic model was developed using non-linear mixed-effects modelling. The performance of the model was assessed by visual predictive check.

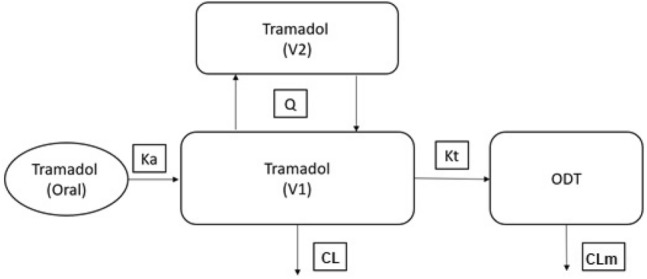
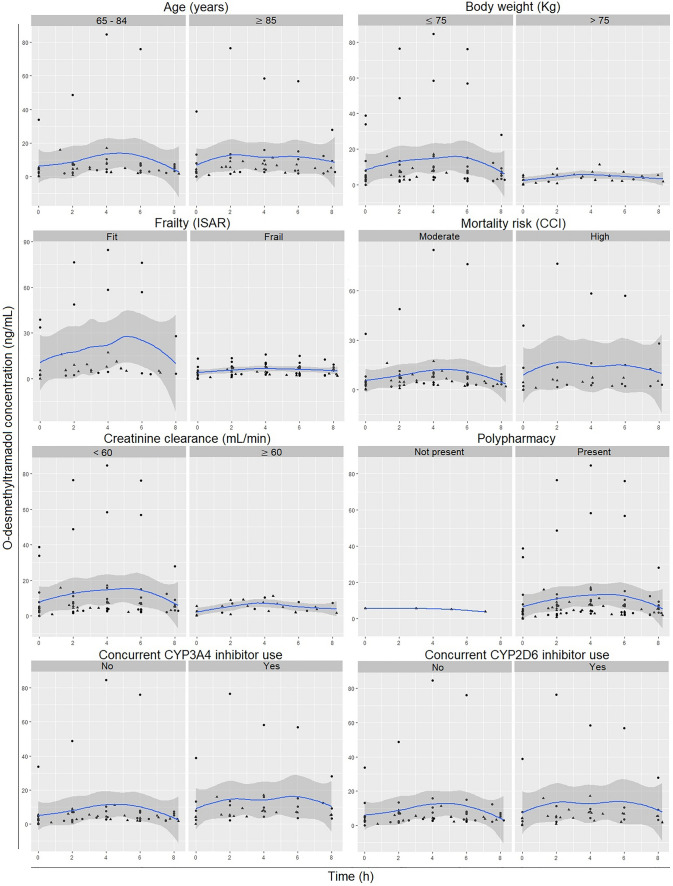
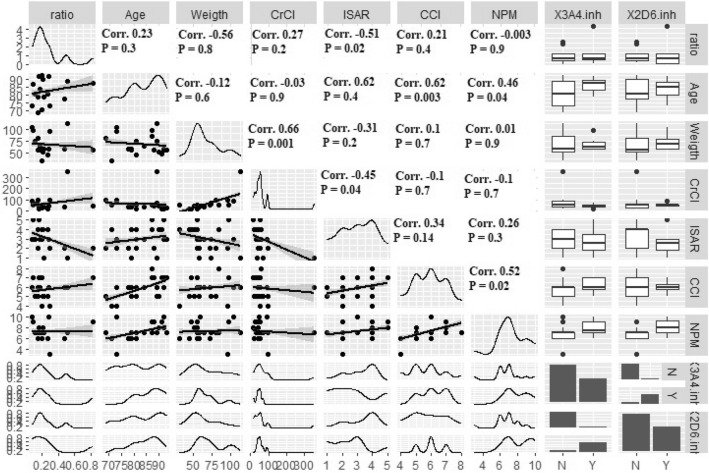
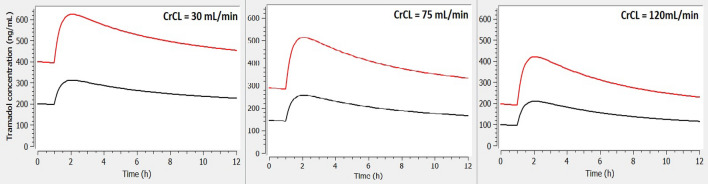
Results: A two-compartment, first-order absorption model with linear elimination best described the tramadol concentration data. The absorption rate constant was 2.96/h (between-subject variability [BSV] 37.8%), apparent volume of distribution for the central compartment (V1/F) was 0.373 l (73.8%), apparent volume of distribution for the peripheral compartment (V2/F) was 0.379 l (97.4%), inter-compartmental clearance (Q) was 0.0426 l/h (2.19%) and apparent clearance (CL/F) was 0.00604 l/h (6.61%). The apparent rate of metabolism of tramadol to ODT (kt) was 0.0492 l/h (78.5%) and apparent clearance for ODT (CLm) was 0.143 l/h (21.6%). Identification of Seniors at Risk score (ISAR) and creatinine clearance (CrCL) were the only covariates included in the final model, where a higher value for the ISAR increased the maximum concentration (Cmax) of tramadol and reduced the BSV in Q from 4.71 to 2.19%. A higher value of CrCL reduced tramadol Cmax and half-life (T1/2) and reduced the BSV in V2/F (from 148 to 97.4%) and in CL/F (from 78.9 to 6.61%).

Conclusion: Exposure to tramadol increased with increased frailty and reduced CrCL. Prescribers should consider patients frailty status and CrCL to minimise the risk of tramadol toxicity in such cohort of patients.


Conflict of interest statement

The authors have no potential conflicts of interest that might be relevant to the contents of this manuscript.

Figures

Fig. 1
Fig. 1
Scheme of the model used to describe the tramadol and O-desmethyltramadol plasma concentration-time profiles. Ka first-order absorption constant, V1 volume of distribution in centeral compartment, V2 volume of distribution of peripheral compartment, Q inter-compartmental clearance, CL clearance, Kt rate of biotransforimg parent to metabolite, CLm clearance of metabolite
Fig. 2
Fig. 2
Observed individual concentrations of tramadol and O-desmethyltramadol. Tramadol dose was standardised to 25 mg. Sex: • = female, ▲ = Male. Each colour represents an individual participant’s data
Fig. 3
Fig. 3
Relationships between participants’ characteristics and tramadol exposure. Frailty: fit; 0–2 Identification of Senior At Risk (ISAR), frail; ISAR ≥ 3. Mortality risk: moderate; CCI 0–5, high; CCI ≥ 6. Polypharmacy: not present; < 5 medications, present; ≥ 5 medications. Tramadol dose was standardised to 25 mg. CCI Charlson Comorbidity Index
Fig. 4
Fig. 4
Relationships between participants’ characteristics and O-desmethyltramadol exposure. Frailty: fit; 0–2 Identification of Senior At Risk (ISAR), frail; ISAR ≥ 3. Mortality risk: moderate; CCI 0–5, high; CCI ≥ 6. Polypharmacy: not present: < 5 medications, present; ≥ 5 medications. Tramadol dose was standardised to 25 mg. CCI Charlson Comorbidity Index
Fig. 5
Fig. 5
Correlation between participant characteristics. Ratio ODT/tramadol concentration ratio at steady state, CrCL creatinine clearance, ISAR Identification of Senior at Risk, CCI Charlson Comorbidity Index, NPM Number of prescribed medications, X3A4.inh CYP3A4 inhibitor, X2D6.inh CYP2D6 inhibitor
Fig. 6
Fig. 6
Visual predictive check (VPC) for tramadol (upper) and O-desmethyltramadol (lower) concentration versus time based on 1000 Monte Carlo simulations. The solid blue lines represent the 10th, 50th and 90th percentiles of the observed data. The shaded regions represent the 90% confidence intevals around the 10th, 50th and 90th percentiles of the simulated data. The blue circles are observed concentration
Fig. 7
Fig. 7
Goodness-of-fit (GOF) plots of observed versus predicted concentrations obtained from the final model for tramadol (top) and O-desmethyltramadol (bottom). (Right) Individual predicted concentrations versus observed concentration. (Left) Population predicted concentration versus observed concentrations. The yellow curve represents the spline line of the plot
Fig. 8
Fig. 8
Goodness-of-fit (GOF) plots of the residual obtained from the final model for tramadol. (Top) Residuals versus time with on left population residuals and on right individual residuals; (bottom) residuals versus predicted tramadol concentrations with on left population residuals and on right individual residuals. The yellow curve represents the spline line of the plot
Fig. 9
Fig. 9
Goodness-of-fit (GOF) plots of the residual obtained from the final model for O-desmethyltramadol. (Top) Residuals versus time with on left population residuals and on right individual residuals; (bottom) residuals versus predicted O-desmethyltramadol concentrations with on left population residuals and on right individual residuals. The yellow curve represents the spline line of the plot
Fig. 10
Fig. 10
Simulated exposure of tramadol with different doses at different range of ISAR (fit = 0, frail = 3 and severe frail = 6). Tramadol doses are presented with line colour; red = 100 mg, black = 50 mg. ISAR Identification of Seniors at Risk
Fig. 11
Fig. 11
Simulated exposure of tramadol with different doses at different range of creatinine clearance (CrCL 30, 75 and 120 ml/min). Tramadol doses are presented with line colour; red = 100 mg, black = 50 mg

References

    1. McLachlan AJ, Bath S, Naganathan V, Hilmer SN, Le Couteur DG, Gibson SJ, et al. Clinical pharmacology of analgesic medicines in older people: impact of frailty and cognitive impairment. Br J Clin Pharmacol. 2011;71(3):351–364. doi: 10.1111/j.1365-2125.2010.03847.x. - DOI - PMC - PubMed
    1. Raffa RB, Friderichs E, Reimann W, Shank RP, Codd EE, Vaught JL. Opioid and nonopioid components independently contribute to the mechanism of action of tramadol, an’atypical’opioid analgesic. J Pharmacol Exp Ther. 1992;260(1):275–285. - PubMed
    1. Rahimi HR, Soltaninejad K, Shadnia S. Acute tramadol poisoning and its clinical and laboratory findings. J Res Med Sci. 2014;19(9):855. - PMC - PubMed
    1. Scott LJ, Perry CM. Tramadol: a review of its use in perioperative pain. Drugs. 2000;60(1):139–176. doi: 10.2165/00003495-200060010-00008. - DOI - PubMed
    1. Grond S, Meuser T, Uragg H, Stahlberg HJ, Lehmann KA. Serum concentrations of tramadol enantiomers during patient-controlled analgesia. Br J Clin Pharmacol. 1999;48(2):254–257. doi: 10.1046/j.1365-2125.1999.00986.x. - DOI - PMC - PubMed

LinkOut - more resources