. 2022 May;117(5):1048-1062.
doi: 10.1111/mmi.14886. Epub 2022 Feb 28.

Rv0500A is a transcription factor that links Mycobacterium tuberculosis environmental response with division and impacts host colonization

Affiliations

Rv0500A is a transcription factor that links Mycobacterium tuberculosis environmental response with division and impacts host colonization

Yuzo L Kevorkian et al. Mol Microbiol. 2022 May.

Abstract

For Mycobacterium tuberculosis (Mtb) to successfully infect a host, it must be able to adapt to changes in its microenvironment, including variations in ionic signals such as pH and chloride (Cl- ), and link these responses to its growth. Transcriptional changes are a key mechanism for Mtb environmental adaptation, and we identify here Rv0500A as a novel transcriptional regulator that links Mtb environmental response and division processes. Global transcriptional profiling revealed that Rv0500A acts as a repressor and influences the expression of genes related to division, with the magnitude of its effect modulated by pH and Cl- . Rv0500A can directly bind the promoters of several of these target genes, and we identify key residues required for its DNA-binding ability and biological effect. Overexpression of rv0500A disrupted Mtb growth morphology, resulting in filamentation that was exacerbated by high environmental Cl- levels and acidic pH. Finally, we show that perturbation of rv0500A leads to attenuation of the ability of Mtb to colonize its host in vivo. Our work highlights the important link between Mtb environmental response and growth characteristics, and uncovers a new transcription factor involved in this critical facet of Mtb biology.

Keywords: Mycobacterium tuberculosis; chloride; gene expression regulation; host-pathogen interactions; hydrogen ion concentration; transcription factor.


Conflict of interest statement

CONFLICT OF INTEREST

The authors declare that no conflict of interest exists.

Figures

FIGURE 1
FIGURE 1
Generation and characterization of an inducible rv0500A overexpression Mtb strain. (a,b) Anhydrotetracycline (ATC) addition to an inducible His-rv0500A Mtb strain (P606’::His-rv0500A-tetON) induces rv0500A overexpression at both the transcript and protein level. (a) qRT-PCR data of rv0500A transcript levels upon bacterial exposure to indicated concentrations of ATC for 4 days, compared to bacteria treated with ethanol as a carrier control. sigA was used as the control gene, and data are shown as mean ± SD from three technical replicates, representative of two independent experiments. In (b), Mtb(P606’::His-rv0500A-tetON) was exposed to 200 ng/ml ATC, or to ethanol (EtOH) as a carrier control, for 4 days before lysates were prepared and analyzed via western blot. Membranes were blotted with either anti-Rv0500A antibody (left panel) or anti-GroEL2 as a loading control (right panel). Purified recombinant His-Rv0500A protein was run as a positive control. Blots are representative of three biological replicates. (c,d) Rv0500A overexpression dampens Mtb response to pH and Cl and does not impair growth as measured by optical density. Mtb(P606’::His-rv0500A-tetON) carrying the rv2390c’::GFP reporter was grown in either 7H9, pH 7 or 7H9, pH 5.7 ± 250 mM NaCl for 12 days. 200 ng/ml ATC or an equivalent volume of EtOH was added to each flask as needed 6 days post-assay start. At indicated timepoints, reporter GFP fluorescence was measured from fixed bacteria using flow cytometry (c), or aliquots taken for OD600 measurements (d). Data are shown as mean ± SD from 3 to 6 runs (two to three independent experiments) in (c), and from three independent experiments in (d). p values shown in (c) were obtained with an unpaired t test, comparing ATC to EtOH treatment for each condition and timepoint, and apply to all conditions. **p < .01, ****p < .0001.
FIGURE 2
FIGURE 2
Global transcriptional profiling reveals effects of Rv0500A on Mtb response to acidic pH/high [Cl] and the expression of division-related genes. (a,b) rv0500A perturbation alters Mtb transcriptional response to acidic pH and high [Cl]. In (a), log-phase Mtb(P606’::His-rv0500A-tetON) in 7H9, pH 7 was treated with either 200 ng/ml anhydrotetracycline (ATC) or ethanol (EtOH) as a carrier control for 2 hr, before exposure to 7H9, pH 7, or 7H9, pH 5.7 media supplemented with 250 mM NaCl for 4 hr, and samples extracted for RNA-sequencing analysis. ATC or EtOH was maintained as appropriate throughout the 4 hr exposure. In (b), log-phase WT and Δrv0500A Mtb were exposed to 7H9, pH 7, or 7H9, pH 5.7 media supplemented with 250 mM NaCl for 4 hr before samples were extracted for RNA-sequencing analysis. Log2-fold change compares gene expression in the 7H9, pH 5.7, 250 mM NaCl media condition versus the 7H9, pH 7 control condition for each of the EtOH or ATC treatment sets in (a), and for WT or Δrv0500A sets in (b). Genes marked in red had a log2-fold change difference ≥0.3 between the ATC and EtOH treatment sets (a) or Δrv0500A and WT sets (b) (only genes with log2-fold change ≥1 in both the EtOH and WT sets considered). (c,d) Rv0500A acts as a transcriptional repressor. In (c), log-phase Mtb(P606’::His-rv0500A-tetON) in 7H9, pH 7 was treated with either 200 ng/ml ATC or EtOH as a carrier control for 6 hr, and samples extracted for RNA-sequencing analysis. In (d), log-phase WT and Δrv0500A Mtb in 7H9, pH 7 were extracted for RNA-sequencing analysis. Log2-fold change compares gene expression in the ATC versus EtOH treatment sets (c) or Δrv0500A versus WT (d). rv0500A is marked in blue, and ftsK, ftsW, ripA, erp, ripB, ripD, rv2525c, rv2864c, and lcp1 are marked in red. (e) rv0500A overexpression represses transcription of division-related genes. qRT-PCR of gene expression in Mtb(P606’::His-rv0500A-tetON) treated with 200 ng/ml ATC or EtOH as a carrier control for 6 hr in pH 7 media. Fold induction compares gene expression in the ATC versus EtOH treatment sets. sigA was used as the control gene, and data are shown as mean ± SD from three technical replicates, representative of three independent experiments. (f) rv0500A deletion increases the expression of division-related genes. qRT-PCR of gene expression in WT, Δrv0500A, or rv0500A* (complemented mutant) Mtb exposed to either 7H9, pH 7 media, or 7H9, pH 5.7 media supplemented with 250 mM NaCl for 4 hr. Fold induction compares gene expression in the Δrv0500A or rv0500A* strain versus WT Mtb in each of the indicated media conditions. sigA was used as the control gene, and data are shown as mean ± SD from three technical replicates, representative of three independent experiments.
FIGURE 3
FIGURE 3
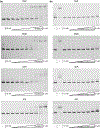
Rv0500A directly binds to promoters of division-related genes. Electrophoretic mobility shift assays (EMSAs) using purified recombinant N-terminally 6x-His-tagged Rv0500A (a) or N-terminally 6x-His-tagged Rv0500A M39A T40A mutant (b) and IRDye 700-labeled probes for promoters of ftsK, ftsW, ripA, and erp are shown. A control with no protein added is shown in the first lane (“−”). The highest concentration binding reaction contained protein at 0.1 μM, followed by two-fold serial dilutions. In (b), the second lane from the left is a positive control lane, where 0.1 μM of the N-terminally 6x-His-tagged Rv0500A was used in the binding reaction (“+”). Data are representative of three independent experiments.
FIGURE 4
FIGURE 4
Rv0500A overexpression results in bacterial filamentation. (a and b) Overexpression of WT Rv0500A results in bacterial filamentation. Mtb(P606’::His-rv0500A-tetON) carrying a constitutive smyc’::mCherry reporter were grown for 10 days in either 7H9, pH 7, or 7H9, pH 5.7 media supplemented with 250 mM NaCl, with 200 ng/ml anhydrotetracycline (ATC) or ethanol (EtOH) as a carrier control added 6 days post-assay start. (a) 3D confocal images of bacteria at 10 days post-assay start (4 days of ATC or EtOH exposure). Scale bar 5 μm. (b) Quantification of bacterial cell lengths. Each point represents a single bacterium. p values were obtained with a Kruskal–Wallis multiple comparisons test. N.S., not significant. (c) Overexpression of N-terminal 6x-His-tagged Rv0500A M39A T40A mutant in Mtb. Log-phase Mtb(P606’::His-rv0500A-tetON) or Mtb(P606’::His-rv0500A-M39A/T40A-tetON) were treated with 200 ng/ml ATC or EtOH as a carrier control for 4 days. Lysates were prepared, samples separated on an SDS-PAGE gel, transferred, and blotted using α-His-Rv0500A (top panel) and α-GroEL2 (bottom panel) antibodies. Purified recombinant His-Rv0500A protein was run as a positive control. (d) Overexpression of Rv0500A M39A T40A has minimal effect on bacterial cell length. Mtb(P606’::His-rv0500A-M39A/T40A-tetON) carrying a constitutive smyc’::mCherry reporter was assayed and bacterial cell lengths quantified as in (b). p values were obtained with a Kruskal–Wallis multiple comparisons test. N.S., not significant.
FIGURE 5
FIGURE 5
Dysregulation of Rv0500A impairs colonization in vivo. (a,b) Doxycycline administration induces construct expression and does not affect Mtb growth in vivo. C57BL/6J WT mice were infected with Mtb(P606’::mKO-tetON, smyc’::mCherry) for 7 days before the drinking water was supplemented with 5% sucrose ±1 mg/ml doxycycline (dox) and infection allowed to proceed for an additional 1 or 3 weeks. (a) 3D confocal images of infected lung tissue at indicated timepoints. Nuclei are shown in grayscale (DAPI), CD68 staining of macrophages is shown in blue, inducible mKO signal is shown in green, and constitutive mCherry signal is shown in red. Scale bar 5 μm. In (b), lung homogenates were plated for colony-forming units (CFUs) 7, 14, or 28 days post-infection. Each point represents a single mouse. p values were obtained with a Mann–Whitney statistical test. N.S., not significant. (c) rv0500A overexpression results in attenuation of Mtb growth in vivo. C57BL/6J WT mice were infected with Mtb(P606’::His-rv0500A-tetON) for 7 days, before the drinking water was supplemented with 5% sucrose ±1 mg/ml dox and infection allowed to proceed for an additional 1 or 3 weeks. Lung homogenates were plated for CFUs 7, 14, or 28 days post-infection. p values were obtained with a Mann–Whitney statistical test. (d) rv0500A deletion results in attenuation of Mtb growth in vivo. C57BL/6J WT mice were infected with WT, Δrv0500A or rv0500A* (complemented mutant) Mtb, and lung homogenates plated for CFUs 14 or 28 days post-infection. p values were obtained with a Mann–Whitney statistical test

Similar articles

Cited by

References

    1. Abramovitch RB, Rohde KH, Hsu FF & Russell DG (2011) aprABC: a mycobacterium tuberculosis complex-specific locus that modulates pH-driven adaptation to the macrophage phagosome. Molecular Microbiology, 80, 678–694. - PMC - PubMed
    1. Aguilar D, Infante E, Martin C, Gormley E, Gicquel B & Hernandez Pando R (2007) Immunological responses and protective immunity against tuberculosis conferred by vaccination of Balb/C mice with the attenuated mycobacterium tuberculosis (phoP) SO2 strain. Clinical and Experimental Immunology, 147, 330–338. - PMC - PubMed
    1. Asensio JG, Arbues A, Marinova D & Martin C (2010) A new live tuberculosis vaccine based on phoP inactivation. Revista Portuguesa de Pneumologia, 16sa, S43–S48. - PubMed
    1. Baker JJ & Abramovitch RB (2018) Genetic and metabolic regulation of mycobacterium tuberculosis acid growth arrest. Scientific Reports, 8, 4168. - PMC - PubMed
    1. Baker JJ, Johnson BK & Abramovitch RB (2014) Slow growth of mycobacterium tuberculosis at acidic pH is regulated by phoPR and host-associated carbon sources. Molecular Microbiology, 94, 56–69. - PMC - PubMed

Publication types

MeSH terms