. 2022 Apr;31(8):2327-2347.
doi: 10.1111/mec.16400. Epub 2022 Feb 25.

Local adaptation and spatiotemporal patterns of genetic diversity revealed by repeated sampling of Caenorhabditis elegans across the Hawaiian Islands

Affiliations

Local adaptation and spatiotemporal patterns of genetic diversity revealed by repeated sampling of Caenorhabditis elegans across the Hawaiian Islands

Timothy A Crombie et al. Mol Ecol. 2022 Apr.

Abstract

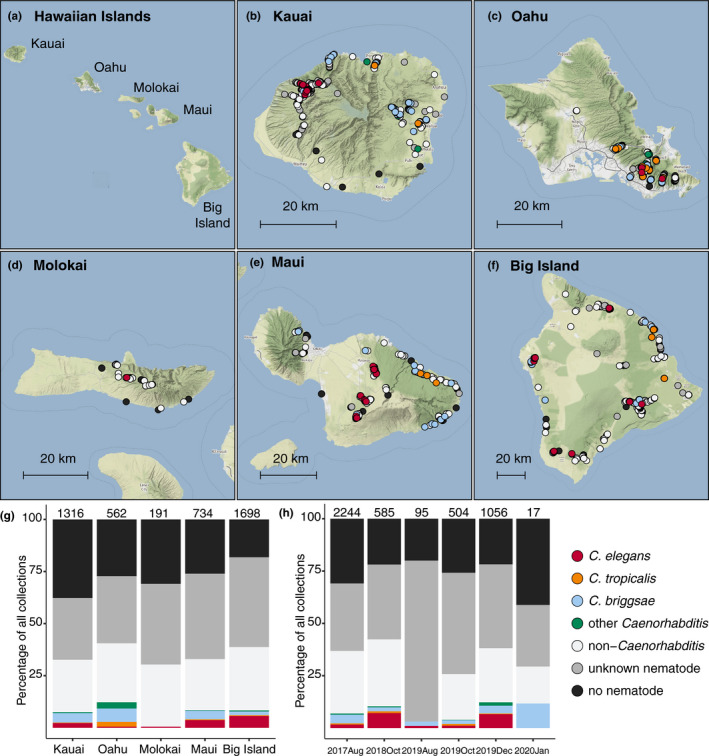
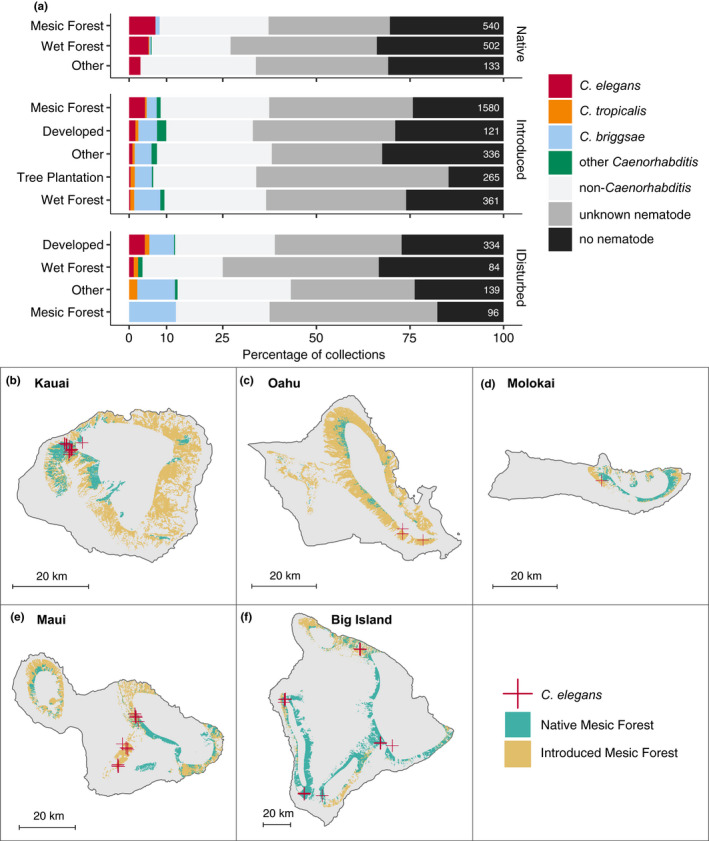
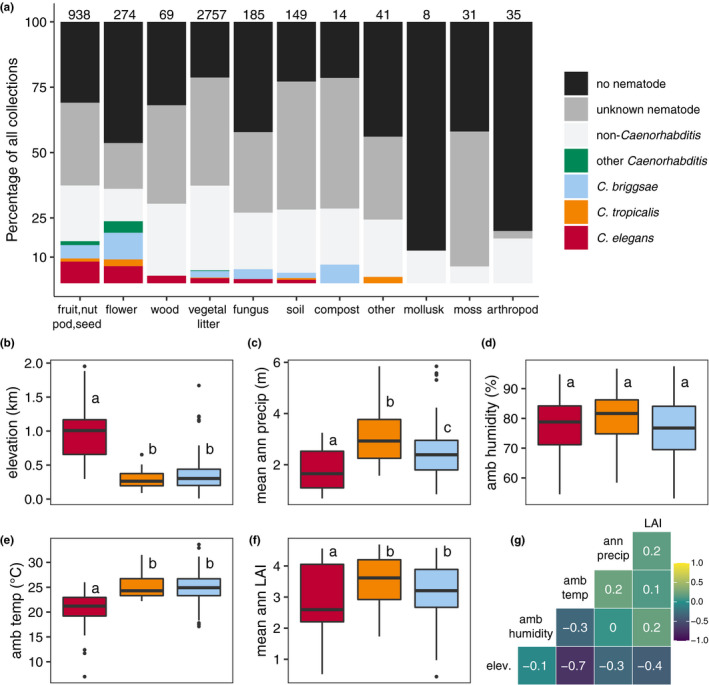
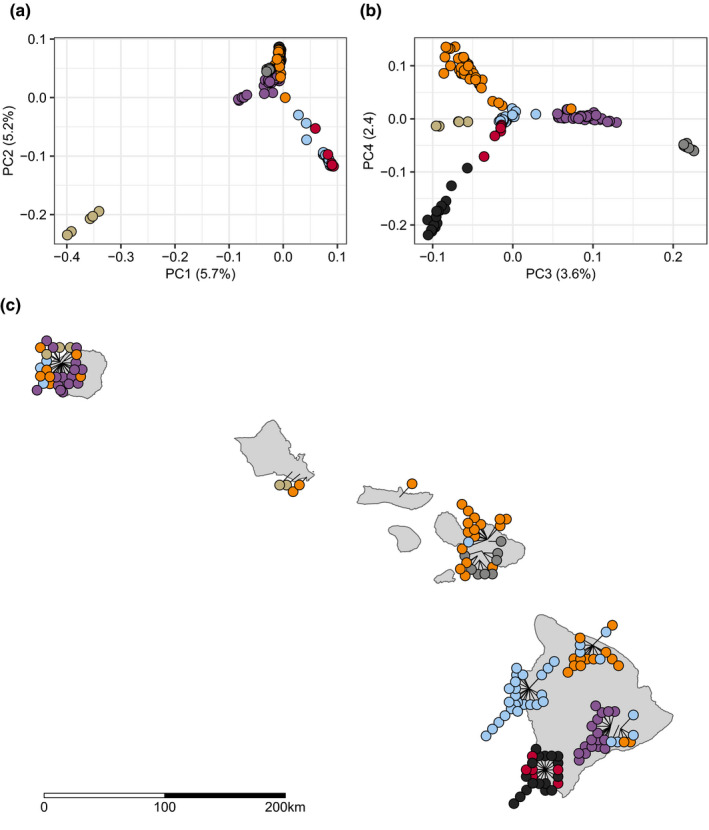
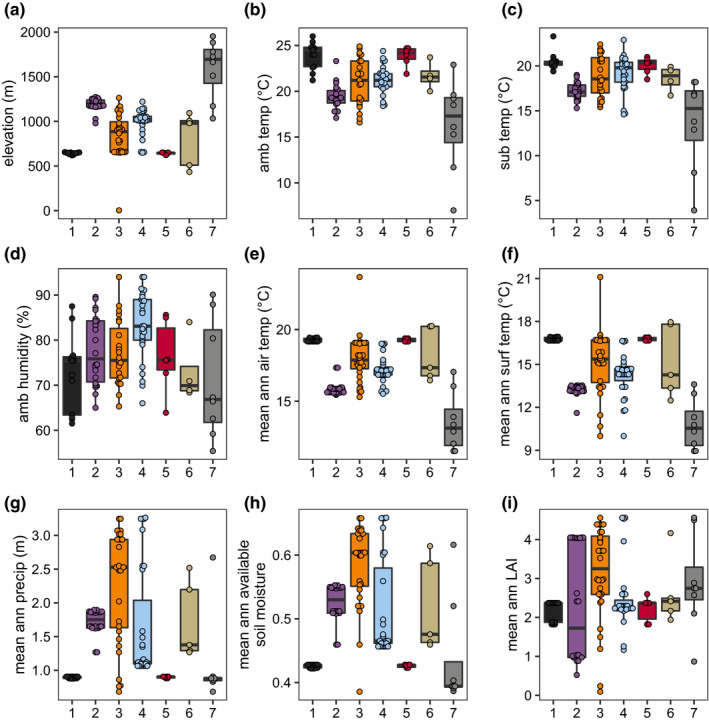
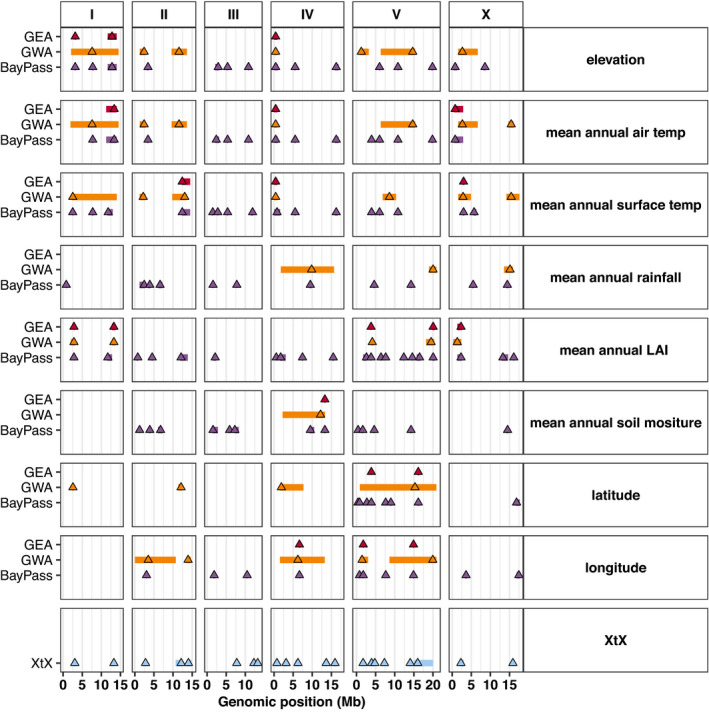
The nematode Caenorhabditis elegans is among the most widely studied organisms, but relatively little is known about its natural ecology. Genetic diversity is low across much of the globe but high in the Hawaiian Islands and across the Pacific Rim. To characterize the niche and genetic diversity of C. elegans on the Hawaiian Islands and to explore how genetic diversity might be influenced by local adaptation, we repeatedly sampled nematodes over a three-year period, measured various environmental parameters at each sampling site, and whole-genome sequenced the C. elegans isolates that we identified. We found that the typical Hawaiian C. elegans niche comprises moderately moist native forests at high elevations (500-1,500 m) where ambient air temperatures are cool (15-20°C). Compared to other Caenorhabditis species found on the Hawaiian Islands (e.g., Caenorhabditis briggsae and Caenorhabditis tropicalis), we found that C. elegans were enriched in native habitats. We measured levels of genetic diversity and differentiation among Hawaiian C. elegans and found evidence of seven genetically distinct groups distributed across the islands. Then, we scanned these genomes for signatures of local adaptation and identified 18 distinct regions that overlap with hyper-divergent regions, which may be maintained by balancing selection and are enriched for genes related to environmental sensing, xenobiotic detoxification, and pathogen resistance. These results provide strong evidence of local adaptation among Hawaiian C. elegans and contribute to our understanding of the forces that shape genetic diversity on the most remote volcanic archipelago in the world.

Keywords: Caenorhabditis; Caenorhabditis elegans; genetic diversity; local adaptation; niche.


Conflict of interest statement

The authors have no conflicts of interest.

Figures

FIGURE 1
FIGURE 1
Geographic and temporal distribution of sampling sites across the Hawaiian Islands. (a) An overview of the Hawaiian Islands. (b–f) Detailed views of each of the islands sampled. Circles indicate sampling sites and are coloured according to the legend below. We categorized nematodes as “other Caenorhabditis” if they did not belong to one of the three selfing Caenorhabditis species and “non‐Caenorhabditis” if their ITS2 region aligned to genera other than Caenorhabditis or if the ITS2 region failed to amplify but the 18S region did. We categorized nematodes as “unknown nematodes” if we could not extract high‐quality genomic DNA or amplify either region by PCR (see Materials and Methods). For sampling sites where multiple collection categories apply (n = 733), the site is coloured by the collection category shown in the legend from top to bottom, respectively. (g–h) The percentage of each collection category is shown by island (g) or collection project (h). Bars are coloured according to the legend on the right and the total number of samples for each category are shown above the bar
FIGURE 2
FIGURE 2
Land cover enrichment among selfing Caenorhabditis nematodes. (a) The percentage of each sampling category is shown by land cover type. The land cover types are organized by native, introduced, and disturbed habitats. The sampling categories are coloured according to the legend at the right, and the total number of samples for each substrate are shown on the right side of the bars. (b–f) Land cover maps for each of the five Hawaiian Islands sampled in this study. The sample locations where Caenorhabditis elegans were found are shown as red crosses, and native and introduced mesic forest land covers are shaded blue and orange, respectively
FIGURE 3
FIGURE 3
Niche differentiation among selfing Caenorhabditis nematodes. (a) The percentage of each sampling category is shown by substrate type. The sampling categories are coloured according to the legend on the right, and the total number of samples for each substrate are shown above the bars. (b–f) Environmental parameter values; elevation, mean annual precipitation, in situ ambient humidity, in situ ambient temperature, and mean annual leaf area index (LAI) for sites where Caenorhabditis species were isolated. Tukey's box plots are plotted by species (red is Caenorhabditis elegans, orange is Ctropicalis, blue is Cbriggsae) for each environmental parameter; points above or below whiskers indicate outliers. Letters above the boxes summarize the statistical significance of comparisons between the species shown. Species with a different letter are significantly different; species with the same letter are not significantly different. Comparisons were made using a Kruskal‐Wallis test and Dunn's test for multiple comparisons with p‐values adjusted using the Bonferroni method. (g) A correlation matrix for the continuous environmental parameters shown. The parameter labels for the matrix are printed on the diagonal, and Pearson's correlation coefficients are printed in the cells. The colour scale also indicates the strength and sign of the correlations shown in the matrix
FIGURE 4
FIGURE 4
Caenorhabditis elegans genetic structure on the Hawaiian Islands. (a, b) Plots show major axes of variation derived from principal components analysis (PCA) of the genotype covariance matrix of 163 Hawaiian isotypes. (a) The first two axes of variation are plotted (PC1 and PC2). (b) The third and fourth axes of variation are plotted (PC3 and PC4). (a, b) The points indicate individual isotypes and are coloured by genetic group assignments obtained from hierarchical clustering of eigenvalues. Only 149 of 163 isotypes are shown, 14 outlier isotypes were removed from the PCA (see Materials and Methods). (c) The sampling locations for 144 of 163 Hawaiian isotypes are plotted on the Hawaiian Islands. Each circle represents a single isotype and is coloured by genetic group assignment. The 14 isotypes that are PCA outliers and five isotypes without location data are not shown
FIGURE 5
FIGURE 5
Environmental parameters for Caenorhabditis elegans genetic groups. Environmental parameter values measured at the time of collection: elevation (a), ambient temperature (b), substrate temperature (c), ambient humidity (d). Environmental parameter values obtained from environmental models; mean annual air temperature (e), mean annual surface temperature (f), mean annual precipitation (g), mean annual available soil moisture (h), mean annual leaf area index (i). Tukey's box plots are plotted by genetic group assignment from PCA (colours) for each environmental parameter
FIGURE 6
FIGURE 6
PC and environmental parameter correlation heatmap. The six significant axes of genetic variation (PCs) from PCA on 149 non‐outlier Hawaiian isotypes are shown on the x‐axis (PCs 1–6), and continuous environmental parameters are plotted on the y‐axis. The cell values represent the Pearson's correlation coefficient between a given PC and environmental parameter values, bold values with an asterisk indicate a significant correlation. The cell colours correspond to the strength and direction of the correlation (see colour scale on the right)
FIGURE 7
FIGURE 7
Genetic architecture of local adaptation. Genotype‐environment association (GEA) results for BayPass and GWA methods are plotted for eight environmental variables: elevation, mean annual air temperature, mean annual surface temperature, mean annual rainfall, mean annual leaf area index (LAI), mean annual soil moisture, latitude, and longitude. The BayPass XtX statistic is plotted on the bottom facet. Each triangle represents the marker with peak significance value within each region for each method. Regions are shown as rectangles plotted behind the peak marker position and their width is determined, as described in Materials and Methods. The peak markers and regions are coloured by their type (red, GEA region; orange, GWA region; purple, BayPass region; blue, XtX region). The GEA regions represent cases where BayPass, GWA, and XtX regions overlap. The overlap for BayPass and GWA are considered within the same environmental variable. If overlap exists, then the smaller of the two overlapping regions is compared to the XtX statistic. If the smaller of the two regions overlaps with the XtX statistic, then the region is determined to be a GEA region and plotted in red for each environmental variable. Genomic position is plotted along the x‐axis in megabases and by chromosome

Similar articles

Cited by

References

    1. Ågren, J. , & Schemske, D. W. (2012). Reciprocal transplants demonstrate strong adaptive differentiation of the model organism Arabidopsis thaliana in its native range. The New Phytologist, 194(4), 1112–1122. 10.1111/j.1469-8137.2012.04112.x - DOI - PubMed
    1. Alison Kay, E. (1994). A natural history of the Hawaiian Islands: Selected Readings II. University of Hawaii Press. https://market.android.com/details?id=book‐SFLoKRq‐joEC
    1. Andersen, E. C. , Bloom, J. S. , Gerke, J. P. , & Kruglyak, L. (2014). A variant in the neuropeptide receptor npr‐1 is a major determinant of Caenorhabditis elegans growth and physiology. PLoS Genetics, 10(2), e1004156. 10.1371/journal.pgen.1004156 - DOI - PMC - PubMed
    1. Andersen, E. C. , Gerke, J. P. , Shapiro, J. A. , Crissman, J. R. , Ghosh, R. , Bloom, J. S. , Félix, M.‐A. , & Kruglyak, L. (2012). Chromosome‐scale selective sweeps shape Caenorhabditis elegans genomic diversity. Nature Genetics, 44(3), 285–290. 10.1038/ng.1050 - DOI - PMC - PubMed
    1. Ashe, A. , Bélicard, T. , Le Pen, J. , Sarkies, P. , Frézal, L. , Lehrbach, N. J. , Félix, M.‐A. , & Miska, E. A. (2013). A deletion polymorphism in the Caenorhabditis elegans RIG‐I homolog disables viral RNA dicing and antiviral immunity. eLife, 2, e00994. 10.7554/eLife.00994 - DOI - PMC - PubMed

Publication types

LinkOut - more resources