

A novel fluorescent reporter sensitive to serine mis-incorporation
- PMID: 35167412
- PMCID: PMC8855846
- DOI: 10.1080/15476286.2021.2015173
A novel fluorescent reporter sensitive to serine mis-incorporation
Abstract
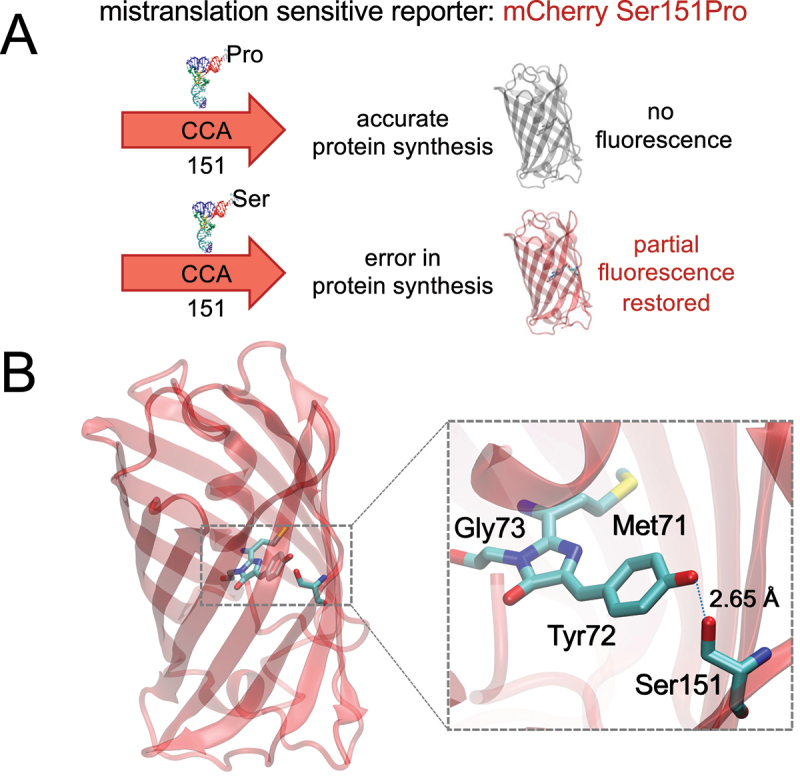
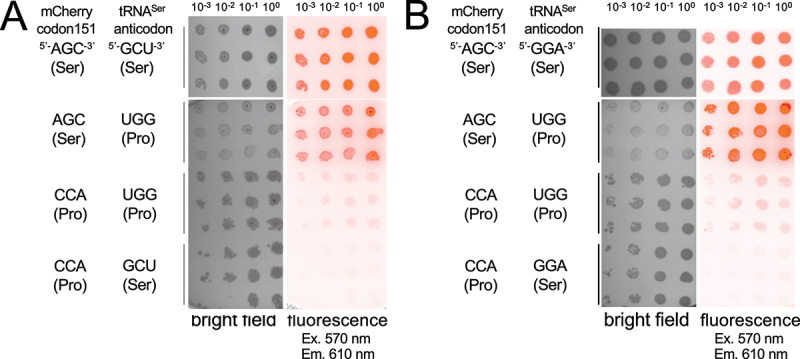
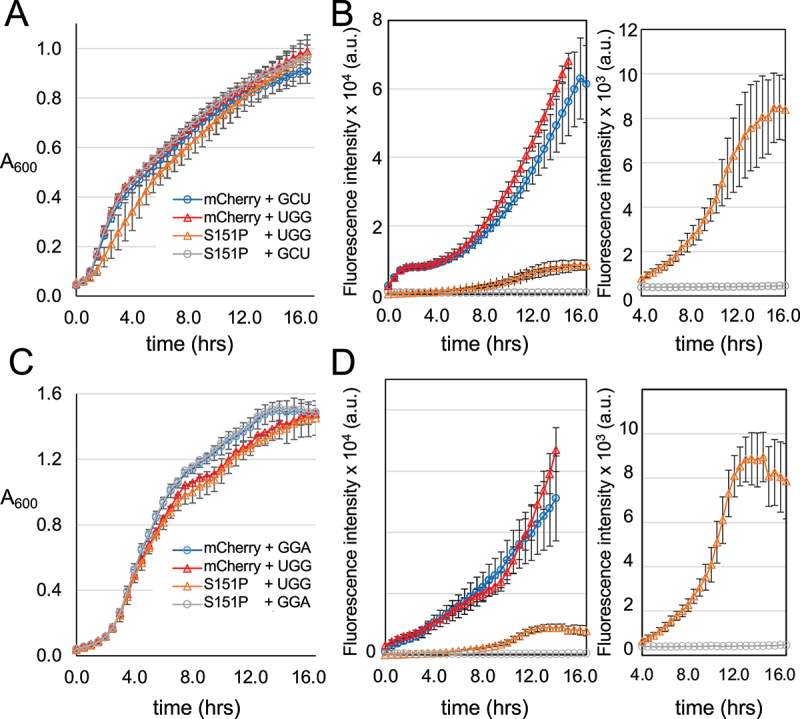
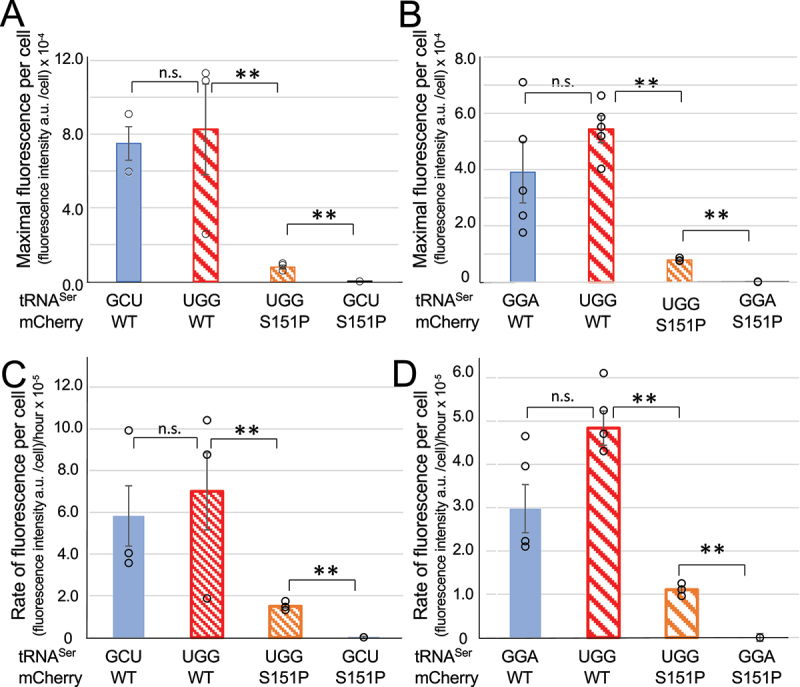
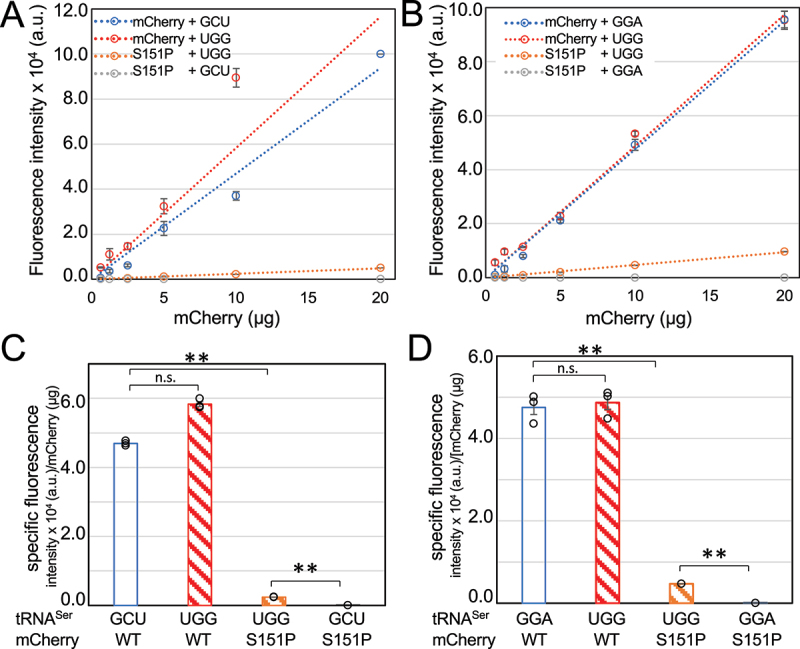
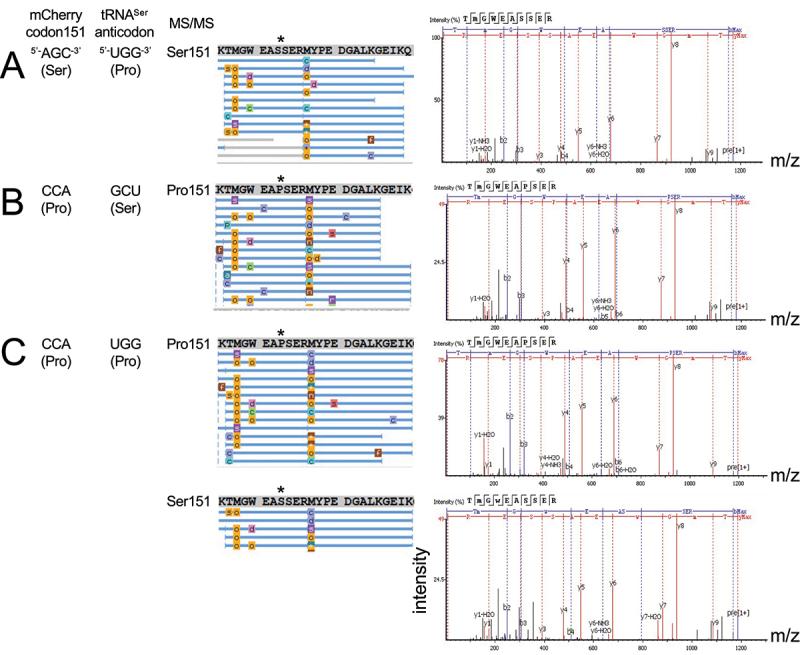
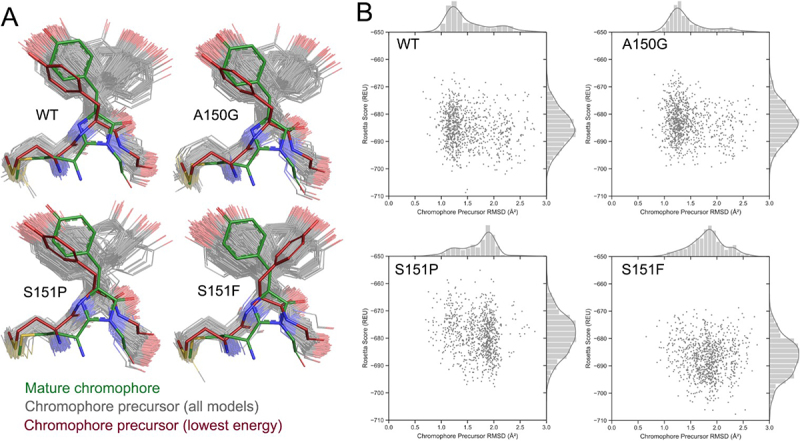
High-fidelity translation was considered a requirement for living cells. The frozen accident theory suggested that any deviation from the standard genetic code should result in the production of so much mis-made and non-functional proteins that cells cannot remain viable. Studies in bacterial, yeast, and mammalian cells show that significant levels of mistranslation (1-10% per codon) can be tolerated or even beneficial under conditions of oxidative stress. Single tRNA mutants, which occur naturally in the human population, can lead to amino acid mis-incorporation at a codon or set of codons. The rate or level of mistranslation can be difficult or impossible to measure in live cells. We developed a novel red fluorescent protein reporter that is sensitive to serine (Ser) mis-incorporation at proline (Pro) codons. The mCherry Ser151Pro mutant is efficiently produced in Escherichia coli but non-fluorescent. We demonstrated in cells and with purified mCherry protein that the fluorescence of mCherry Ser151Pro is rescued by two different tRNASer gene variants that were mutated to contain the Pro (UGG) anticodon. Ser mis-incorporation was confirmed by mass spectrometry. Remarkably, E. coli tolerated mistranslation rates of ~10% per codon with negligible reduction in growth rate. Conformational sampling simulations revealed that the Ser151Pro mutant leads to significant changes in the conformational freedom of the chromophore precursor, which is indicative of a defect in chromophore maturation. Together our data suggest that the mCherry Ser151 mutants may be used to report Ser mis-incorporation at multiple other codons, further expanding the ability to measure mistranslation in living cells.
Keywords: Fluorescent live-cell reporter; genetic code; mistranslation; protein synthesis; transfer RNA; translation fidelity.
Conflict of interest statement
No potential conflict of interest was reported by the author(s).
Figures
Similar articles
-
Mistranslating the genetic code with leucine in yeast and mammalian cells.RNA Biol. 2024 Jan;21(1):1-23. doi: 10.1080/15476286.2024.2340297. Epub 2024 Apr 17. RNA Biol. 2024. PMID: 38629491 Free PMC article.
-
Perseverance of protein homeostasis despite mistranslation of glycine codons with alanine.Philos Trans R Soc Lond B Biol Sci. 2023 Feb 27;378(1871):20220029. doi: 10.1098/rstb.2022.0029. Epub 2023 Jan 11. Philos Trans R Soc Lond B Biol Sci. 2023. PMID: 36633285 Free PMC article.
-
Visualizing tRNA-dependent mistranslation in human cells.RNA Biol. 2018;15(4-5):567-575. doi: 10.1080/15476286.2017.1379645. Epub 2017 Nov 9. RNA Biol. 2018. PMID: 28933646 Free PMC article.
-
Mistranslation: from adaptations to applications.Biochim Biophys Acta Gen Subj. 2017 Nov;1861(11 Pt B):3070-3080. doi: 10.1016/j.bbagen.2017.01.031. Epub 2017 Jan 30. Biochim Biophys Acta Gen Subj. 2017. PMID: 28153753 Review.
-
The Importance of Being Modified: The Role of RNA Modifications in Translational Fidelity.Enzymes. 2017;41:1-50. doi: 10.1016/bs.enz.2017.03.005. Epub 2017 Apr 22. Enzymes. 2017. PMID: 28601219 Free PMC article. Review.
Cited by
-
Genetic Interaction of tRNA-Dependent Mistranslation with Fused in Sarcoma Protein Aggregates.Genes (Basel). 2023 Feb 18;14(2):518. doi: 10.3390/genes14020518. Genes (Basel). 2023. PMID: 36833445 Free PMC article.
-
Genome-wide screening reveals metabolic regulation of stop-codon readthrough by cyclic AMP.Nucleic Acids Res. 2023 Oct 13;51(18):9905-9919. doi: 10.1093/nar/gkad725. Nucleic Acids Res. 2023. PMID: 37670559 Free PMC article.
-
Engineered mischarged transfer RNAs for correcting pathogenic missense mutations.Mol Ther. 2024 Feb 7;32(2):352-371. doi: 10.1016/j.ymthe.2023.12.014. Epub 2023 Dec 16. Mol Ther. 2024. PMID: 38104240 Free PMC article.
-
Mistranslating the genetic code with leucine in yeast and mammalian cells.RNA Biol. 2024 Jan;21(1):1-23. doi: 10.1080/15476286.2024.2340297. Epub 2024 Apr 17. RNA Biol. 2024. PMID: 38629491 Free PMC article.
-
Perseverance of protein homeostasis despite mistranslation of glycine codons with alanine.Philos Trans R Soc Lond B Biol Sci. 2023 Feb 27;378(1871):20220029. doi: 10.1098/rstb.2022.0029. Epub 2023 Jan 11. Philos Trans R Soc Lond B Biol Sci. 2023. PMID: 36633285 Free PMC article.
References
Publication types
MeSH terms
Substances
Grants and funding
LinkOut - more resources
Full Text Sources
Other Literature Sources