. 2022 Feb 15;20(2):e3001536.
doi: 10.1371/journal.pbio.3001536. eCollection 2022 Feb.

Public human microbiome data are dominated by highly developed countries

Affiliations

Public human microbiome data are dominated by highly developed countries

Richard J Abdill et al. PLoS Biol. .

Abstract

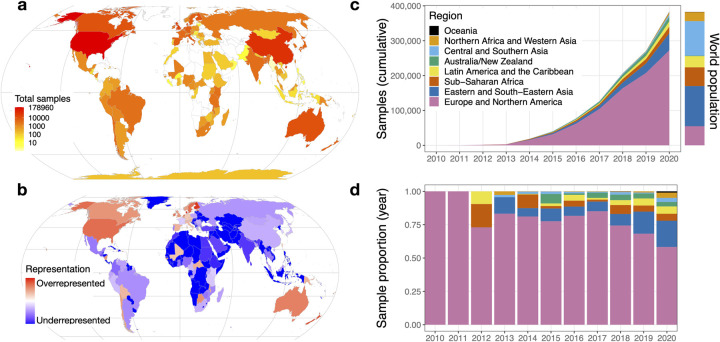
The importance of sampling from globally representative populations has been well established in human genomics. In human microbiome research, however, we lack a full understanding of the global distribution of sampling in research studies. This information is crucial to better understand global patterns of microbiome-associated diseases and to extend the health benefits of this research to all populations. Here, we analyze the country of origin of all 444,829 human microbiome samples that are available from the world's 3 largest genomic data repositories, including the Sequence Read Archive (SRA). The samples are from 2,592 studies of 19 body sites, including 220,017 samples of the gut microbiome. We show that more than 71% of samples with a known origin come from Europe, the United States, and Canada, including 46.8% from the US alone, despite the country representing only 4.3% of the global population. We also find that central and southern Asia is the most underrepresented region: Countries such as India, Pakistan, and Bangladesh account for more than a quarter of the world population but make up only 1.8% of human microbiome samples. These results demonstrate a critical need to ensure more global representation of participants in microbiome studies.


Conflict of interest statement

The authors have declared that no competing interests exist.

Figures

Fig 1
Fig 1. Global microbiome representation.
(a) Total samples by country. The color of each country indicates the total number of samples originating in that country using a log10 scale. (b) Relative representation by country. The color of each country indicates its representation in human microbiome datasets, relative to its share of world population. Red colors mark countries that are overrepresented relative to their population, and blue colors mark countries that are underrepresented. Countries with zero samples in the dataset are marked with dark blue. (c) Cumulative microbiome samples by world region. The x-axis indicates the year, and the y-axis indicates the cumulative microbiome samples available at the end of that year. Colors indicate the cumulative microbiome samples from each of the world regions specified in the legend. The colored bar to the right of the plot indicates the share of the world population living in each of the regions using the same colors. (d) Proportion of annual samples. The x-axis indicates the year, and the y-axis indicates the proportion of samples from each world region published in that year. Colors correspond to the world regions shown in panel C. The data and code needed to generate this figure can be found at https://doi.org/10.5281/zenodo.5351179. All maps are based on public domain Natural Earth data; the base layer is available for download at https://www.naturalearthdata.com/http//www.naturalearthdata.com/download/50m/cultural/ne_50m_admin_0_countries.zip.

Similar articles

Cited by

References

    1. Yatsunenko T, Rey FE, Manary MJ, Trehan I, Dominguez-Bello MG, Contreras M, et al.. Human gut microbiome viewed across age and geography. Nature. 2012;486:222–7. doi: 10.1038/nature11053 - DOI - PMC - PubMed
    1. Vangay P, Johnson AJ, Ward TL, Al-Ghalith GA, Shields-Cutler RR, Hillmann BM, et al.. US Immigration Westernizes the Human Gut Microbiome. Cell. 2018;175:962–72.e10. doi: 10.1016/j.cell.2018.10.029 - DOI - PMC - PubMed
    1. Kaplan RC, Wang Z, Usyk M, Sotres-Alvarez D, Daviglus ML, Schneiderman N, et al.. Gut microbiome composition in the Hispanic Community Health Study/Study of Latinos is shaped by geographic relocation, environmental factors, and obesity. Genome Biol. 2019;20:219. doi: 10.1186/s13059-019-1831-z - DOI - PMC - PubMed
    1. Goodrich JK, Waters JL, Poole AC, Sutter JL, Koren O, Blekhman R, et al.. Human genetics shape the gut microbiome. Cell. 2014;159:789–99. doi: 10.1016/j.cell.2014.09.053 - DOI - PMC - PubMed
    1. Blekhman R, Goodrich JK, Huang K, Sun Q, Bukowski R, Bell JT, et al.. Host genetic variation impacts microbiome composition across human body sites. Genome Biol. 2015;16:191. doi: 10.1186/s13059-015-0759-1 - DOI - PMC - PubMed

Publication types