. 2022 Apr 26;34(5):1957-1979.
doi: 10.1093/plcell/koac052.

Maize RNA 3'-terminal phosphate cyclase-like protein promotes 18S pre-rRNA cleavage and is important for kernel development

Affiliations

Maize RNA 3'-terminal phosphate cyclase-like protein promotes 18S pre-rRNA cleavage and is important for kernel development

Tao Wang et al. Plant Cell. .

Abstract

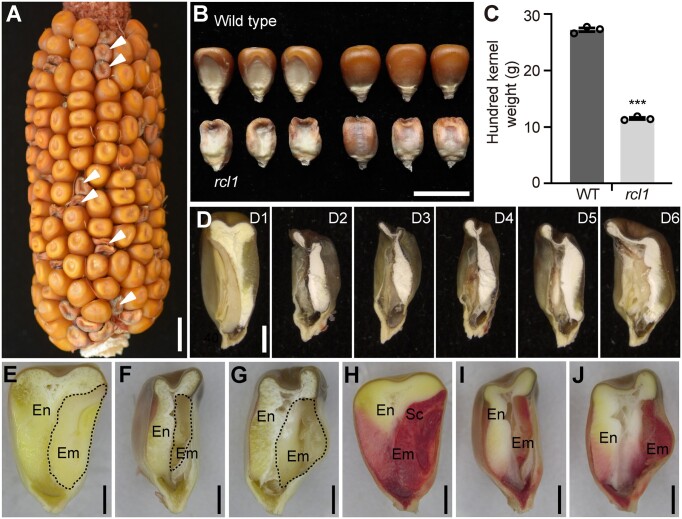
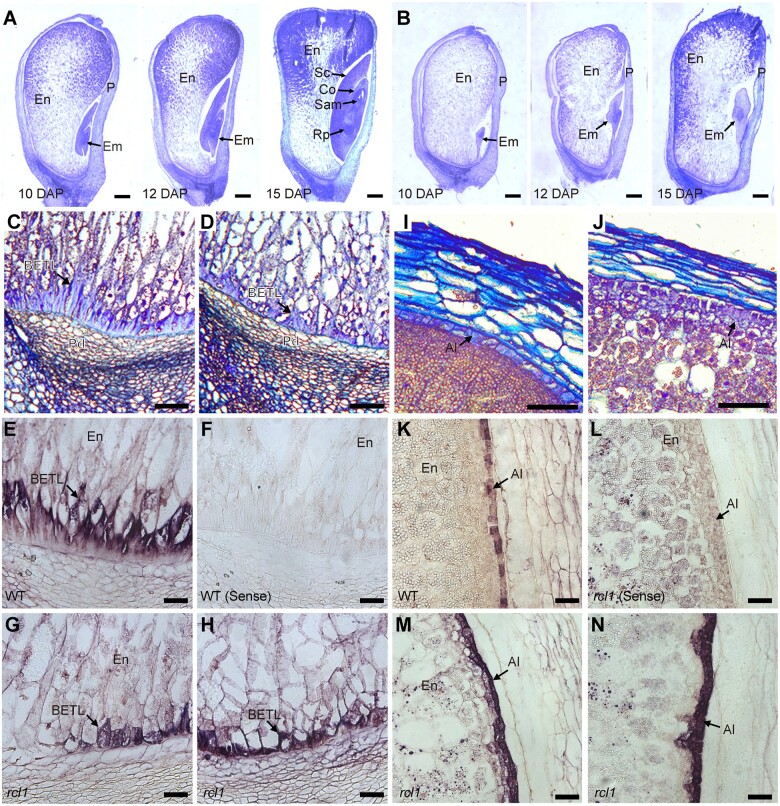
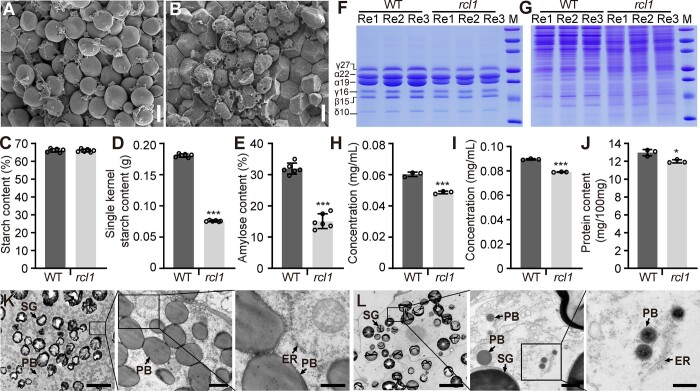
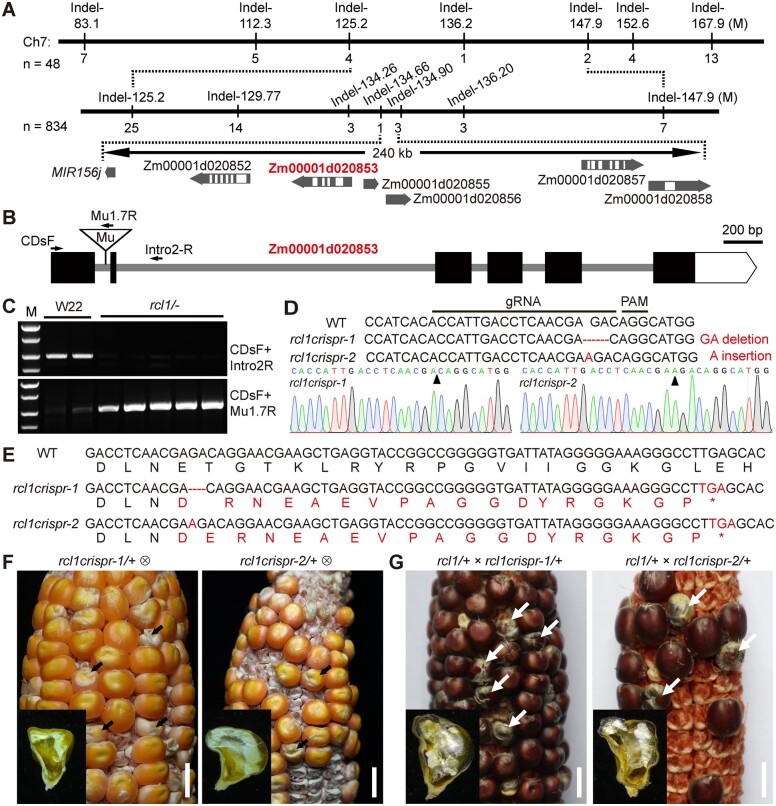
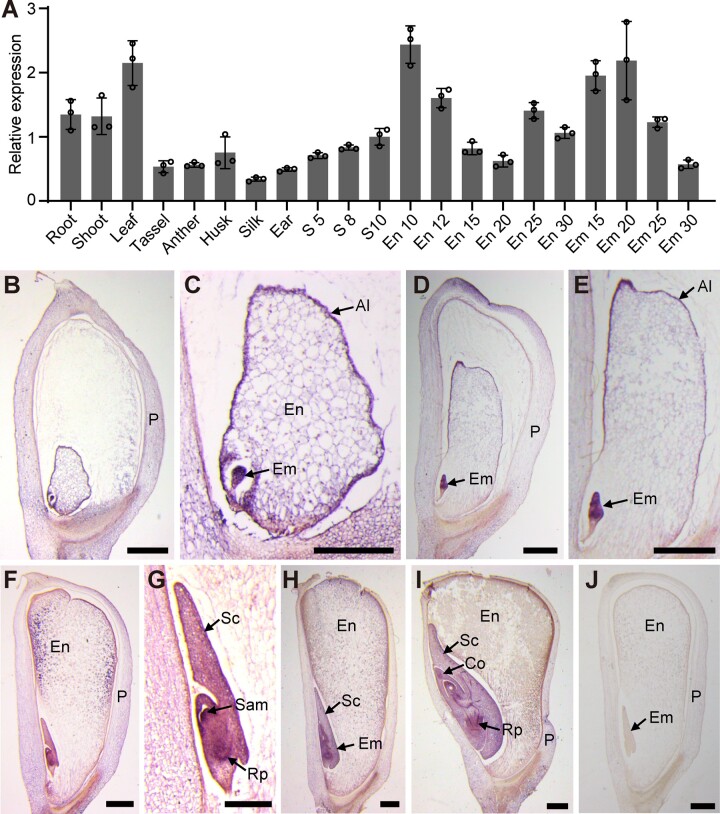
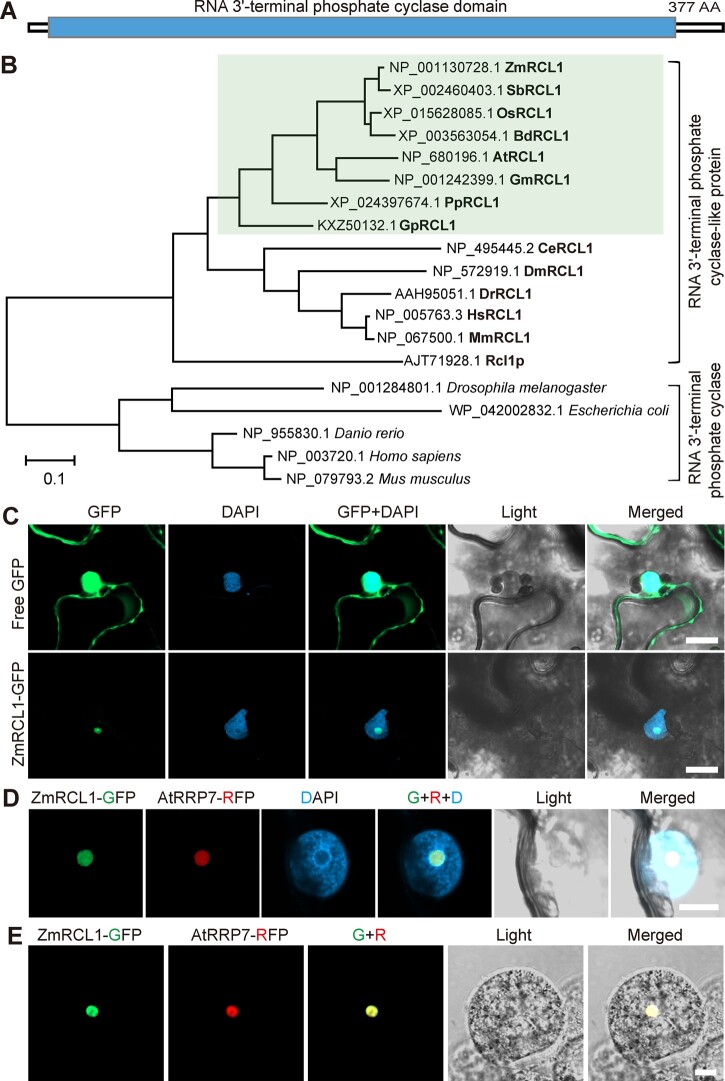
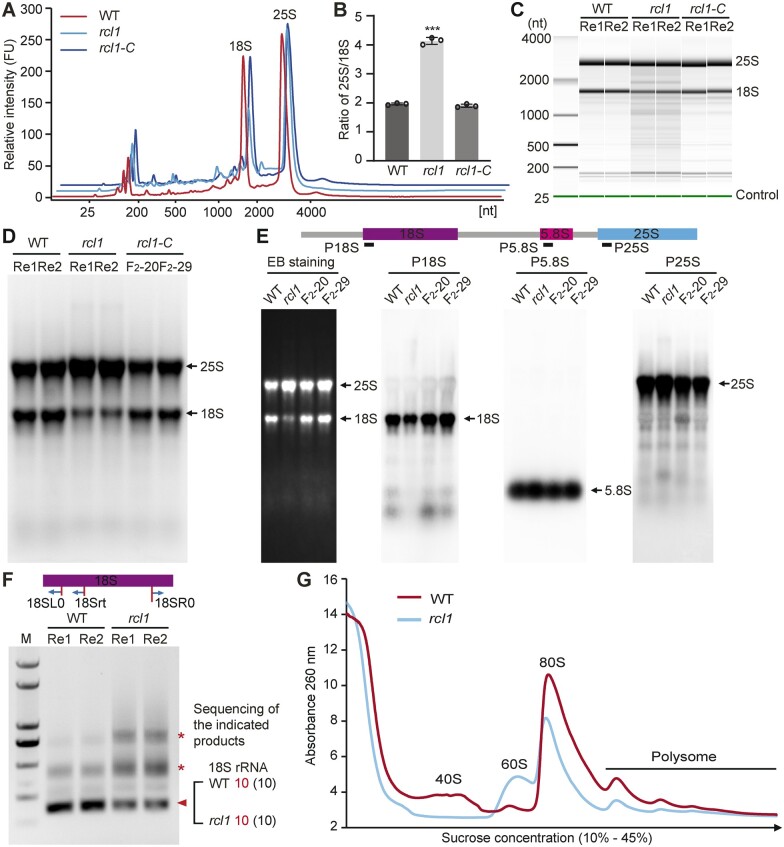
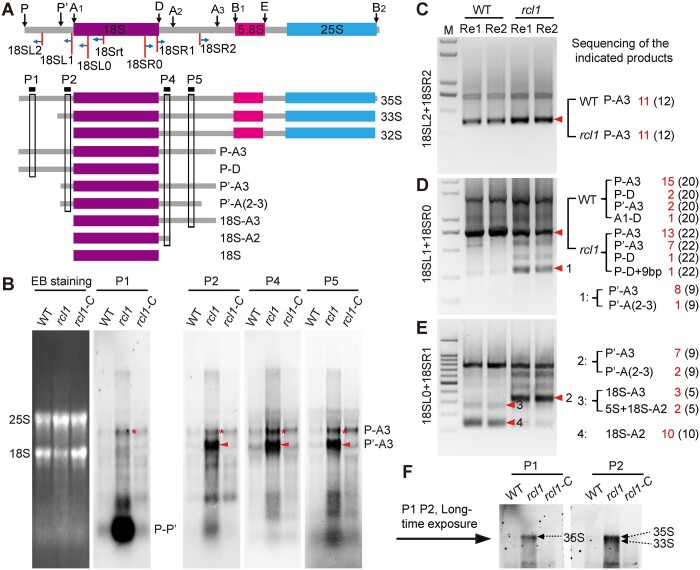
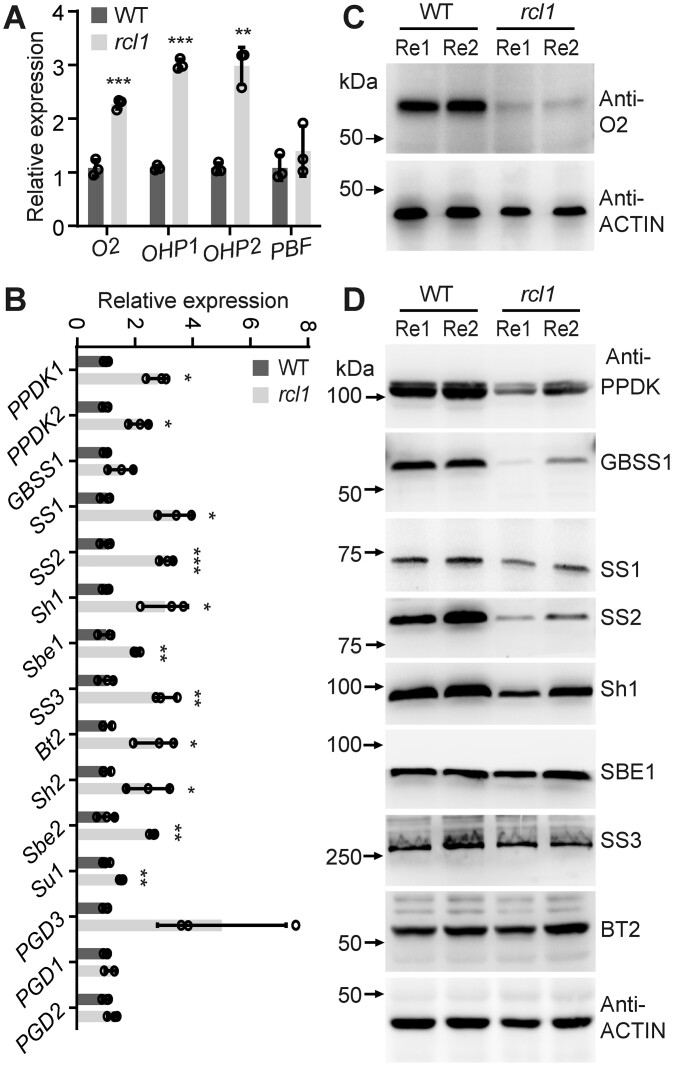
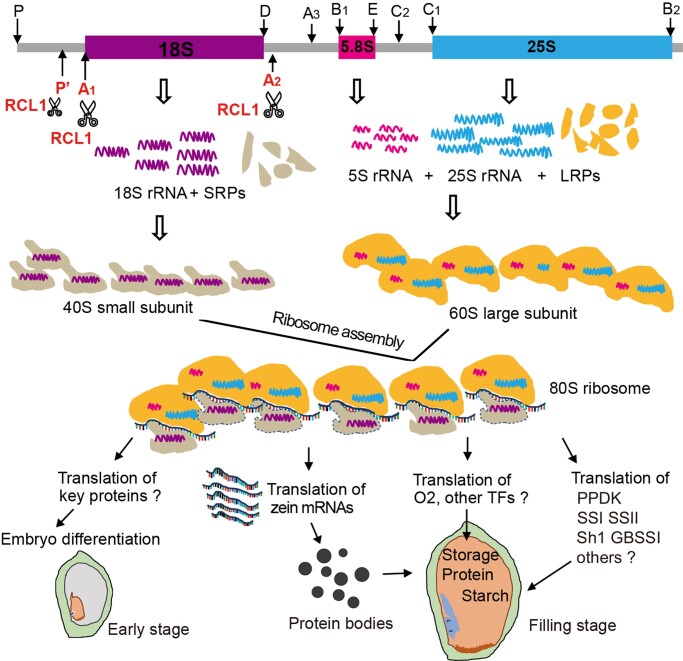
Plant ribosomes contain four specialized ribonucleic acids, the 5S, 5.8S, 18S, and 25S ribosomal RNAs (rRNAs). Maturation of the latter three rRNAs requires cooperative processing of a single transcript by several endonucleases and exonucleases at specific sites. In maize (Zea mays), the exact nucleases and components required for rRNA processing remain poorly understood. Here, we characterized a conserved RNA 3'-terminal phosphate cyclase (RCL)-like protein, RCL1, that functions in 18S rRNA maturation. RCL1 is highly expressed in the embryo and endosperm during early seed development. Loss of RCL1 function resulted in lethality due to aborted embryo cell differentiation. We also observed pleiotropic defects in the rcl1 endosperm, including abnormal basal transfer cell layer growth and aleurone cell identity, and reduced storage reserve accumulation. The rcl1 seeds had lower levels of mature 18S rRNA and the related precursors were altered in abundance compared with wild type. Analysis of transcript levels and protein accumulation in rcl1 revealed that the observed lower levels of zein and starch synthesis enzymes mainly resulted from effects at the transcriptional and translational levels, respectively. These results demonstrate that RCL1-mediated 18S pre-rRNA processing is essential for ribosome function and messenger RNA translation during maize seed development.


Figures

Figure 1
Figure 1
Kernel phenotype of rcl1. A, Self-pollinated ear from the heterozygous plant. White arrowheads indicate homozygous rcl1 kernels. Bar = 1 cm. B, Kernel phenotypes of the WT and rcl1 mature seeds. Bar = 1 cm. C, Comparison of hundred kernel weight of WT and rcl1. Seeds weight was measured from three self-pollinated rcl1/+ plants. Error bar represents ±SEM of the three ears (n = 50 for each ear). ***P < 0.001, Student’s t test. D, Longitudinal hand dissections of mature kernels of WT (D1) and rcl1 (D2–D6). Bars = 2 mm. E–G, Longitudinal hand dissections of 30 DAP kernels of WT (E) and rcl1 (F and G). Areas with dash lines showed the embryos. Bars = 2 mm. H–J, Seeds of WT (H) and rcl1 (I and J) stained with 2,3,5-triphenyltetrazolium chloride. The embryo tissues showed red color due to normal live-cell permeability. Bars = 2 mm. Em, embryo; En, endosperm; Sc, scutellum.
Figure 2
Figure 2
Light microscopy observations and in-situ hybridization analysis of morphology defects in rcl1. A and B, Light microscopy observations of paraffin-embedded developing kernels of WT (A) and rcl1 (B). Bars = 1 mm. C and D, Light microscopy observations of BETL in WT (C) and rcl1 (D) mutant. Bars = 100 μm. E–H, RNA in situ hybridization using BETL-specific Miniature1 probe in WT (E) and rcl1 mutant (G) and (H). Hybridized signals are shown in purple in BTEL cells. Sense probe produces no hybridization signal in WT (F). Bars = 200 μm. I and J, Light microscopy observations of aleurone in WT (I) and rcl1 (J) mutant. Bars = 100 μm. K–N, RNA in situ hybridization using aleurone-specific AL9 probe in WT (K) and rcl1 mutant (M) and (N). Sense probe produces no hybridization signal in rcl1 (L). Bars = 200 μm. Al, aleurone; BETL; basal endosperm transfer layer; Co, Coleoptile; Em, embryo; En, endosperm; Rp, root primordium; P, pericarp; Pd, pedicel; Sc, scutellum; Sam, shoot apical meristem.
Figure 3
Figure 3
Analysis of starch and protein in the WT and rcl1. A and B, Scanning electron microscopy observation of starch granules from central areas of WT (A) and rcl1 (B) mature seeds. Bars = 10 μm. C–E, Measurement of total starch (C), single kernel starch (D), and amylose (E) in WT and rcl1 dry seeds. Six biological replicated samples from different ears were prepared for analysis. F and G, SDS-PAGE analysis of zein (F) and non-zein (G) in mature seeds of WT and rcl1. Protein markers from top to bottom are 75, 50, 37, 25, 20, 15, and10 kDa. Re1, Re2, and Re3 mean three replicated proteins from different ears. H and I, Quantification of zein (H) and non-zein protein (I) concentration as shown in (F) and (G) using the BCA method. J, Dumas method quantification of total protein contents from three different ears of WT and rcl1 mature seeds. K and L, Transmission electron microscopy observation of 15 DAP endosperm in WT (K) and rcl1 (L). Boxed areas are enlarged in turn. Bars = 10 μm (left), 1 μm (middle), and 0.5 μm (right). ER, endoplasmic reticulum; PB, protein body; SG, starch granule. Error bars represent the ±SD. *P < 0.05, ***P < 0.001, Student’s t test.
Figure 4
Figure 4
Map-based cloning and allelic confirmation RCL1. A, Fine-mapping processes of RCL1 using an F2 population crossed between B73 and rcl1/+. The numbers under each vertical bar represent the amounts of recombinants identified by the corresponding indel marker on the top. The gene ID in red indicates the casual gene. B, Schematic diagram showing the RCL1 gene structure. The black boxes and gray lines indicate exons and introns, respectively. The triangle represents Mu1.7 insertion in the first intron. C, Amplification of the Mu1.7 insertion in homozygous rcl1 and W22 inbred line using primer pairs indicated in (B). DNA marker from top to bottom is 2.0, 1.5, 1.0, and 0.75 kb. D, Illustration of genome-edited rcl1 alleles by CRISPR/Cas9. The gRNA and protospacer adjacent motif (PAM) sequence are indicated. The resulted rcl1crispr-1 and rcl1crispr-2 lines contain 2-bp (GA) deletion and 1-bp (A) insertion, respectively (indicated by arrowheads). E, Nucleic acid and deduced amino acid sequences from WT, rcl1crispr-1, and rcl1crispr-2. The red font highlights the mutated amino acid sequences. Both transgenic lines lead to frameshift and premature stop codons. F, Self-pollinated ears of rcl1crispr-1/+ (left) and rcl1crispr-2/+ (right). The mutant seeds are indicated by arrows. Bars = 1 cm. G, Ears of a rcl1/+ ear crossed by pollen from rcl1crispr-1/+ (left) and rcl1crispr-2/+ (right) plants. Arrows indicate the mutant seeds. Bars = 1 cm.
Figure 5
Figure 5
The expression pattern of RCL1 gene. A, RT-qPCR analysis of RCL1 expression in different B73 tissues as indicated. The expression levels are normalized to the maize Ubi gene. The numbers after each tissue indicate the DAP. Error bras represent ±sd from three technical replicates. Experiments were repeated three times using biological samples from different ears with similar results. B–I, RNA in situ hybridization of RCL1 probe in B73 kernels at 5 DAP (B) and (C), 8 DAP (D) and (E), 10 DAP (F) and (G), 15 DAP (H) and 20 DAP (I). Hybridized signals are shown in purple. Bars = 2 mm. J, 10 DAP B73 kernel hybridized with sense probe. Bar = 2 mm. Al, aleurone; Co, coleoptile; Em, embryo; En, endosperm; S, seed; Sam, shoot apical meristem; P, pericarp.
Figure 6
Figure 6
Domain, phylogenetic, and subcellular localization analysis of RCL1. A, Diagram of the RCL1 protein structure. The blue box indicates conserved RNA 3′-terminal phosphate cyclase domain. AA, amino acids. B, Phylogenetic tree of putative RNA 3′-terminal phosphate cyclase and RNA 3′-terminal phosphate cyclase-like proteins (RCL) in representative species. The green boxed area indicates RCL proteins in plants. The scale bar represents the number of substitutions per site. ZmRCL1, Z. mays; SbRCL1, Sorghum bicolor; OsRCL1, O. sativa; BdRCL1, Brachypodium distachyon; AtRCL1, A. thaliana; GmRCL1, Glycine max; PpRCL1, Physcomitrium patens; GpRCL1, Gonium pectoral; CeRCL1, Caenorhabditis elegans; DmRCL1, Drosophila melanogaster; DrRCL1, Danio rerio; HsRCL1, Homo sapiens; MmRCL1, Mus musculus; Rcl1p, and Saccharomyces cerevisiae. C, Confocal images of free GFP and ZmRCL1-GFP fusion protein driven by 35S promoter in N. benthamiana leaf. The nucleuses are shown by DAPI staining. Bars = 20 μm. D and E, Co-localization of ZmRCL1-GFP and Arabidopsis RRP7 (AtRRp7-RFP) protein in N. benthamiana leaf (D) and maize endosperm protoplast (E). The nuclei are shown by DAPI staining. Bar = 10 μm. In C and D, transient expression experiments were repeated 2 times. The observed leaf number is 5 for free GFP, 5 for ZmRCL1-GFP and 8 for ZmRCL1 and AtRRP7 co-localization. At least six maize endosperm protoplasts were observed with similar results.
Figure 7
Figure 7
Reduced accumulation of 18S rRNA in rcl1 mutant. A, Comparison of RNA samples from15 DAP seeds using Agilent RNA 2100 Bioanalyzer. Three RNA samples from different ears of WT, rcl1, and rcl1-C were analyzed and similar results were obtained. B, Ratio of 25S and 18S rRNA. Error bars represent ±sd from three biological repeated samples. ***P < 0.001, Student’s t test. C, Simulative gel-like image generated by Agilent RNA 2100 bioanalyzer. Green lines indicate 25-bp internal control. Re1 and Re2 represent the two RNA samples from different ears. D, Denaturing agarose-formaldehyde gel analysis of RNA samples from15 DAP seeds of WT, rcl1, and two complemented rcl1 lines (F2-20, F2-29). Re1 and Re2 represent two RNA samples from different ears. E, RNA gel blot analysis of the mature rRNA levels. Total RNA was isolated from 15 DAP seeds from WT, rcl1 and two complemented lines (F2-20 and F2-29). Equal amount of RNA samples was separated in a denaturing agarose-formaldehyde gel for each probe. An EB staining membrane is shown as a loading control. Positions of rRNA species are indicated on the right. F, Circular RT-PCR analysis using cDNA reverse transcribed with the 18Srt primer. Primers are located in the 5′ and 3′ of mature 18S rRNA. Triangle points to mature 18S rRNA verified by sequencing. Asterisks indicate accumulated bands in rcl1. Re1 and Re2 represent two RNA samples from different ears. G, Polysome profiles of WT and rcl1 mutant. Total seed extractions at 15 DAP were resolved in 10%–45% (w/v) sucrose gradients. The resulted gradient was analyzed by continuous monitoring at A260. The peaks of free 40S and 60S ribosomal subunits, 80S free monosomes and polysomes are indicated. Two repeated samples from different ears were analyzed with similar results. The average value was used to generate the absorbance curve.
Figure 8
Figure 8
Loss of RCL1 function affects 18S pre-rRNA processing. A, Diagram illustrating the 35S pre-rRNA structure, various cleavage sites, the pre-rRNA processing intermediates, the locations of RNA gel blots probes and the primers used for circular RT-PCR analysis. Black arrows above the diagram indicate cleavage sites. B, RNA gel blot analysis of 18S pre-rRNAs accumulating in the WT, rcl1 and complemented rcl1 line (rcl1-C) at 15 DAP. Equal amounts of total RNA were loaded and transferred to different membranes subjected to hybridization with probes as indicated in (A). Ethidium bromide staining (EB stain) of a membrane is shown (leftmost) as a loading control. C, Circular RT-PCR analysis of P-A3 intermediate. Primer location was indicated in (A). The cDNA was reverse transcribed with the 18Srt specific primer. D and E, Identification of the 5′ (D) and 3′ (E) terminals of 18S pre-rRNAs by circular RT-PCR. Primer’s location was indicated in (A). Red triangle pointed to pre-rRNA intermediates analyzed by clone sequencing. The results were listed on the right spaces. F, Long time exposure picture of P1 and P2 hybridization as in (B) showing increased 35S and 35S/33S intermediates in rcl1. In (C–E), numbers in the brackets mean total clones sequenced and the fonts in red indicate the corresponding fragments before. Re1 and Re2 represent two replicated RNA samples from different ears.
Figure 9
Figure 9
Analysis of transcript and protein of zein gene regulators and starch-related enzymes. A and B, Quantitative RT-PCR showing relative expressions of zein gene regulators (A) and starch-related enzymes (B) in the WT and rcl1. The data shown were obtained from three biological replicates from different ears. Error bars represent ±sd. *P < 0.05, **P < 0.01, and ***P < 0.001, Student’s t test. C and D, Immunoblots for protein accumulations of O2 (C) and starch-related enzymes (D) in the WT and rcl1 seeds. Non-zein proteins from 15-DAP kernels of WT and rcl1 were subjected to immunoblot analysis. The ACTIN antibody was used as a loading control. Re1 and Re2 represent two replicated proteins from different ears.
Figure 10
Figure 10
A proposed model for the role of RCL1. RCL1 participates in P′, A1 and A2 sites cleavage located in the 5′ and 3′ ends of mature 18S rRNA, which is essential for 40S small subunit maturation and mature 80S ribosome assembly. The resulting ribosomes translate proteins for embryo cell differentiation, zein proteins translation, and transcription factors and enzymes for storage reserve synthesis.

Similar articles

Cited by

References

    1. Ameismeier M, Zemp I, van den Heuvel J, Thoms M, Berninghausen O, Kutay U, Beckmann R (2020) Structural basis for the final steps of human 40S ribosome maturation. Nature 587: 683–687 - PubMed
    1. Amsterdam A, Nissen RM, Sun Z, Swindell EC, Farrington S, Hopkins N (2004) Identification of 315 genes essential for early zebrafish development. Proc Natl Acad Sci USA 101: 12792–12797 - PMC - PubMed
    1. An W, Du Y, Ye K (2018) Structural and functional analysis of Utp24, an endonuclease for processing 18S ribosomal RNA. PLoS ONE 13: e0195723. - PMC - PubMed
    1. Armistead J, Triggs-Raine B (2014) Diverse diseases from a ubiquitous process: the ribosomopathy paradox. FEBS Lett 588: 1491–1500 - PubMed
    1. Billy E, Hess D, Hofsteenge J, Filipowicz W (1999) Characterization of the adenylation site in the RNA 3'-terminal phosphate cyclase from Escherichia coli. J Biol Chem 274: 34955–34960 - PubMed

Publication types

MeSH terms