. 2022 Apr 10:531:124-135.
doi: 10.1016/j.canlet.2022.01.029. Epub 2022 Feb 12.

NEDD4 degrades TUSC2 to promote glioblastoma progression

Affiliations

NEDD4 degrades TUSC2 to promote glioblastoma progression

Tadas K Rimkus et al. Cancer Lett. .

Abstract

Whether tumor suppressor candidate 2 (TUSC2) plays an important role in glioblastoma (GBM) progression is largely unknown. Whether TUSC2 undergoes polyubiquitination is unknown. Herein, we report that TUSC2 protein expression is reduced/lost in GBM compared to normal brain due to protein destabilization; TUSC2 mRNA is equally expressed in both tissues. NEDD4 E3 ubiquitin ligase polyubiquitinates TUSC2 at residue K71, and the TUSC2-K71R mutant is resistant to NEDD4-mediated proteasomal degradation. Analysis of GBM specimens showed NEDD4 protein is highly expressed in GBM and the level is inversely correlated with TUSC2 protein levels. Furthermore, TUSC2 restoration induces apoptosis and inhibits patient-derived glioma stem cells (PD-GSCs) in vitro and in vivo. Conversely, TUSC2-knockout promotes PD-GSCs in vitro and in vivo. RNA-Seq analysis and subsequent validations showed GBM cells with TUSC2-knockout expressed increased Bcl-xL and were more resistant to apoptosis induced by a Bcl-xL-specific BH3 mimetic. A TUSC2-knockout gene signature created from the RNA-seq data predicts poor patient survival. Together, these findings establish that NEDD4-mediated polyubiquitination is a novel mechanism for TUSC2 degradation in GBM and that TUSC2 loss promotes GBM progression in part through Bcl-xL upregulation.

Keywords: Glioblastoma; Glioma stem cells; NEDD4; TUSC2; Tumor suppressor.


Conflict of interest statement

Declaration of Interest Statement

Authors declare no conflict of interests.

Figures

Figure 1.
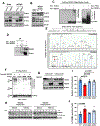
Figure 1.. TUSC2 protein, but not mRNA expression, is frequently lost in GBM.
A)TUSC2 mRNA is equally expressed in astrocytes (NHA, C8-S and immortalized human astrocytes respectively) and GBM cells and patient samples (top panel; RT-PCR), but TUSC2 protein expression is significantly decreased in GBM cell lines and patient samples (lower panel; western blots/WB). Densitometric analysis was completed using ImageJ and values are placed below blot and were normalized to NHA. B,C) Analysis of GSE4290 dataset showed that TUSC2 mRNA was equally expressed between normal brain (N=23) and GBM (N=81), and across glioma grades (N=45, N=31, N=81 respective to grade). D) Human TUSC2 gene promoter is rarely methylated in GBM patient samples. TUSC2 gene promoter methylation status was retrieved from the TCGA GBM dataset. Percentage of patients with methylated TUSC2 gene promoter is shown (N=285). E) TUSC2 protein is highly expressed in normal brain samples (N=80), but not in GBM patient tumors (N=63), as shown by IHC. Immunostained sections were scored by a pathologist to derive H-scores. F) Representative IHC images were taken at 10X magnification, scale bar indicates 50 μm. G) Normal healthy human brain tissue was subjected to immunofluorescence staining using antibodies specific to TUSC2, Nestin (neural stem cell marker), GFAP (astrocyte marker), and Olig2 (oligodendrocyte marker). Overlaid images with yellow co-staining indicate co-expression of TUSC2 and lineage-specific markers. Images were taken at 10X magnification, scale bar indicates 50 μm, increased magnificaiton images are at 40X. Data are presented as mean±SE. Student’s t-test and ANOVA were used to calculate p-values.
Figure 2.
Figure 2.. TUSC2 protein is destabilized in GBM via proteasome-mediated degradation; TUSC2 physically interacts with NEDD4 E3 ligase.
A) Astrocytes and G48a GBM cells were treated with 10 μg/mL cycloheximide (CHX) and either with or without proteasome inhibitor MG132 (10 μM). Densitometric analysis was completed using ImageJ and values are placed below blot. B) TUSC2 is polyubiquitinated in GBM cells. TUSC2 was overexpressed in TUSC2-low U251MG cells and subjected to immunoprecipitation (IP) with anti-TUSC2 antibody (Ab). IgG was used as an IP control. Resulting immunoprecipitates were analyzed by WB for ubiquitin (Ub). C) MG132 inhibits degradation of polyubiquitinated TUSC2. U251MG cells were treated with or without MG132 (10 μM). Resulting lysates were subjected to WB for TUSC2. D,E) Analysis of the GEO dataset (GSE4290) identified four E3 ubiquitin ligases overexpressed in GBM (N=81) compared to normal brain (N=23) samples (p<0.05; ≥2-fold). F) NEDD4 binds to TUSC2 in GBM cells. TUSC2 was overexpressed in U251MG cells treated with 5 μM ZVAD and subjected to IP with a TUSC2 Ab. IgG was used as control for IP. Resulting immunoprecipitates were subjected to WB for DTL, NEDD4, MDM2, UBE3C, and TUSC2. G) TUSC2 is bound to NEDD4 in GBM cells. TUSC2 was overexpressed in U251MG cells treated with 5 μM ZVAD and were subjected to IP with a NEDD4 Ab and WB for TUSC2. H) TUSC2 and NEDD4 co-localize in vitro. G48a cells were transfected with TUSC2 and NEDD4 and treated with 10 μM MG132 and 5 μM ZVAD, and then subjected to immunofluorescence staining and confocal microscopy with images taken at 20X, scale bar indicates 100 μm. TUSC2 is indicated in green, NEDD4 in red. Data are presented as mean±SE. Student’s t-test was used to calculate p-values.
Figure 3.
Figure 3.. NEDD4 polyubiquitinates TUSC2 at K71 in GBM, leading to TUSC2 degradation.
A) NEDD4 overexpression decreased TUSC2 protein expression. NEDD4 was overexpressed in two different TUSC2-positive GBM cell lines and the resulting lysates were subjected to WB. B) NEDD4 knockdown by two different NEDD4 shRNAs increased TUSC2 expression in U87MG cells, as shown by WB. C) In a cell-free ubiquitination assay, recombinant NEDD4 ubiquitinated recombinant TUSC2. Reaction was subjected to WB with a TUSC2 Ab. PTEN was used as a positive control for NEDD4 ubiquitination activity. D) TUSC2 directly binds NEDD4. Following a cell-free ubiquitination assay, the product was subjected to IP with NEDD4 antibody and TUSC2 antibody for WB. E) TUSC2 has six lysine residues (top). Mass spectrometry showed that K71 on TUSC2 is ubiquitinated by NEDD4 (+114). Ubiquitinated and un-ubiquitinated TUSC2 products from the NEDD4 cell-free ubiquitination assay were isolated from the SDS-PAGE gel and subjected to mass spectrometry. F) TUSC2-K71R mutant lost the ability to be polyubiquitinated by NEDD4. G48a-TUSC2-KO cells were transfected with wild-type Flag-TUSC2, K71R, K84R, or K93R Flag-TUSC2 mutant, and subjected to IP. Resulting immunoprecipitates were then subjected to the cell-free NEDD4 ubiquitination assay with recombinant NEDD4. G) TUSC2-K71R protein level was not affected by NEDD4 overexpression. U87MG cells were transfected with TUSC2 or TUSC2-K71R, and either NEDD4 or empty vector. Resulting lysates were subjected to WB. H) TUSC2-K71R mutant displayed increased protein stability compared to wild-type TUSC2. G48a-TUSC2-KO cells transfected with NEDD4, and either TUSC2 or TUSC2-K71R were treated with 10 μg/mL CHX, with or without proteasome inhibitor MG132 (10 μM). Densitometry was completed using ImageJ and is placed below blot. I,J) TUSC2 K71R decreases GBM stemness and increases apoptosis. GSC28 cells were transfected with either TUSC2-WT, K71R, K84R, and K93R mutants for 48 hours, and were reseeded for neurosphere assay (N=5 per group) or stained for TUNEL (N=4 per group). Data are presented as mean±SE. ANOVA was used to calculate p-values.
Figure 4.
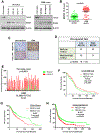
Figure 4.. TUSC2 and NEDD4 proteins are inversely expressed in GBM, PD-GSCs, and normal brain samples.
A) TUSC2 and NEDD4 are inversely expressed between cultured GBM and PD-GSCs, and astrocytes, as shown by WB. B) NEDD4 expression was higher in GBM samples (N=63) compared to normal brain samples (N=80), as shown by IHC. Immunostained sections were scored by a pathologist to derive H-scores. Student’s t-test was used to compute p-values. C) Representative IHC images of immunostained tissues. Images were taken at 10X magnification, scale bar indicates 50 μm. D,E) TUSC2 and NEDD4 are inversely expressed. In Panel D, two-by-two Chi-squared analysis of brain and GBM tissues was conducted. In Panel E, pair-wise t-test was used. F-H) High NEDD4 mRNA expression predicts poorer overall survival in glioma patients. Three datasets, TCGA GBM Only (N=165) (F), TCGA Combined Glioma (N=667) (G), and Rembrandt Combined Glioma (397) (H), were analyzed by Kaplan-Meier survival analysis based on NEDD4 expression. Mantel-Cox log-rank test was used to compute p-values. Data are presented as mean±SE.
Figure 5.
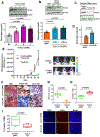
Figure 5.. Restoring TUSC2 expression induces apoptosis and inhibits PD-GSCs in vitro and in vivo.
A,B) TUSC2 re-expression in PD-GSCs inhibited neurosphere formation. PD-GSCs were transfected with either TUSC2 or a control vector. TUSC2 expression was confirmed by WB (A). PD-GSCs were seeded and counted 7 days later (N=3 per group) (B). C) TUSC2 re-expression inhibited colony and neurosphere formation in cultured GBM cells. U251MG cells transfected with either TUSC2 or empty vector were seeded for colony formation assay (250 cells/well) (N=3 per group) or neurosphere formation assay (1000 cells/well) (N=4 per group). TUSC2 expression was confirmed by WB. D) Generation of PD-GSCs with doxycycline (dox)-inducible TUSC2 lentiviral vector (GSC28-indTUSC2). Two separate clones were generated and dox-induction (1 μg/mL) of TUSC2 expression was confirmed by WB. E) Dox-induced re-expression of TUSC2 inhibited neurosphere-forming capacity of GSC-28. GSC28-indTUSC2 cells were treated with dox (1 μg/mL) to induce TUSC2 expression, seeded for the assay, and counted after 7 days (N=4 per group). F) TUSC2 re-expression induced apoptosis. GSC28-indTUSC2 neurospheres were treated with dox (1 μg/mL) for 72 hours, attached to microscope slides using cytospin centrifugation, and subjected to TUNEL and DAPI staining (N=4 per group). Neurospheres were analyzed using a confocal microscope with images taken at 10X magnification, scale bar indicates 50 μm. G) Schema for GSC28-indTUSC2 orthotopic implantation animal experiment. Isogenic luciferase-expressing GSC28-indTUSC2 cells were injected into the right frontal lobe of female nude mice (N=10–12 per group) and tumor growth was assessed weekly via bioluminescent imaging. Pre-induction group mice started receiving water supplemented with Dox (2 mg/mL) or 5% sucrose 2 days prior to intracranial cell implantation. Post-induction group started receiving water supplemented with Dox (2 mg/mL) and 5% sucrose 7 days after intracranial implantation. H) TUSC2 re-expression prevented tumor development in the pre-induction group. Bioluminescent images were analyzed, and the mean total bioluminescent flux was plotted. I) TUSC2 re-expression reduced tumor development rates. Representative bioluminescent images of actively growing tumors at day 21. Differences in tumor detection rate were determined using 2-by-3 Fisher’s exact test. J) TUSC2 pre-induction prolonged survival in mice bearing GSC28-indTUSC2 xenografts. Kaplan-Meier survival curves with Mantel-Cox log-rank test used to determine p-values. K) TUSC2-expressing xenografts displayed significantly increased apoptosis as shown by TUNEL staining with corresponding H&E. Images were taken at 10X magnification, scale bar indicates 50 μm. Representative xenografts (N=5 per group) from each group were analyzed for apoptosis. ANOVA was used to compute p-values.
Figure 6.
Figure 6.. Loss of TUSC2 expression promotes GBM aggressiveness in vitro and in vivo.
A,B) TUSC2 knockdown promotes neurosphere formation in GBM cells. TUSC2-positive G48a cells transfected with three different TUSC2-targeting siRNAs (N=4 per group) (A) or two unique TUSC2 CRISPR/Cas9 guide RNA (gRNA) constructs (N=4 per group) (B) were subjected to a neurosphere assay. Results for WB (top panel) and neurosphere assay (bottom panels) are shown. C) Isogenic G48a GBM cells carrying lentiviral control CRISPR/Cas9 gRNA or TUSC2-targeting gRNA (TUSC2-KO) were subjected to WB. D) Stable G48a-TUSC2-KO cells displayed increased neurosphere-forming ability (N=4 per group). E) TUSC2-KO promoted GBM orthotopic xenografts growth. Isogenic luciferase-expressing G48a-TUSC2-KO and G48a-Control-gRNA cells were injected into the right frontal lobe of female nude mice (N=9 per group) and tumor growth was assessed weekly via bioluminescent imaging. Representative images of actively growing tumors at Day 56 are shown. F-H) TUSC2-KO xenografts were more proliferative than the control xenografts. Representative xenografts (N=5 per group) were subjected to H&E staining and IHC for TUSC2 and Ki-67. Images taken at 20x magnification; scale bar indicates 100 μm. Immunostained sections were scored by a pathologist and H-scores were calculated. I) Xenografts were examined for apoptosis using TUNEL staining (N=3 per group). Xenografts with Control-gRNA, still containing TUSC2, contained higher positive TUNEL signal as compared to the TUSC2-KO xenograft samples, as seen in the graph and representative images on the right. Images were taken at 10X magnification, scale bar indicates 50 μm. Student’s t-test and was used to compute p-values.
Figure 7.
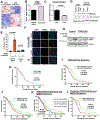
Figure 7.. TUSC2 suppresses GBM growth by modulating cellular apoptotic machinery.
A) RNA-Seq analysis of G48a-TUSC2-KO and G48a-Control-gRNA cells. Heatmap shows per-sample expression values of differentially expressed genes (N=4 per group; p<0.05). B-D) Bcl-xL was validated as a TUSC2-modulated gene, as shown by RT-qPCR (B, C) (N=3 per group) and WB (D) in two cell lines. E-G) TUSC2-KO cells are resistant to A-1331852 treatment. G48a-Control-gRNA and G48a-TUSC2 KO cells were treated with vehicle or 1 uM of A-1331852 for 48 hours and were then subjected to TUNEL and WB (N=6 per group). Representative TUNEL images were taken at 10X magnification, scale bars indicate 75 μm (F). Corresponding WB probing for PARP (G). Densitometric analysis was completed using ImageJ and values are placed below blot. H) TUSC2 mRNA is not predictive of GBM patient survival (TCGA dataset) (N=165). I) The NEDD4 gene signature is predictive of overall worse survival in GBM patients (TCGA dataset) (N=165) with high NEDD4 signature patients having worse overall survival. J) The TUSC2-KO-Up gene signature is a prognostic indicator for poor overall survival in GBM patients (TCGA dataset) (N=165), with high TUSC2-KO-Up gene signature patients having overall worse survival. K) Patients with high NEDD4 and high TUSC2-KO-Up Gene Signatures had the worst overall survival rate (N=165). L) The NEDD4 and TUSC2-KO-Up gene signatures were combined and patients with high expression of the combination signature had a worse overall survival (N=165). Kaplan-Meier survival curves were plotted with data from the TCGA GBM dataset. Student’s t-test, and Mantel-Cox log-rank test was used to calculate p-value.

References

    1. Dolecek TA, Propp JM, Stroup NE, Kruchko C, CBTRUS statistical report: primary brain and central nervous system tumors diagnosed in the United States in 2005–2009, Neuro-oncology, 14 Suppl 5 (2012) v1–49. - PMC - PubMed
    1. Omuro A, DeAngelis LM, Glioblastoma and other malignant gliomas: A clinical review, JAMA, 310 (2013) 1842–1850. - PubMed
    1. Anjum K, Shagufta BI, Abbas SO, Patel S, Khan I, Shah SAA, et al., Current status and future therapeutic perspectives of glioblastoma multiforme (GBM) therapy: A review, Biomedicine and Parmacotherapy, 92 (2017) 10. - PubMed
    1. Brennan CW, Verhaak RGW, McKenna A, Campos B, Noushmehr H, Salama SR, Zheng S, Chakravarty D, Sanborn JZ, Berman SH, Beroukhim R, Bernard B, Wu C-J, Genovese G, Shmulevich I, Barnholtz-Sloan J, Zou L, Vegesna R, Shukla SA, Ciriello G, Yung WK, Zhang W, Sougnez C, Mikkelsen T, Aldape K, Bigner DD, Van Meir EG, Prados M, Sloan A, Black KL, Eschbacher J, Finocchiaro G, Friedman W, Andrews DW, Guha A, Iacocca M, O’Neill BP, Foltz G, Myers J, Weisenberger DJ, Penny R, Kucherlapati R, Perou CM, Hayes DN, Gibbs R, Marra M, Mills GB, Lander E, Spellman P, Wilson R, Sander C, Weinstein J, Meyerson M, Gabriel S, Laird PW, Haussler D, Getz G, Chin L, The Somatic Genomic Landscape of Glioblastoma, Cell, 155 (2013) 462–477. - PMC - PubMed
    1. N. The Cancer Genome Atlas Research, Comprehensive genomic characterization defines human glioblastoma genes and core pathways, Nature, 455 (2008) 9. - PMC - PubMed

Publication types

Substances