. 2022 Apr;604(7904):141-145.
doi: 10.1038/s41586-022-04527-1. Epub 2022 Feb 15.

Germinal centre-driven maturation of B cell response to mRNA vaccination

Affiliations

Germinal centre-driven maturation of B cell response to mRNA vaccination

Wooseob Kim et al. Nature. 2022 Apr.

Abstract

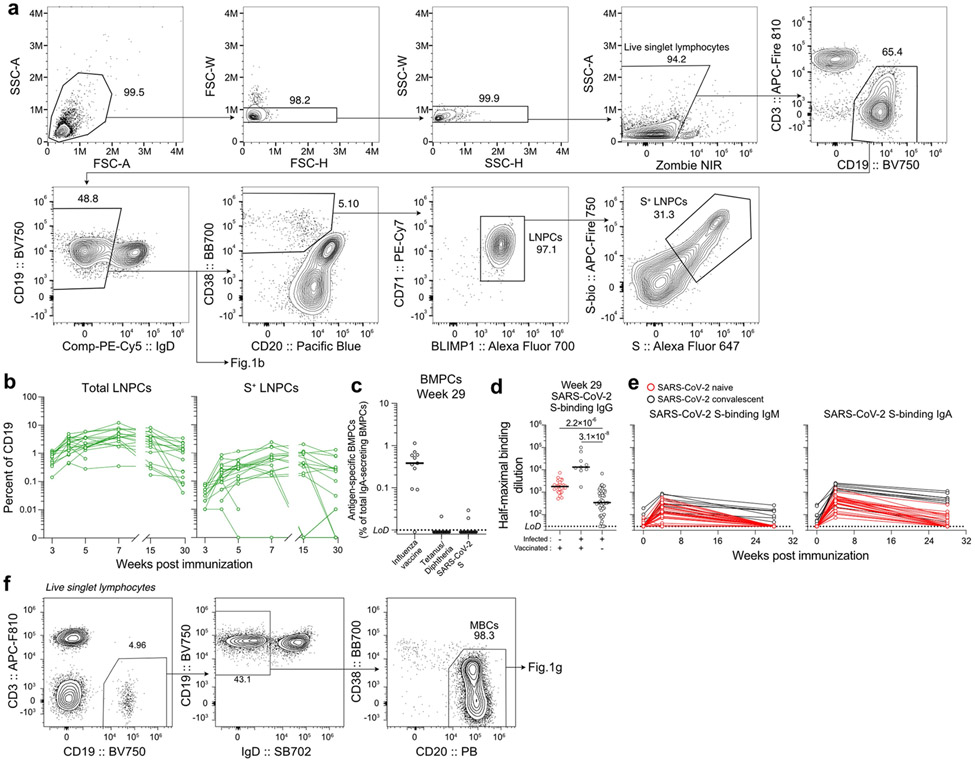
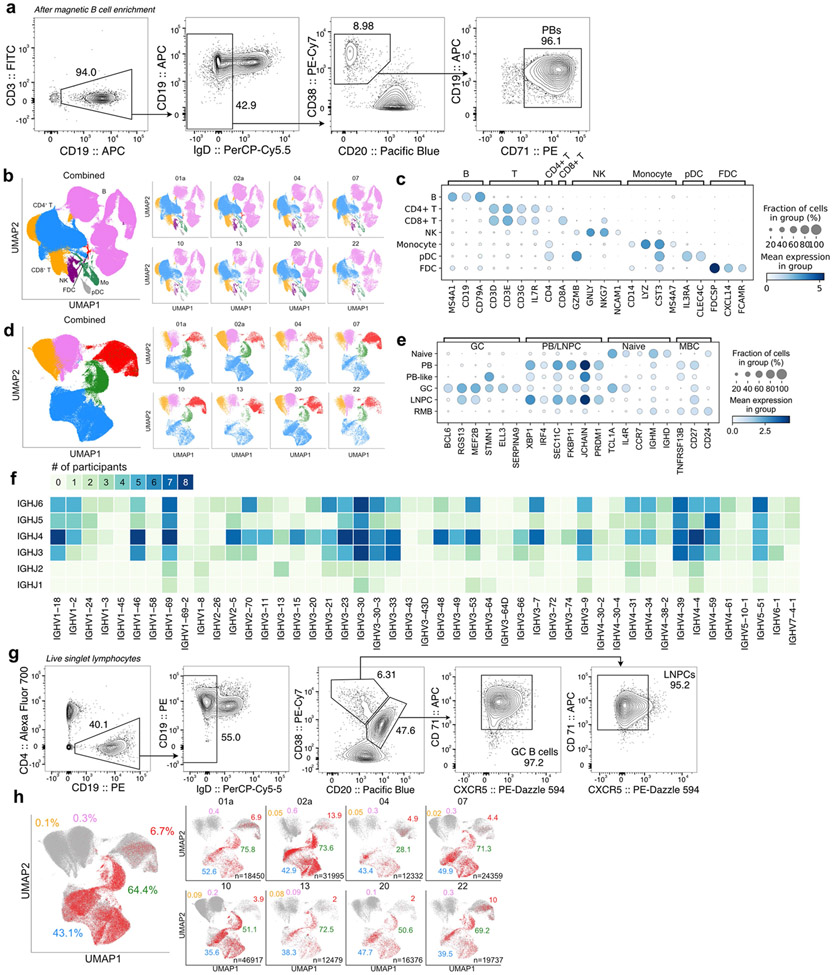
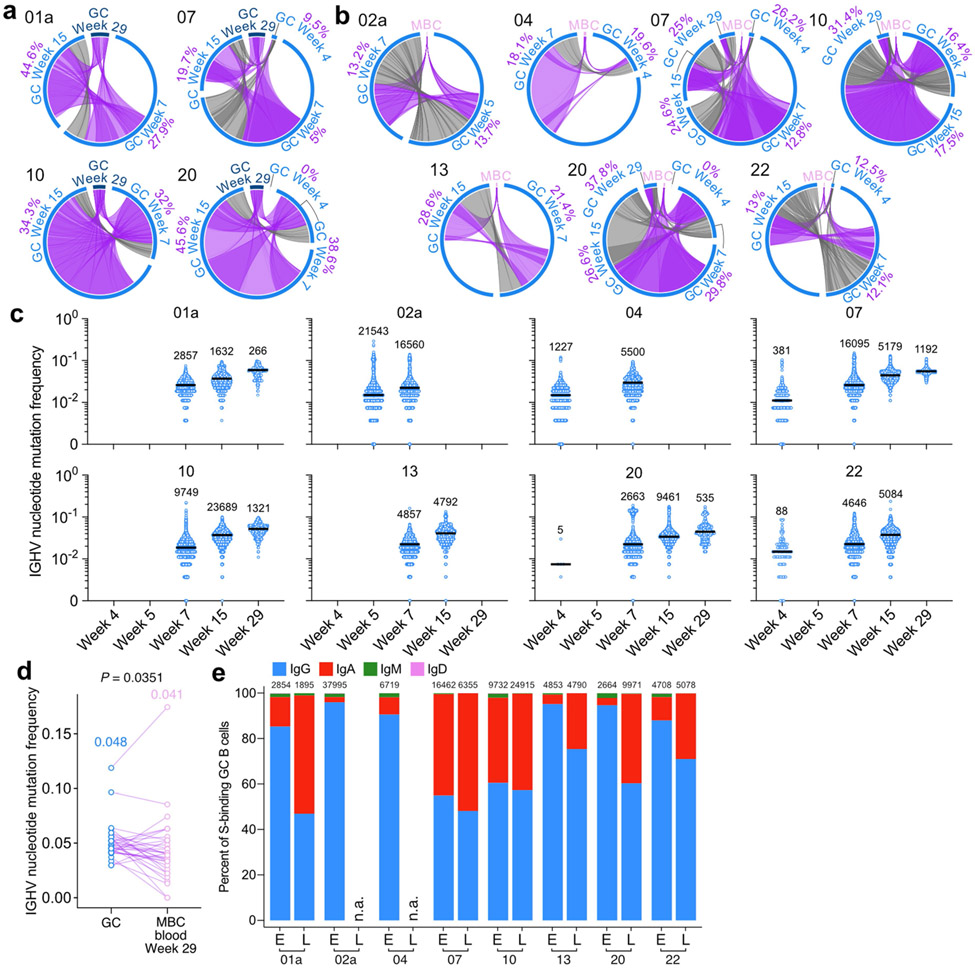
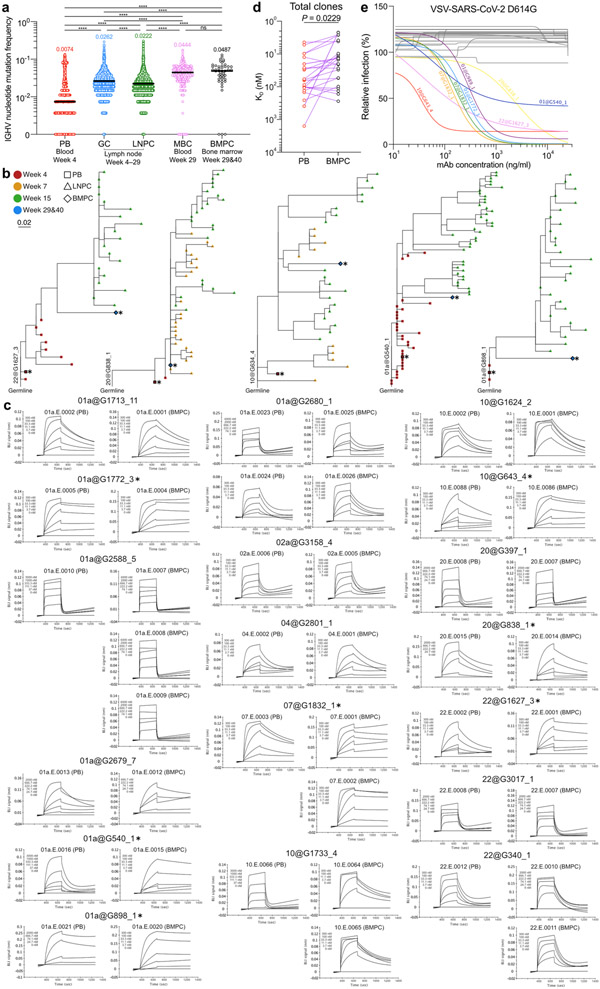
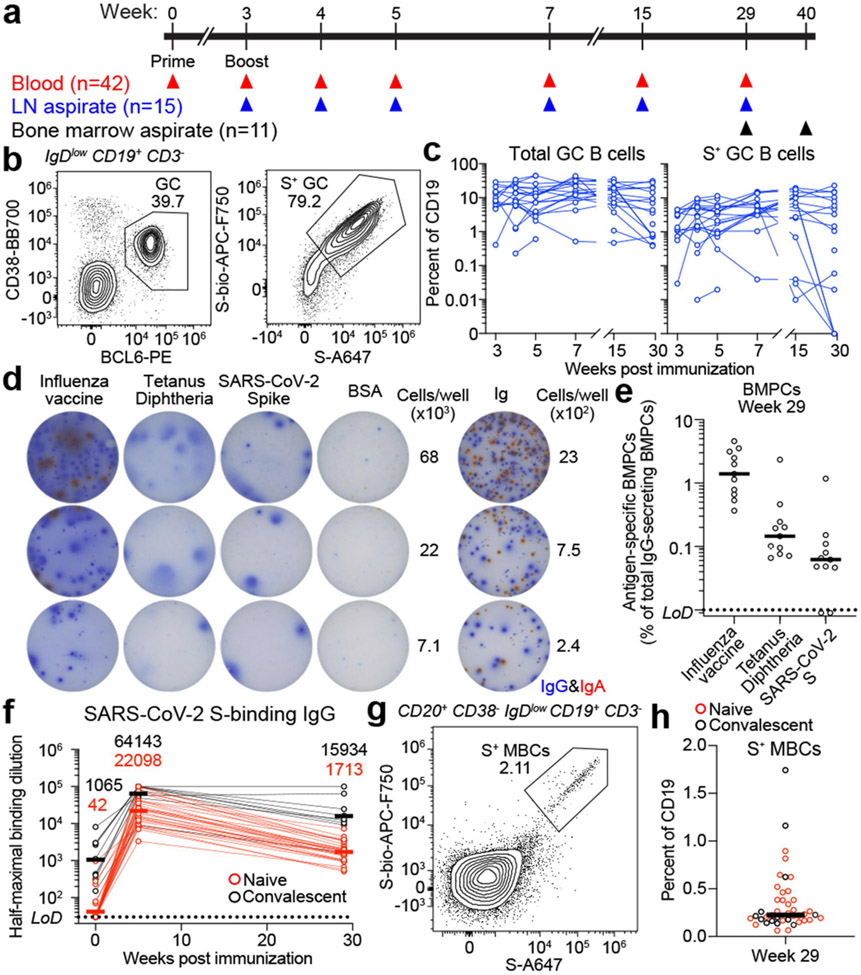
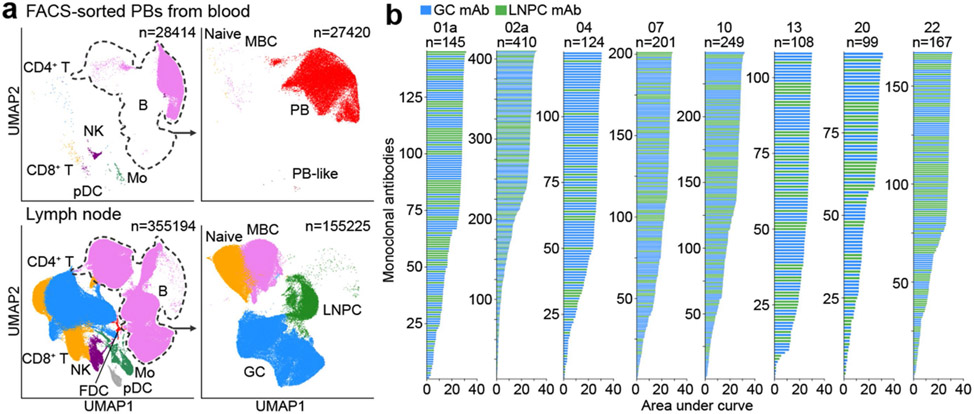
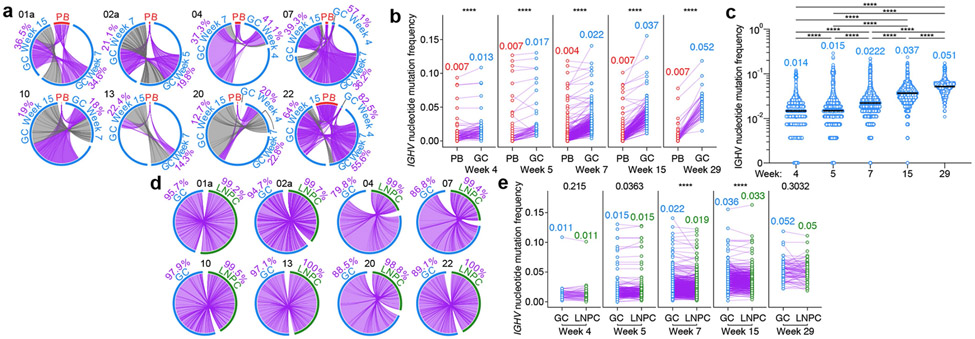
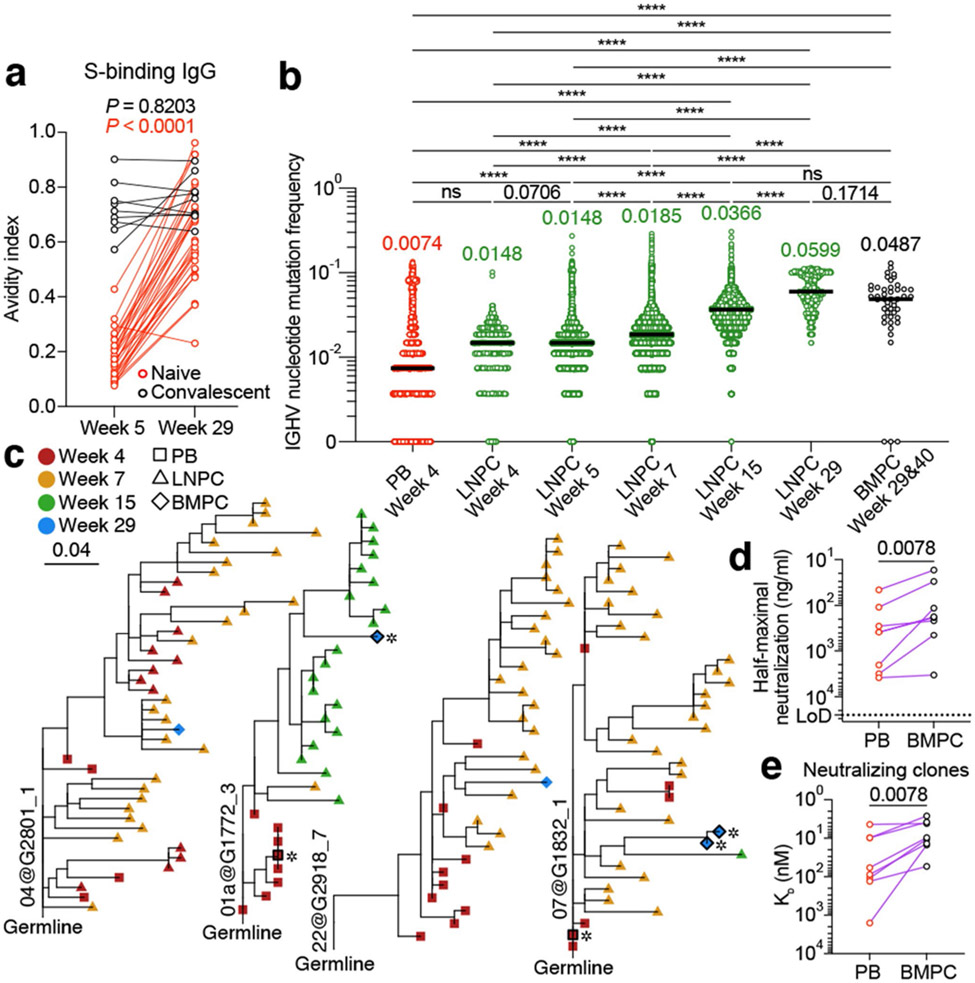
Germinal centres (GC) are lymphoid structures in which B cells acquire affinity-enhancing somatic hypermutations (SHM), with surviving clones differentiating into memory B cells (MBCs) and long-lived bone marrow plasma cells1-5 (BMPCs). SARS-CoV-2 mRNA vaccination induces a persistent GC response that lasts for at least six months in humans6-8. The fate of responding GC B cells as well as the functional consequences of such persistence remain unknown. Here, we detected SARS-CoV-2 spike protein-specific MBCs in 42 individuals who had received two doses of the SARS-CoV-2 mRNA vaccine BNT162b2 six month earlier. Spike-specific IgG-secreting BMPCs were detected in 9 out of 11 participants. Using a combined approach of sequencing the B cell receptors of responding blood plasmablasts and MBCs, lymph node GC B cells and plasma cells and BMPCs from eight individuals and expression of the corresponding monoclonal antibodies, we tracked the evolution of 1,540 spike-specific B cell clones. On average, early blood spike-specific plasmablasts exhibited the lowest SHM frequencies. By contrast, SHM frequencies of spike-specific GC B cells increased by 3.5-fold within six months after vaccination. Spike-specific MBCs and BMPCs accumulated high levels of SHM, which corresponded with enhanced anti-spike antibody avidity in blood and enhanced affinity as well as neutralization capacity of BMPC-derived monoclonal antibodies. We report how the notable persistence of the GC reaction induced by SARS-CoV-2 mRNA vaccination in humans culminates in affinity-matured long-term antibody responses that potently neutralize the virus.


Figures

Extended data Fig. 1 ∣
Extended data Fig. 1 ∣. Persistence of humoral immune responses to SARS-CoV-2 mRNA vaccination.
a, Flow cytometry gating strategies for GC B cells (Fig. 1b) and LNPCs (defined as CD19+ CD3 IgDlow CD20low CD38+ BLIMP1+ CD71+ live singlet lymphocytes) in the lymph node. b, Kinetics of total (left) and S-specific LNPCs (right) as gated in a. c, Frequencies of BMPCs secreting IgA antibodies specific for the indicated antigens 29 weeks after immunization. Symbols represent one sample in b (n=15) and c (n=11). d, e, Plasma antibody titers against SARS-CoV-2 S measured by ELISA in participants without (red, n=29) and with (black, n=9) a history of SARS-CoV-2 infection in SARS-CoV-2 vaccinated (left, center) and unvaccinated (right, n=48) participants 29 weeks after the first vaccine dose or symptom onset (d) and in vaccinated participants (red, n=29; black, n=9) over time (e). P values were determined by Kruskal-Wallis test followed by Dunn’s multiple comparison test between unvaccinated and both vaccinated groups (d), and by two-sided Mann-Whitney test (e). Horizontal lines indicate median values and dotted lines indicate detection limit in c and e. f, Flow cytometry gating strategies for MBCs (CD19+ cd3 IgDlow CD20+ CD38 live singlet lymphocytes) and S-binding MBCs (Fig. 1g) in blood.
Extended data Fig. 2 ∣
Extended data Fig. 2 ∣. Identification of SARS-CoV-2 S-binding B cell clones in the lymph node.
a, Flow cytometry gating strategies for sorting PBs (defined as CD19+ CD3 IgDlow CD20low CD38+ CD71+ live singlet lymphocytes) from blood. b, d UMAPs showing scRNA-seq transcriptional clusters of total cells (b) and of B cells (d) from PBs sorted from blood and FNA of draining axillary lymph nodes combined. c,e. Dot plots for the marker genes used for identifying annotated clusters. f, Heatmap of paired IGHV and IGHJ gene usage in S-binding clones. Color indicates the number of participants in which clones using a combination of IGHV and IGHJ genes were found. g, Flow cytometry gating strategies for sorting GC B cells (CD19+ CD4 IgDlow CD20+CD38int CXCR5high CD71+ live singlet lymphocytes) and LNPCs (CD19+ CD4 IgDlow CD20low CD38+ CXCR5low CD71+ live singlet lymphocytes) from FNAs. h, SARS-CoV-2 S-binding clones visualized in red on UMAP of B cell clusters. Percentages are of S-binding clones within GC B cells (blue), LNPCs (green), PBs (red), MBCs (pink) or naive B cells (yellow). Total numbers of cells are at the bottom right corner.
Extended data Fig. 3 ∣
Extended data Fig. 3 ∣. Maturation of SARS-CoV-2 S-binding B cells in the lymph node.
a, Circos diagrams showing clonal overlap between S-binding GC B cells at indicated time points. Purple and grey chords correspond to, respectively, clones spanning both 29 weeks post-vaccination and other time points, and clones spanning one or more of 4, 7 and 15 weeks post-vaccination. Percentages are of GC B cell clones related to GC B cells detected at 29 weeks post-vaccination. b, Circos diagrams showing clonal overlap between S-binding MBCs in blood 29 weeks post-vaccination and GC B cells at indicated time points. Purple and grey chords correspond to, respectively, clones spanning both the MBC and GC B cell compartments, and clones spanning only the GC B cell compartment. Percentages are of GC B cell clones overlapping with MBCs in blood 29 weeks post-vaccination. Arc length corresponds to the number of BCR sequences and chord with corresponds to clone size in a and b. c, Comparison of IGHV nucleotide mutation frequency of SARS-CoV-2 S-binding GC B cells in each participant at the indicated time points. Horizontal lines represent median values. Cell numbers are presented on the top of each data set. d, Comparison of IGHV region nucleotide mutation frequencies between clonally related, SARS-CoV-2 S-binding GC B cells and MBCs (n=33) detected at 29 weeks post-vaccination. Each dot represents the median SHM frequency of a clone within the indicated compartment. Median values are presented on the top of each data set. P value was determined by a paired two-sided non-parametric Mann-Whitney test. e, Percentages of GC B cells expressing BCRs of isotype IgG (blue), IgA (red), IgM (green) or IgD (pink) at the early (E) or the late (L) time point. The early and late time points respectively, 4, 5 or 7 weeks, and 15 or 29 weeks after immunization. Cell numbers are at the top.
Extended data Fig. 4 ∣
Extended data Fig. 4 ∣. Evolution of B cell clones induced by SARS-CoV-2 vaccination.
a, a, Comparison of IGHV nucleotide mutation frequency of PBs (n=2735), GC B cells (n=139322), LNPCs (n=823s0), MBCs (n=341) and BMPCs (n=47). Horizontal lines represent median values. P values were determined by Kruskal-Wallis test followed by Dunn’s multiple comparison test. b, Phylogenetic trees of neutralizing clones showing inferred evolutionary relationships between PBs (squares), LNPCs (triangles) and BMPCs (diamonds). Horizontal branch length represents the expected number of substitutions per codon in V-region genes, corresponding to the scale bar. Clone IDs are displayed near the root of the trees. Asterisks denote neutralizing mAbs. c, Kinetic curves of BLI signal for clonally related, PB- and BMPC-derived Fabs interacting with immobilized SARS-CoV-2 s. Clone IDs, Fab IDs and cell types are presented on the top of each data set. Asterisks denote neutralizing clones. d, Equilibrium dissociation constant (KD) of fabs (n=24) interacting with immobilized SARS-CoV-2 S measured by biolayer interferometry (BLI). Red and black dots indicate KD values of clonally related, PB- and BMPC-derived fabs, respectively. P value was determined by Wilcoxon matched-pair signed rank test. e, Neutralization curves of VSV-SARS-CoV-2 D614G with BMPC-derived mAbs. Colored and grey lines represent neutralizing and non-neutralizing clones, respectively. Neutralizing clone IDs are indicated on each curve. ns > 0.9999, ****p 0.0001.
Fig. 1 ∣
Fig. 1 ∣. Persistence of humoral immune responses to SARS-CoV-2 mRNA vaccination.
a. Forty-three participants (13 with SARS-CoV-2 infection history) were enrolled, followed by vaccination. Blood (n=42) was collected before and at indicated time points after vaccination. For 15 participants without infection history, aspirates of draining axillary lymph nodes were collected at indicated time points after vaccination. For 11 participants without infection history, aspirates of bone marrow were collected at 29 and 40 weeks post-vaccination. b, Representative flow cytometry plots of GC B cells (CD19+ CD3 IgDlow BCL6+ CD38int) and S-binding GC B cells in lymph nodes 29 weeks post-vaccination.0 c, Kinetics of total (left) and S-binding GC B cells (right) as gated in b. d, Representative ELISpot wells coated with the indicated antigens, bovine serum albumin or anti-immunoglobulin and developed in blue (IgG) and red (IgA) after plating the indicated numbers of BMPCs. e, Frequencies of IgG-secreting BMPCs specific for the indicated antigens 29 weeks post-vaccination. Symbols at each time point represent one sample in c (n=15) and e (n=11). f, Plasma anti-S IgG titers measured by ELISA in participants without (red, n=29) and with (black, n=9) infection history. Horizontal lines and numbers indicate geometric means. Results are from one experiment performed in duplicate. Dotted lines indicate detection limit in e and f. g, Representative flow cytometry plot of S-binding MBCs (CD20+ CD38 IgDlow CD19+CD3) in blood 29 weeks post-vaccination, h, Frequencies of S-specific MBCs in participants without (red, n=29) and with (black, n=13) infection history as gated in g. Horizontal lines indicate medians in e and h.
Fig. 2 ∣
Fig. 2 ∣. Identification of SARS-CoV-2 S-binding B cell clones in draining axillary lymph nodes.
a, Uniform manifold approximation and projection (UMAP) showing scRNA-seq transcriptional clusters of total cells (left) and of B cells (right) from PBs sorted from PBMC (upper) and from FNA of lymph nodes (lower). Each dot represents a cell, colored by phenotype as defined by transcriptomic profile. Total numbers of cells are at the top right corner. FDC, follicular dendritic cell; GC, GC B cell; Mo, monocyte; NK, natural killer cell; LNPC, lymph node plasma cell; PB, plasmablast; pDC, plasmacytoid dendritic cell; MBC, memory B cell. b, Positive binding of recombinant monoclonal antibodies (mAbs) derived from GC B cells (blue) or LNPCs (green) to SARS-CoV-2 S measured by ELISA. Results are from one experiment performed in duplicate.
Fig. 3 ∣
Fig. 3 ∣. Maturation of SARS-CoV-2 S-binding B cells in the lymph node.
a, Circos diagrams showing clonal overlap between S-binding PBs and GC B cells at indicated time points. Purple and gray chords correspond to, respectively, clones spanning both compartments, and clones spanning only the GC compartment. Percentages are of GC B cell clones related to PBs at each time point. b, Immunoglobulin heavy chain variable (IGHV) region nucleotide mutation frequency of clonally related PBs and GC B cells at Week 4 (n=81), 5 (n=52), 7 (n=289), 15 (n=162) and 29 (n=47). c, IGHV nucleotide mutation frequency of S-binding GC B cells at Week 4 (n=1701), 5 (n=21543), 7 (n=62927), 15 (n=49837) and 29 (n=3314). Horizontal lines and numbers represent medians. P values were determined by Kruskal-Wallis test followed by Dunn’s multiple comparison test. d, Circos diagrams showing clonal overlap (purple) between S-binding GC B cells and LNPCs over combined time points. Percentages are of GC B cell clones overlapping with LNPCs or vice versa. Arc length corresponds to the number of BCR sequences and chord width corresponds to clone size in a and d. e, IGHV nucleotide mutation frequency of clonally related GC B cells and LNPCs at Week 4 (n=48), 5 (n=224), 7 (n=877), 15 (n=449) and 29 (n=76). Each dot represents the median SHM frequency of a clone within the indicated compartment, and medians are presented on the top of each data set in b and e. P values were determined by paired two-sided Mann-Whitney test and corrected for multiple testing using Benjamini and Hochberg’s method in b and e.****p < 0.0001.
Fig. 4 ∣
Fig. 4 ∣. Evolution of B cell clones induced by SARS-CoV-2 vaccination.
a, Avidity indices of plasma anti-S IgG between the indicated time points in participants without (red, n=29) and with (black, n=9) infection history. Results are from one experiment performed in duplicate. b, IGHV nucleotide mutation frequency of S-binding PBs (n=2735), LNPCs at Week 4 (n=552), 5 (n=11253), 7 (n=45436), 15 (n=24538) and 29 (n=571), and BMPCs (n=47). Horizontal lines and numbers represent median values. P values were determined by Kruskal-Wallis test followed by Dunn’s multiple comparison test, c, Representative phylogenetic trees showing inferred evolutionary relationships between PBs (squares), LNPCs (triangles) and BMPCs (diamonds). Horizontal branch length represents the expected number of substitutions per codon in V-region genes, corresponding to the scale bar. Clone IDs are displayed near the root of the trees. Asterisks denote neutralizing mAbs. d, Neutralizing activity of clonally related PB- and BMPC-derived mAbs (n=8) against SARS-CoV-2 D614G strain. Dotted line indicates detection limit. Results are from one experiment with duplicates in a and d. e, Equilibrium dissociation constant (KD) of neutralizing clone-derived Fabs (n=8) interacting with immobilized S protein measured by BLI. Symbols indicate KD values of clonally related, PB (red)- and BMPC (black)-derived Fabs, respectively. P values were determined by two-tailed Wilcoxon matched-pairs signed rank test in a, d and e. ns > 0.9999, ****p < 0.0001.

Update of

Comment in

References

    1. Victora GD & Nussenzweig MC Germinal Centers. Annual Review of Immunology 30, 429–457, 10.1146/annurev-immunol-020711-075032 (2012). - DOI - PubMed
    1. Cyster JG & Allen CDC B Cell Responses: Cell Interaction Dynamics and Decisions. Cell 177, 524–540, 10.1016/j.cell.2019.03.016 (2019). - DOI - PMC - PubMed
    1. Radbruch A et al. Competence and competition: the challenge of becoming a long-lived plasma cell. Nature Reviews Immunology 6, 741–750, 10.1038/nri1886 (2006). - DOI - PubMed
    1. Slifka MK, Antia R, Whitmire JK & Ahmed R Humoral Immunity Due to Long-Lived Plasma Cells. Immunity 8, 363–372, 10.1016/s1074-7613(00)80541-5 (1998). - DOI - PubMed
    1. Tarlinton D, Radbruch A, Hiepe F & Dörner T Plasma cell differentiation and survival. Current Opinion in Immunology 20, 162–169, 10.1016/j.coi.2008.03.016 (2008). - DOI - PubMed