. 2022 Mar 30;42(13):2678-2689.
doi: 10.1523/JNEUROSCI.1164-21.2022. Epub 2022 Feb 15.

AMIGO1 Promotes Axon Growth and Territory Matching in the Retina

Affiliations

AMIGO1 Promotes Axon Growth and Territory Matching in the Retina

Florentina Soto et al. J Neurosci. .

Abstract

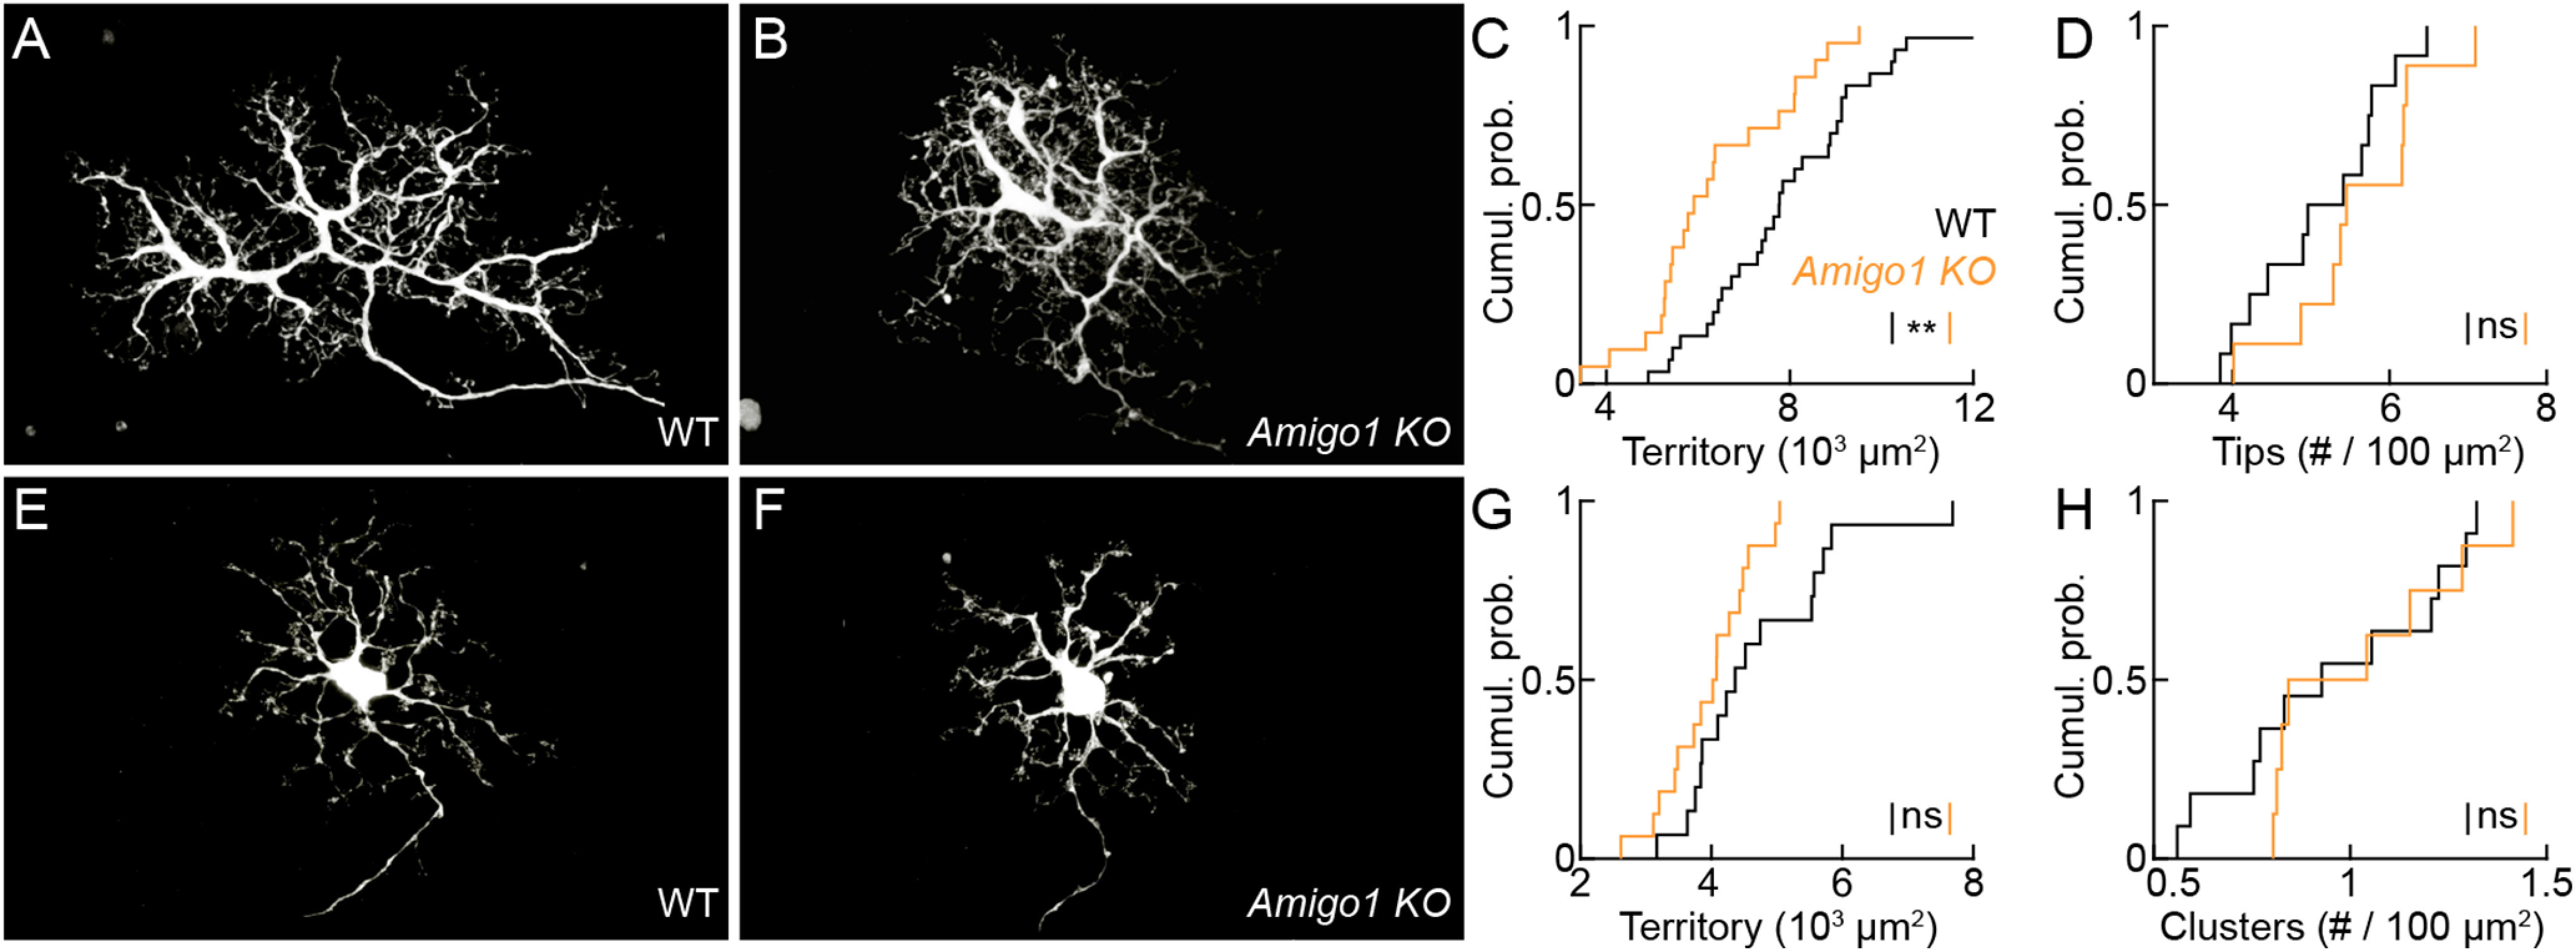
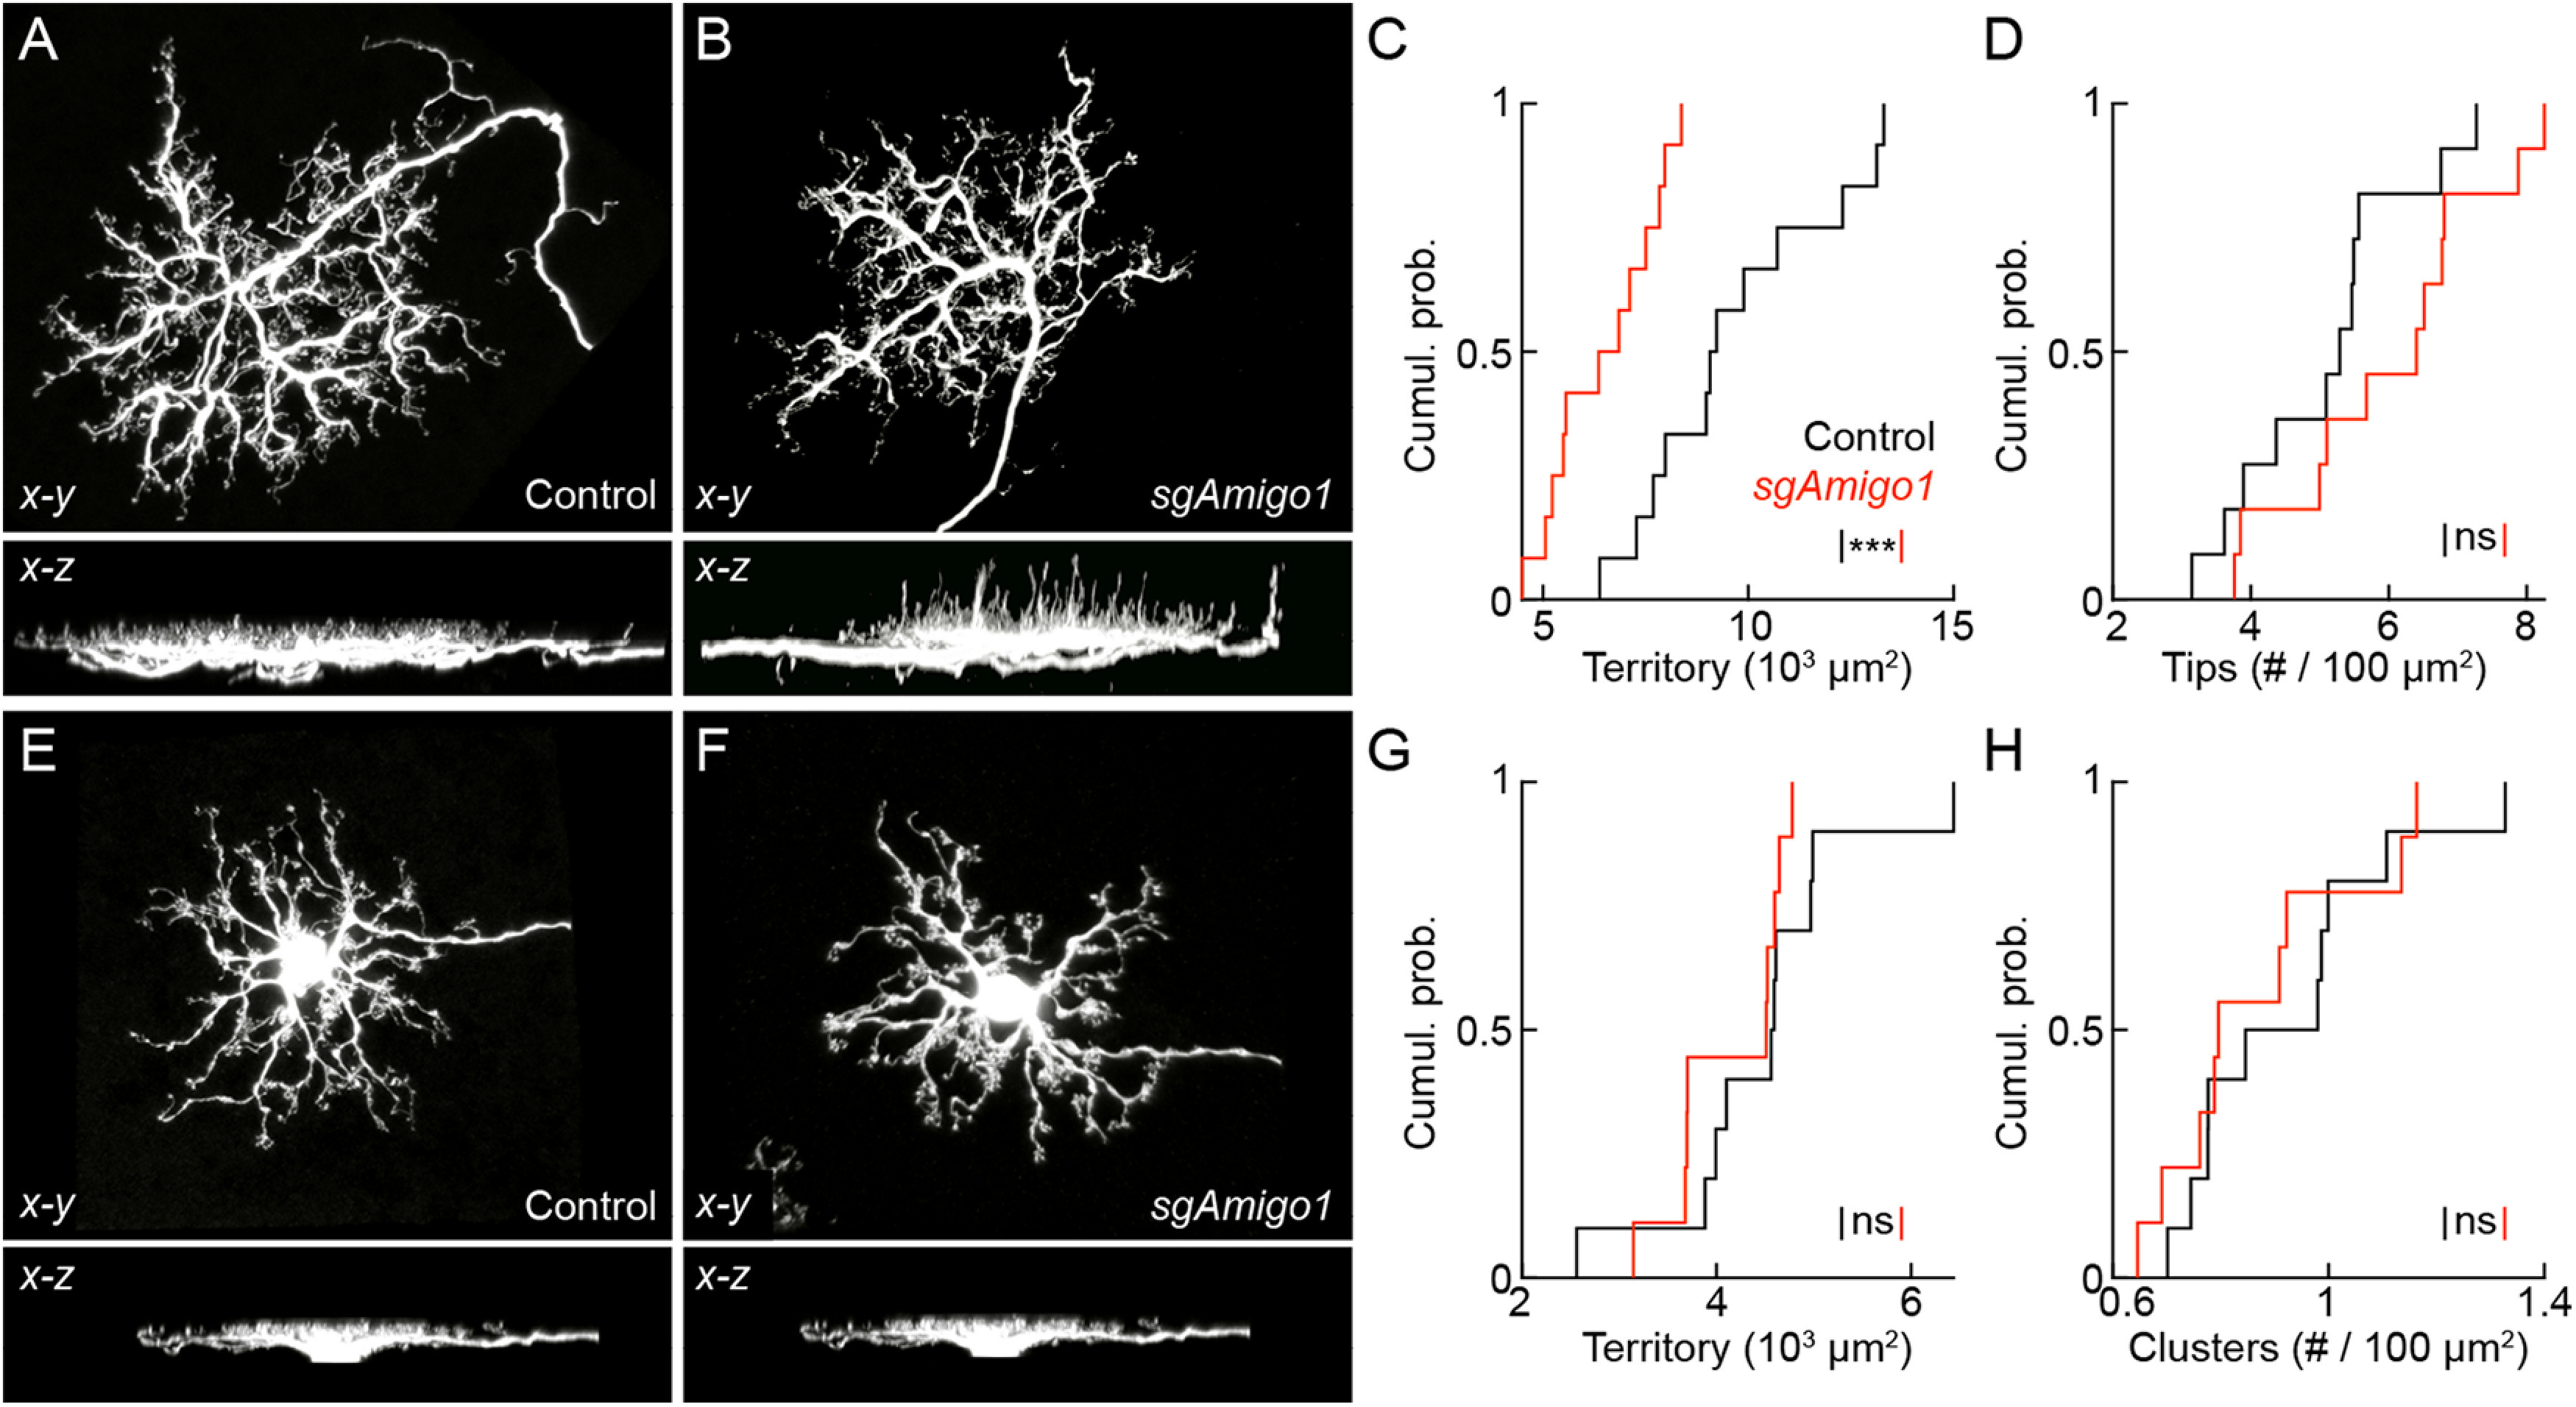
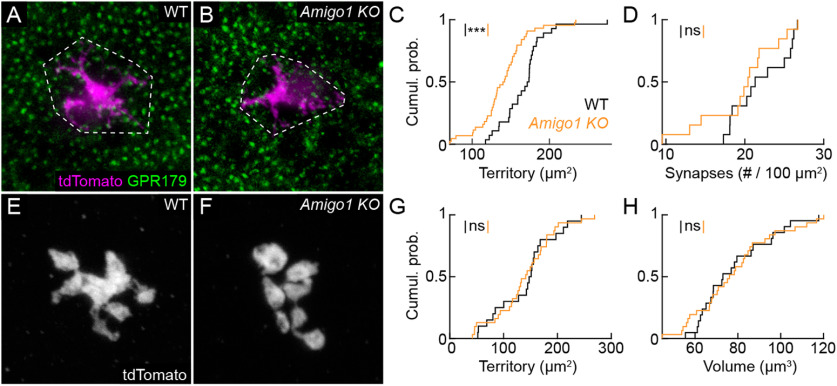
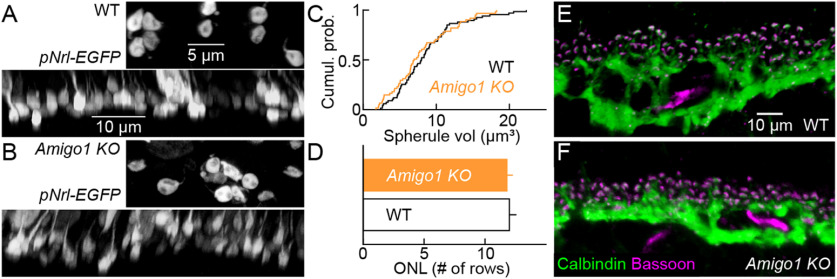
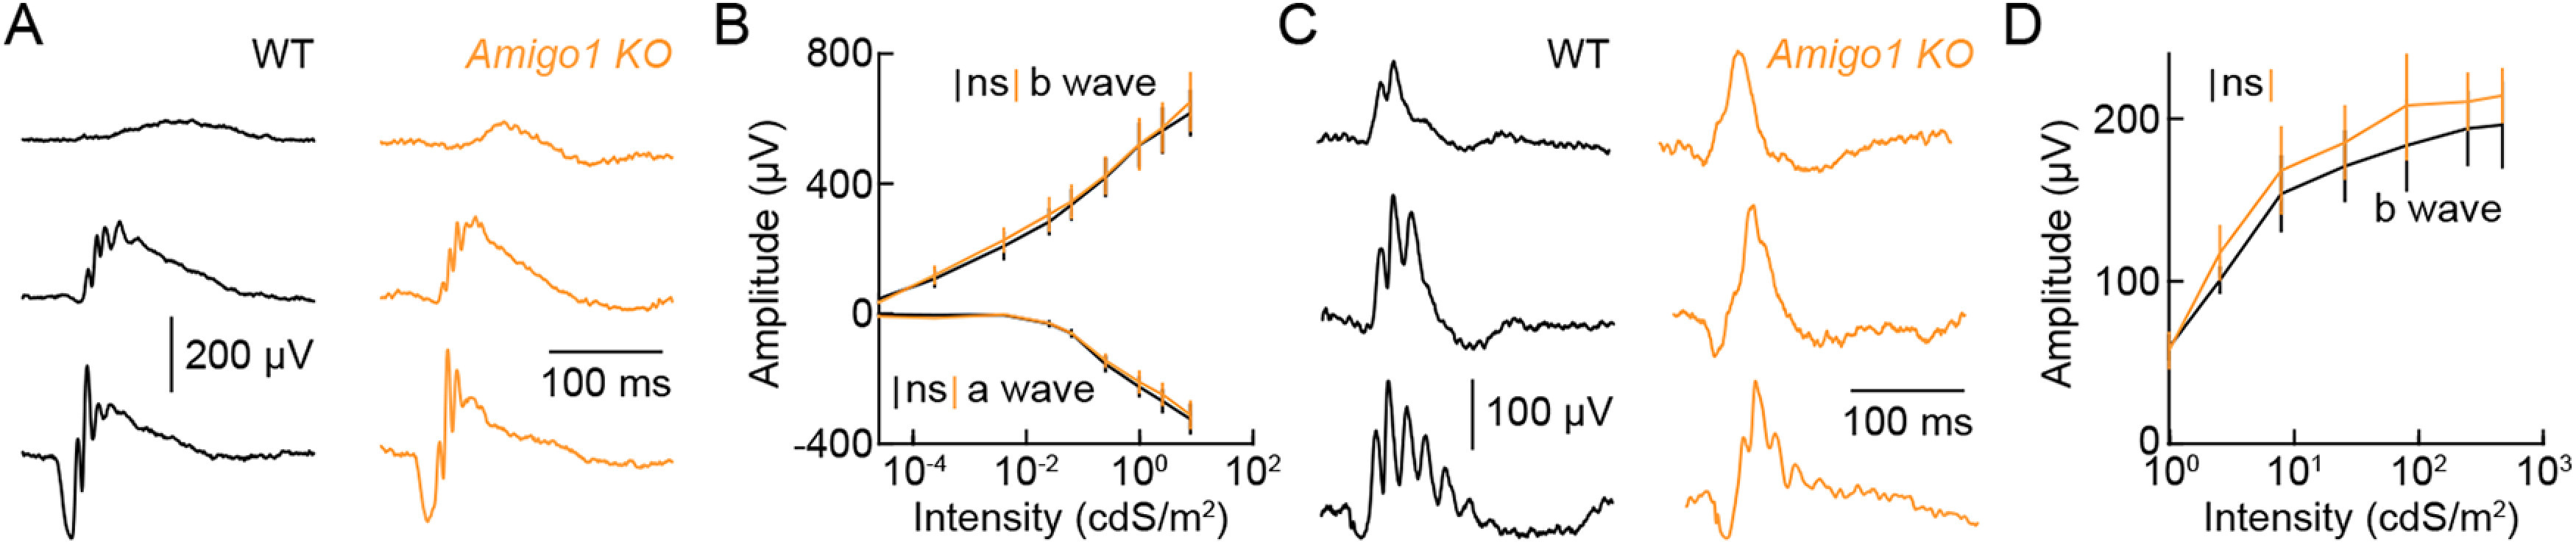
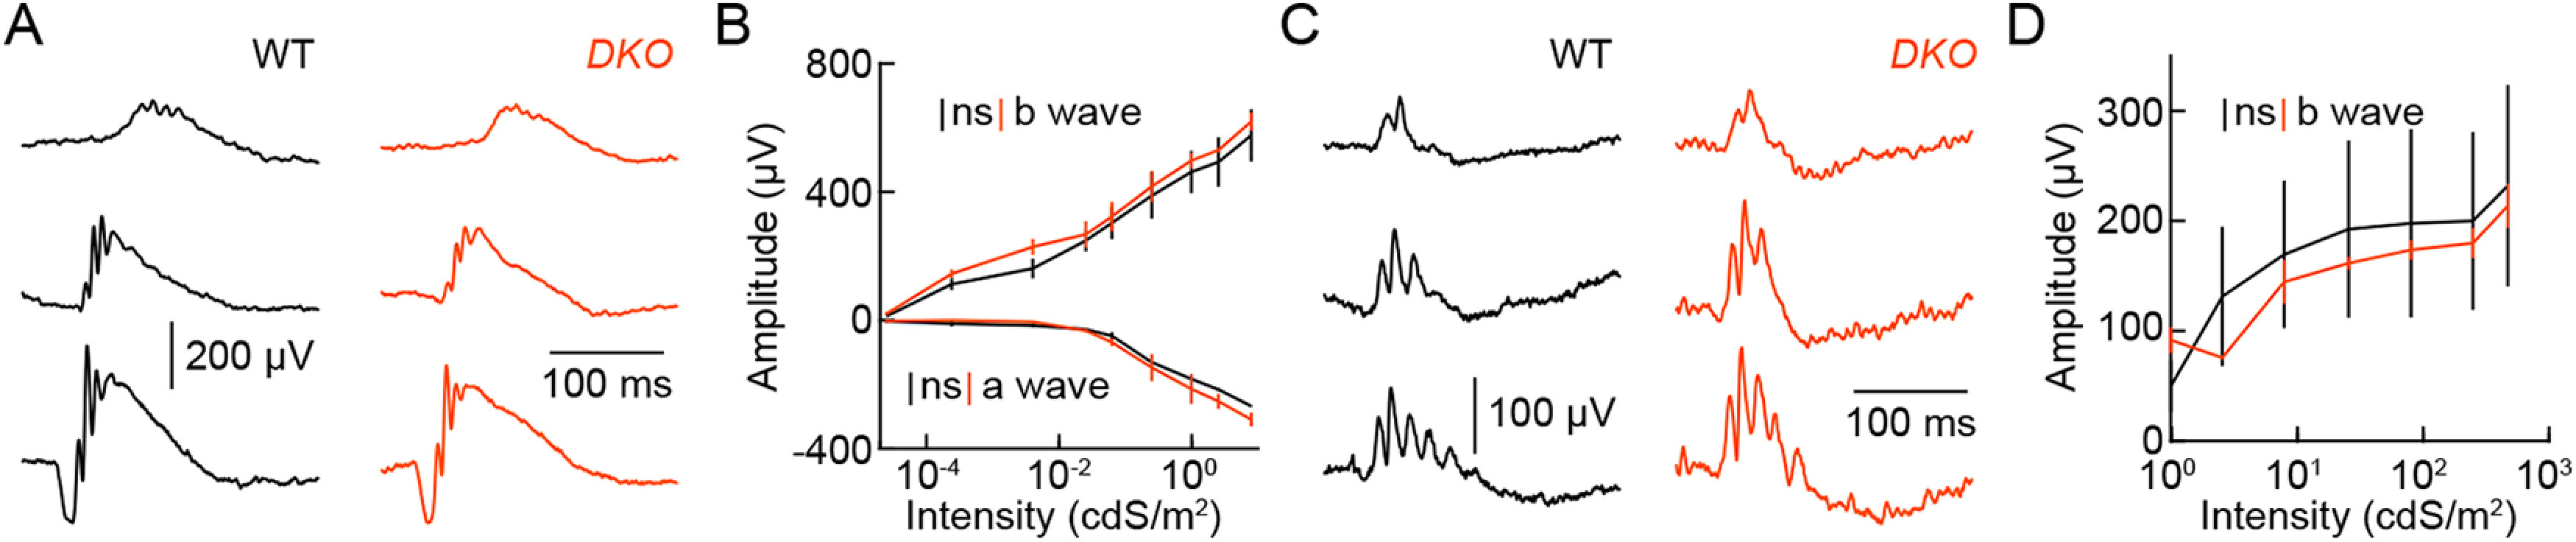
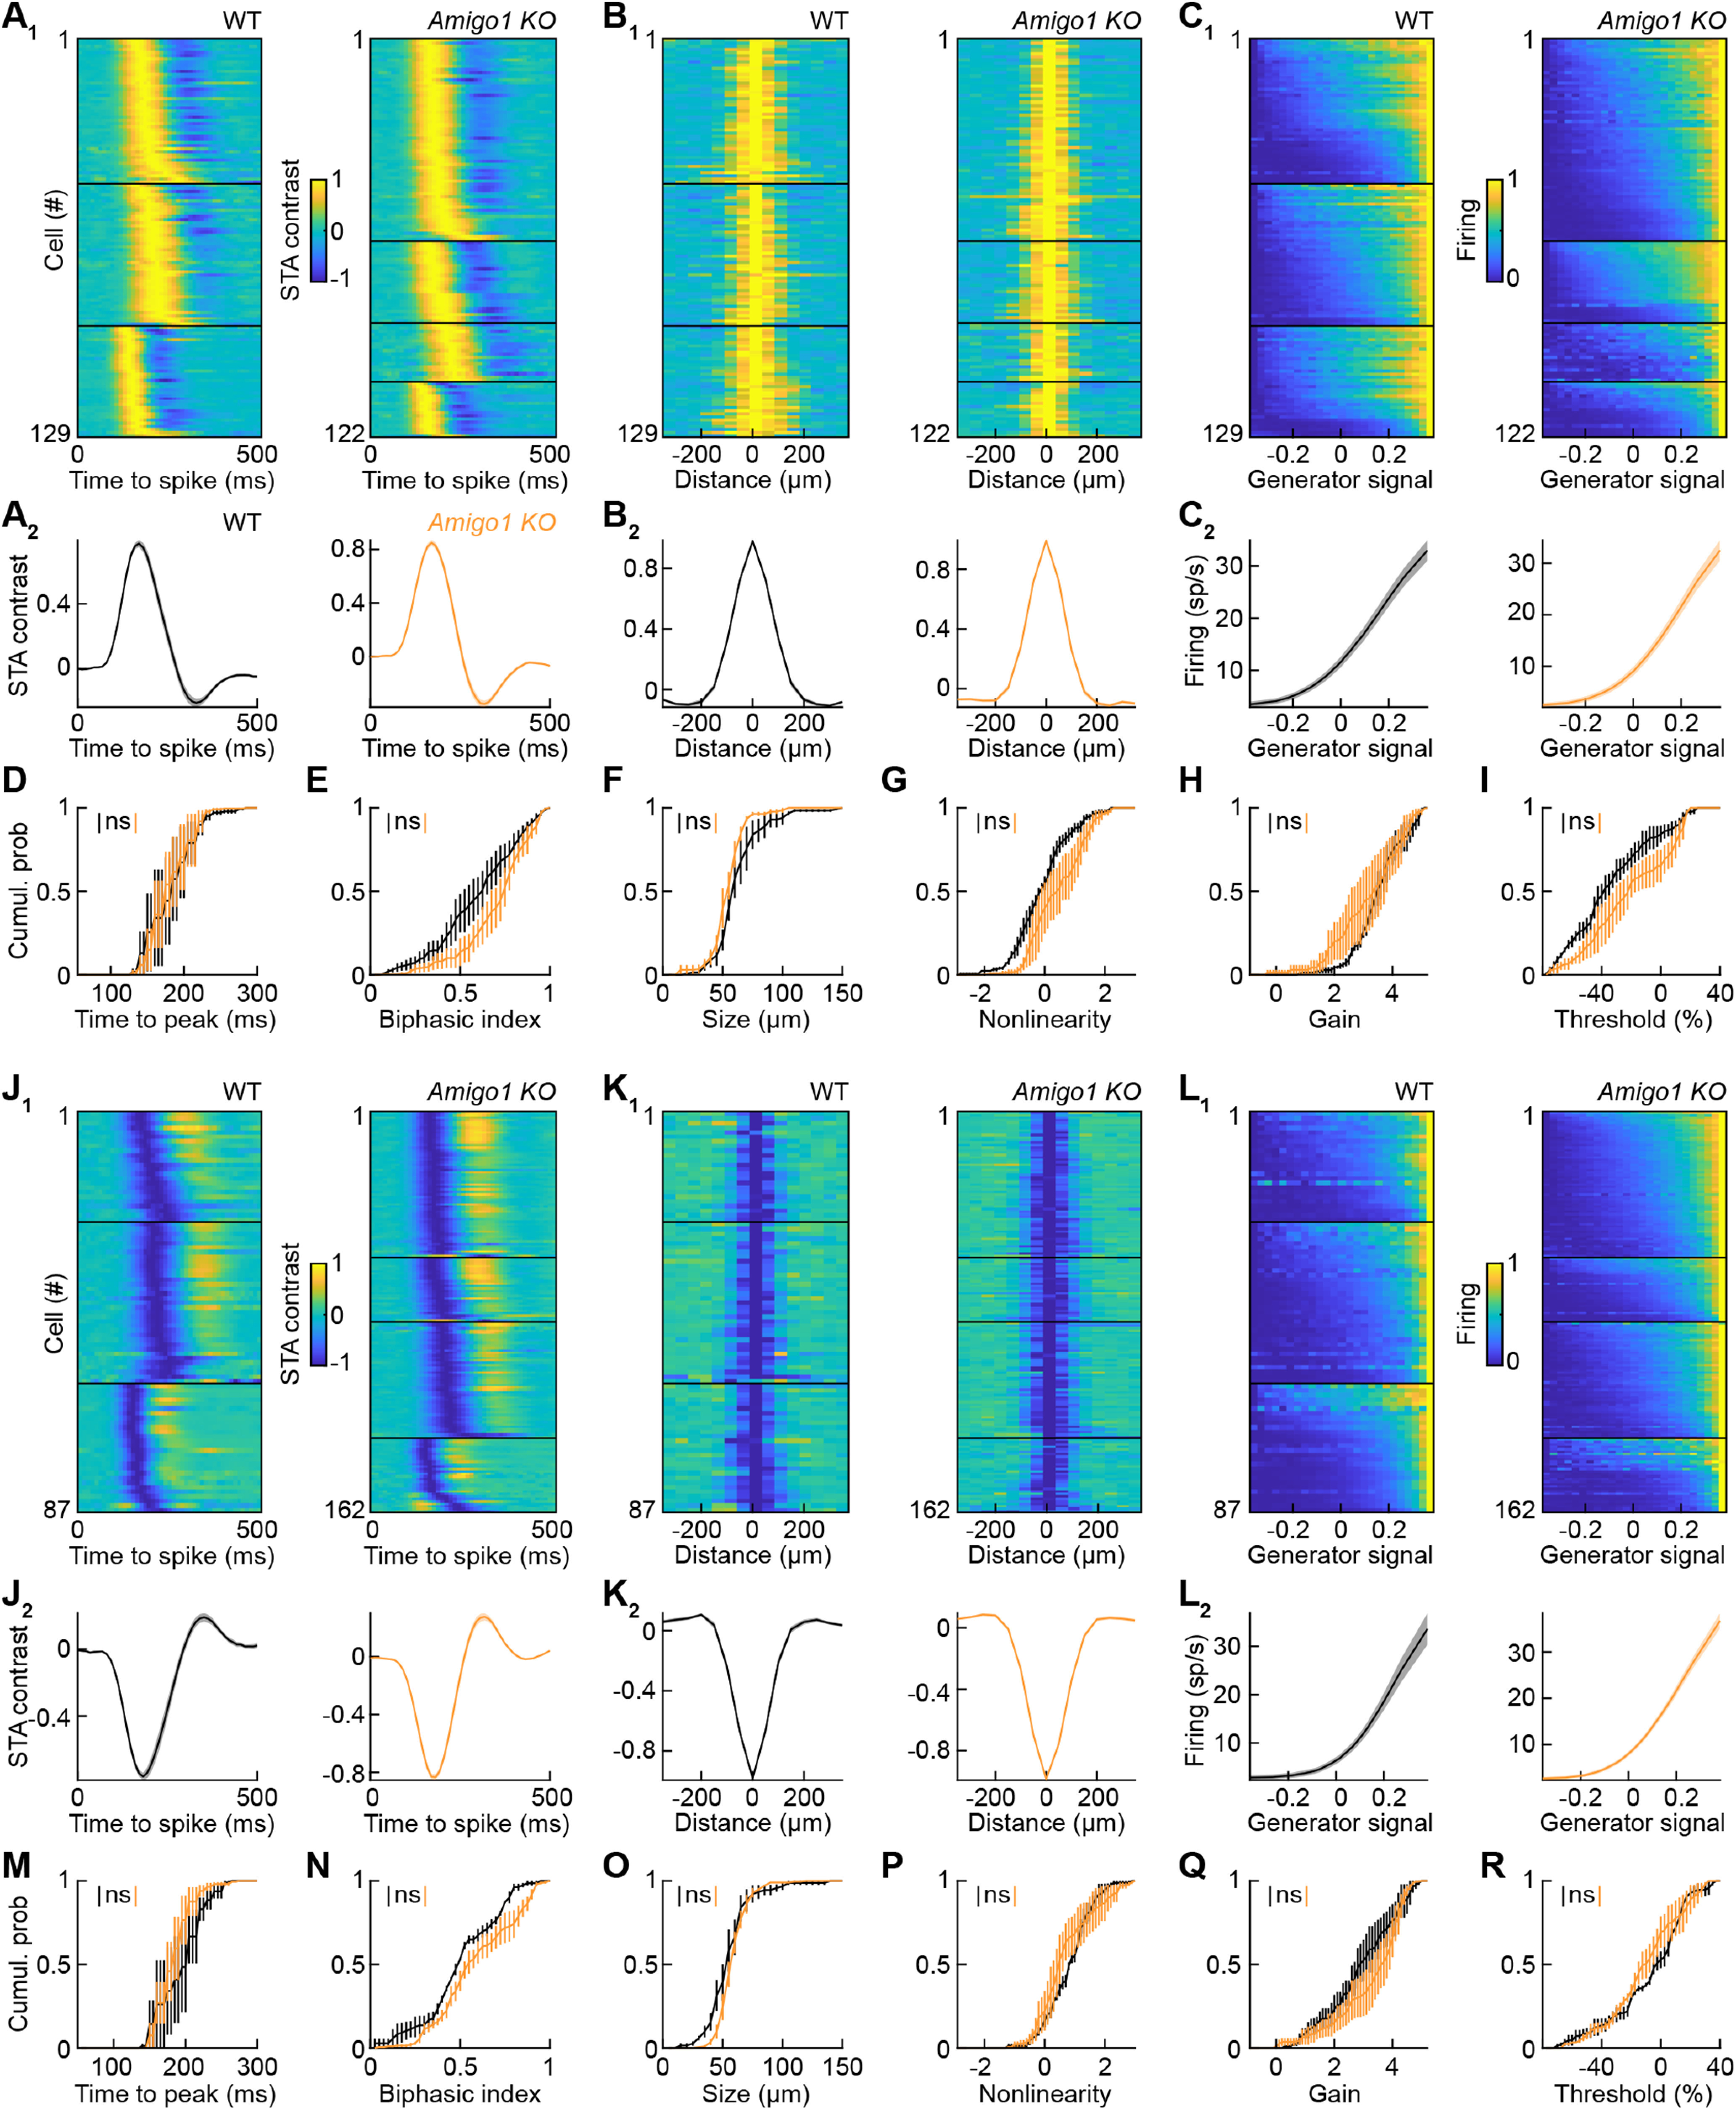
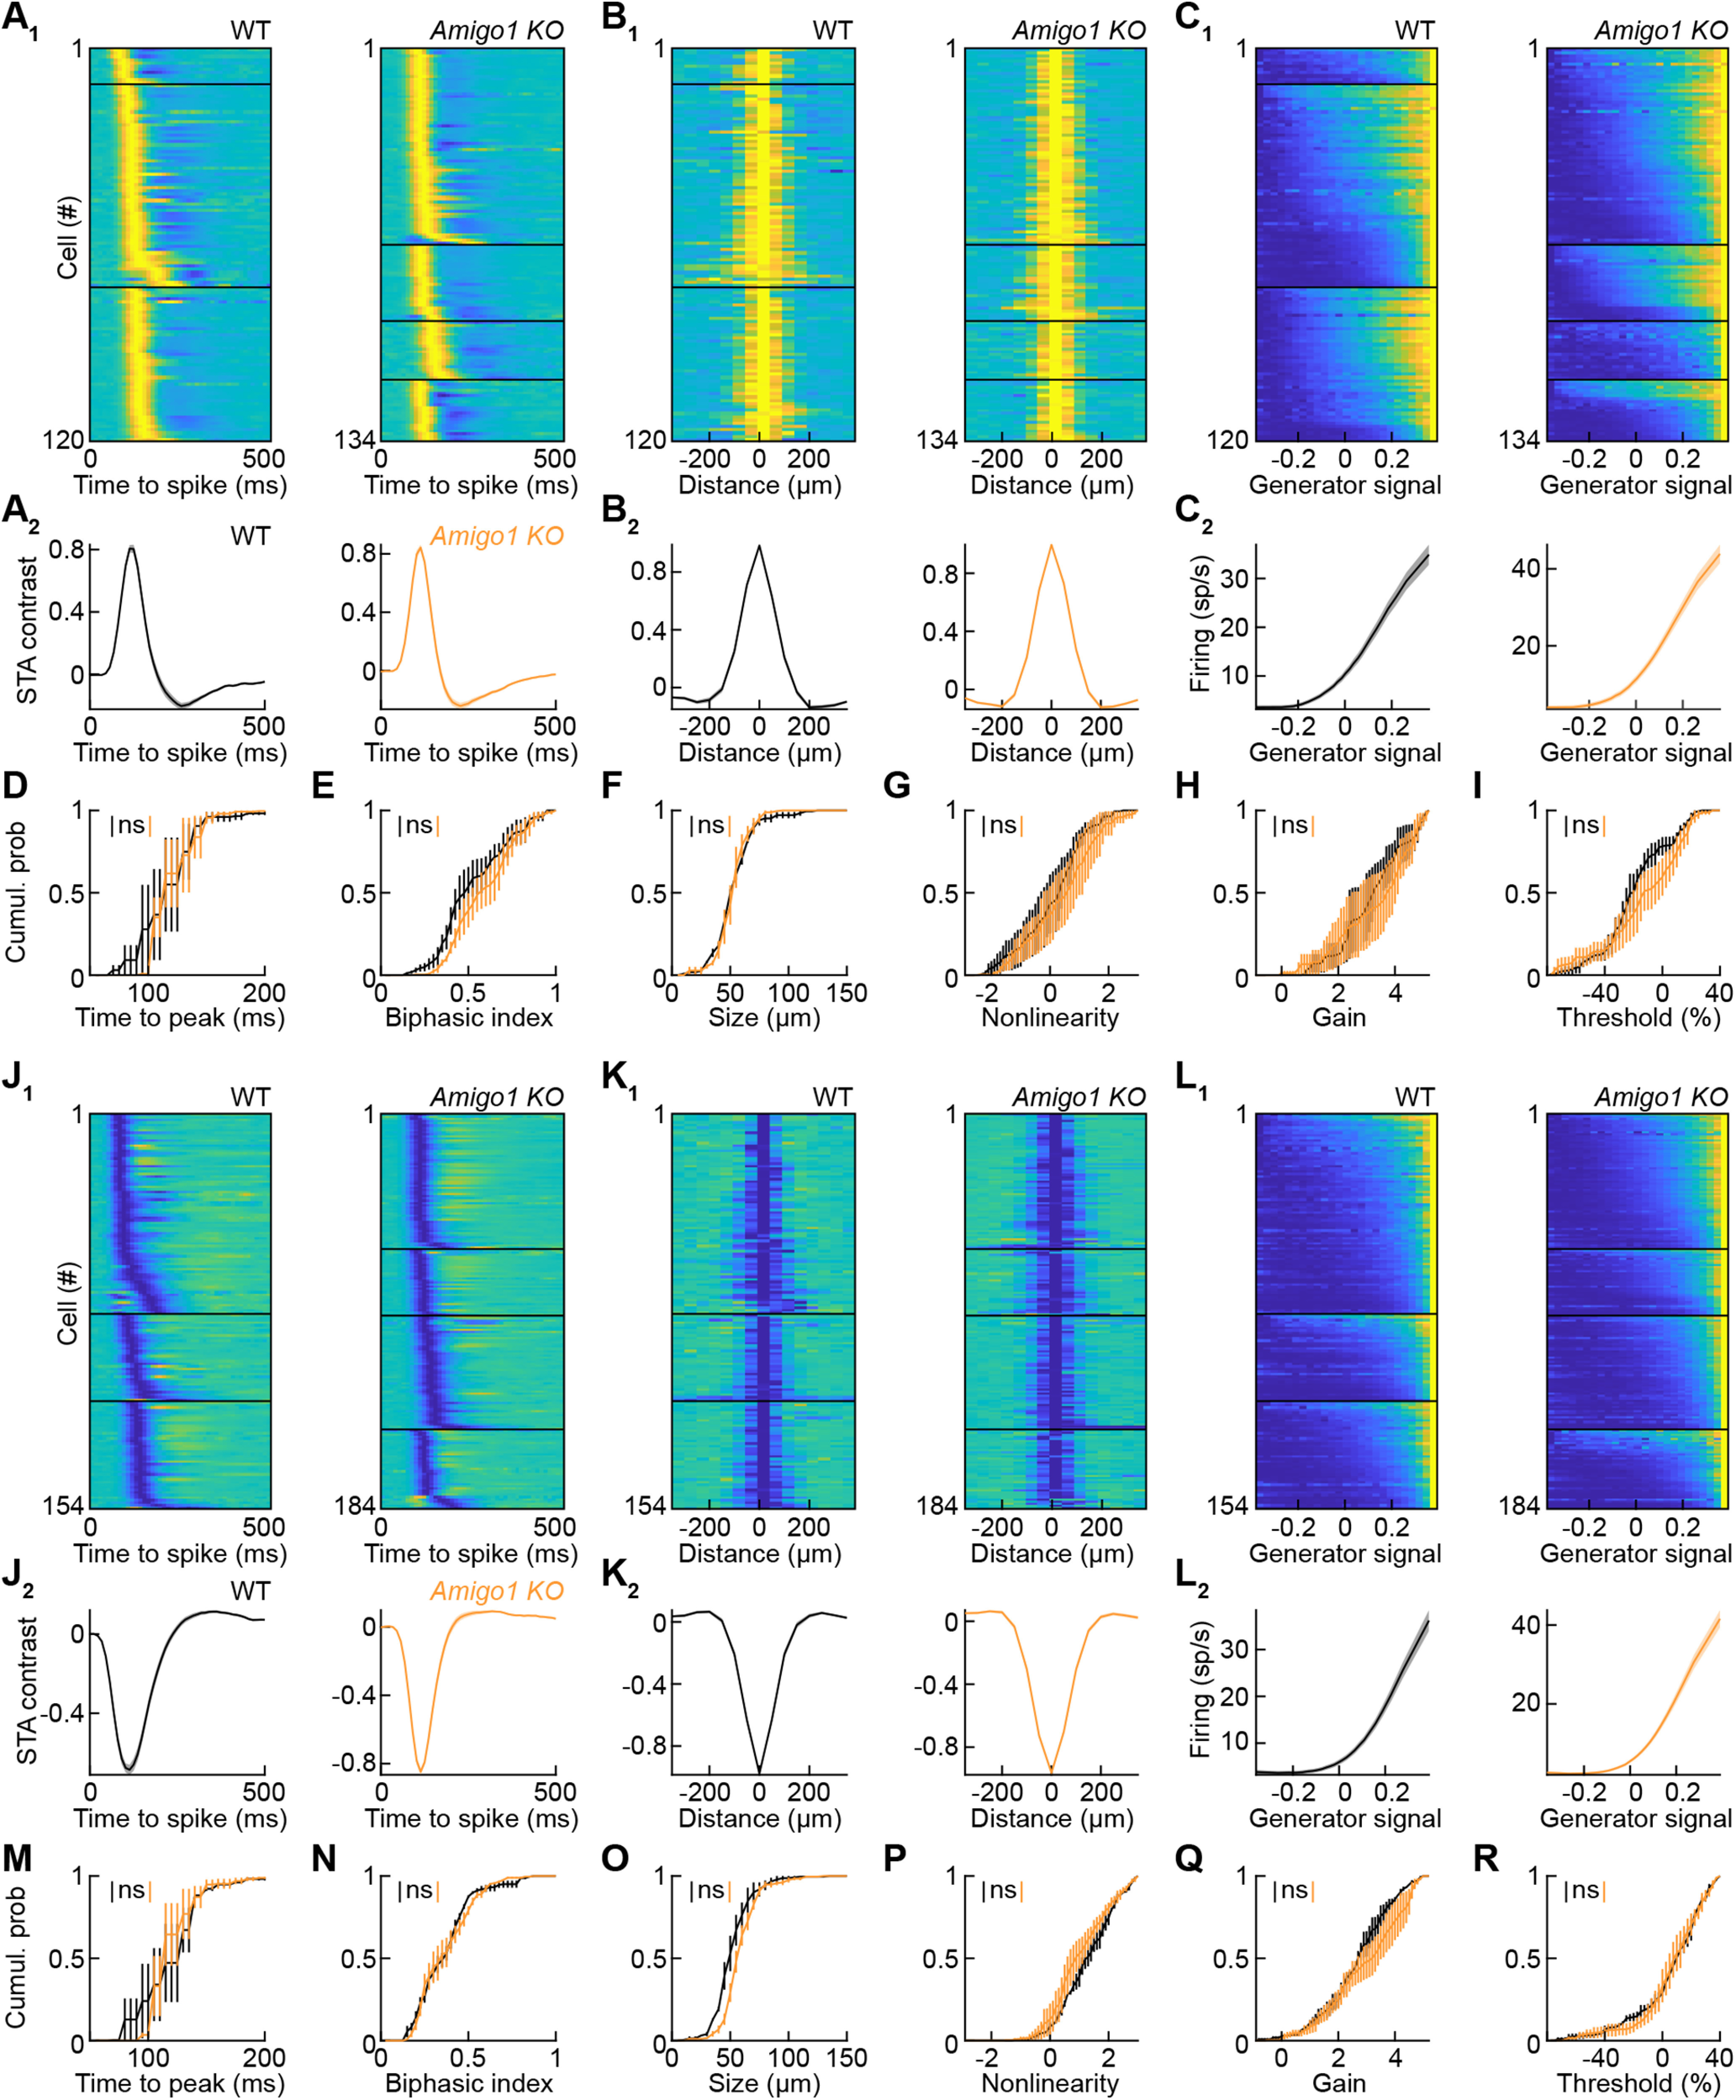
Dendrite and axon arbor sizes are critical to neuronal function and vary widely between different neuron types. The relative dendrite and axon sizes of synaptic partners control signal convergence and divergence in neural circuits. The developmental mechanisms that determine cell-type-specific dendrite and axon size and match synaptic partners' arbor territories remain obscure. Here, we discover that retinal horizontal cells express the leucine-rich repeat domain cell adhesion molecule AMIGO1. Horizontal cells provide pathway-specific feedback to photoreceptors-horizontal cell axons to rods and horizontal cell dendrites to cones. AMIGO1 selectively expands the size of horizontal cell axons. When Amigo1 is deleted in all or individual horizontal cells of either sex, their axon arbors shrink. By contrast, horizontal cell dendrites and synapse formation of horizontal cell axons and dendrites are unaffected by AMIGO1 removal. The dendrites of rod bipolar cells, which do not express AMIGO1, shrink in parallel with horizontal cell axons in Amigo1 knockout (Amigo1 KO) mice. This territory matching maintains the function of the rod bipolar pathway, preserving bipolar cell responses and retinal output signals in Amigo1 KO mice. We previously identified AMIGO2 as a scaling factor that constrains retinal neurite arbors. Our current results identify AMIGO1 as a scaling factor that expands retinal neurite arbors and reveal territory matching as a novel homeostatic mechanism. Territory matching interacts with other homeostatic mechanisms to stabilize the development of the rod bipolar pathway, which mediates vision near the threshold.SIGNIFICANCE STATEMENT Neurons send and receive signals through branched axonal and dendritic arbors. The size of these arbors is critical to the function of a neuron. Axons and dendrites grow during development and are stable at maturity. The mechanisms that determine axon and dendrite size are not well understood. Here, we identify a cell surface protein, AMIGO1, that selectively promotes axon growth of horizontal cells, a retinal interneuron. Removal of AMIGO1 reduces the size of horizontal cell axons without affecting the size of their dendrites or the ability of both arbors to form connections. The changes in horizontal cell axons are matched by changes in synaptic partner dendrites to stabilize retinal function. This identifies territory matching as a novel homeostatic plasticity mechanism.

Keywords: LRR protein; arbor size; circuit development; horizontal cell; rod bipolar pathway.


Figures

Figure 1.
Figure 1.
Horizontal cells express Amigo1. A, In situ hybridization detects Amigo1 mRNA in a band of evenly space neurons at the outer margin of the inner nuclear layer (INL). Additional expression is observed deeper in the INL and in the ganglion cell layer (GCL). B, C, Immunohistochemistry for β-galactosidase (β-gal) expressed from the Amigo1 locus in retinal flat mounts, costained for calbindin (B) and PKCα (C), which label horizontal and rod bipolar cells, respectively. The elongated labeling in the β-gal channel (B) represents blood vessels stained by the secondary anti-mouse-IgG antibody. Insets (B, C) show magnified views. Scale bars: 20 µm.
Figure 2.
Figure 2.
Horizontal cell mosaics are unchanged in Amigo1 KO retinas. A, B, Representative images of horizontal cell distributions in retina flat mounts from wild-type (A) and Amigo1 KO (B) littermates stained for calbindin. C, Density recovery profiles of horizontal cells in wild-type and Amigo1 KO mice (p = 0.53, bootstrapping).
Figure 3.
Figure 3.
AMIGO1 promotes horizontal cell axon growth. A, B, Representative axon arbors of horizontal cells labeled by AAV-CAG-YFP in wild-type (A) and Amigo1 KO (B) retinas. C, D, Cumulative probability distributions of axon territories (C, wild type, n = 30; Amigo1 KO, n = 21; p = 0.0026, Mann–Whitney U test) and axon tip densities (D, wild type, n = 12; Amigo1 KO, n = 9; p = 0.27, Mann–Whitney U test). E, F, Representative dendrite arbors of horizontal cells labeled by AAV-CAG-YFP in wild-type (E) and Amigo1 KO (F) retinas. G, H, Cumulative probability distributions of dendrite territories (G, wild type, n = 15; Amigo1 KO, n = 16; p = 0.086, Mann–Whitney U test) and dendrite clusters densities (i.e., contacts with cones, H; wild type, n = 11; Amigo1 KO, n = 8; p = 0.66, Mann–Whitney U test). ns indicates p ≥ 0.05 and ** indicates p < 0.01.
Figure 4.
Figure 4.
Targeting errors of horizontal cell axons but not other neurites in Amigo1 KO retinas. A–F, Representative images of retinal vibratome slices from P10 (A, B), P15 (C, D), and P30 (E, F) Amigo1 wild-type Gad1-GFP (A, C, E) and Amigo1 KO Gad1-GFP mice (B, D, F). G, H, Representative images of vibratome slices of P30 wild-type (G) and Amigo1 KO (H) retinas stained for neurofilament show that the mistargeted horizontal cell neurites in the outer nuclear layer are axons. I, J, Representative images of retinal vibratome slices from P22 wild-type (I) and Amigo1 KO (J) mice, stained for the rod bipolar cell marker PKCα. Rod bipolar cell dendrites do not make the same targeting errors as horizontal cell axons. K, L, Representative images of retinal vibratome slices from wild-type (K) and Amigo1 KO (L) mice stained for choline acetyltransferase to label starburst amacrine cells.
Figure 5.
Figure 5.
AMIGO1 transmits signals for axon growth and laminar targeting. A, B, Orthogonal views of representative axon arbors of horizontal cells infected with AAV2/1-U6-sgAmigo1-CAG-tdTomato in Cx57-iCre R26-LSL-Cas9 mice (B) and Cre-negative control littermates (A). C, D, Cumulative probability distributions of axon territories (C, Control, n = 12; sgAmigo1, n = 12; p = 9 × 10⁻⁴, Mann–Whitney U test) and axon tip densities in the outer plexiform layer (D, Control, n = 12; sgAmigo1, n = 12; p = 0.17, Mann–Whitney U test). E, F, Orthogonal views of dendrite arbors of horizontal cells infected with AAV2/1-U6-sgAmigo1-CAG-tdTomato in Cx57-iCre R26-LSL-Cas9 mice (F) and Cre-negative control littermates (E). G, H, Cumulative probability distributions of dendrite territories (G, Control, n = 10; sgAmigo1, n = 9; p = 0.32, Mann–Whitney U test) and dendrite clusters densities (i.e., contacts with cones; H, Control, n = 10; sgAmigo1, n = 9; p = 0.60, Mann–Whitney U test). ns indicates p ≥ 0.05 and *** indicates p < 0.001.
Figure 6.
Figure 6.
Territory matching of rod bipolar cell dendrites in Amigo1 KO mice. A, B, Representative images of rod bipolar cell dendrites (labeled by AAV-Grm6-tdTomato) and postsynaptic sites (stained for GPR179) in wild-type (A) and Amigo1 KO (B) retinas. Cumulative probability distributions of rod bipolar cell dendrite territories (C, wild type, n = 28; Amigo1 KO, n = 44; p = 2.1 × 10⁻⁴, Mann–Whitney U test) and synapse densities (D, wild type, n = 13; Amigo1 KO, n = 13; p = 0.36, Mann–Whitney U test). E, F, Representative images of rod bipolar cell axons (labeled by AAV-Grm6-tdTomato) in wild-type (E) and Amigo1 KO (F) retinas. G, H, Cumulative probability distributions of rod bipolar cell axon territories (G, wild type, n = 20; Amigo1 KO, n = 31; p = 0.82, Mann–Whitney U test) and volumes (H, wild type, n = 21; Amigo1 KO, n = 31; p = 0.96, Mann–Whitney U test). ns indicates p ≥ 0.05 and *** indicates p < 0.001.
Figure 7.
Figure 7.
Rods develop independently of AMIGO1. A, B, Representative top-down (top) and side views (bottom) of rod spherules labeled by in vivo electroporation of pNrl-EGFP in wild-type (A) and Amigo1 KO mice (B). Top, Magnified excerpts from the regions shown in the side views. C, Cumulative probability distributions of rod spherule volumes (wild type, n = 67; Amigo1 KO, n = 61; p = 0.37, Mann–Whitney U test). D, Error bars indicate the mean (± SEM) number of rows in the outer nuclear layer measure in DAPI-stained sections (wild type, n = 3 retinas; Amigo1 KO, n = 5 retinas; p = 0.93, Mann–Whitney U test). E, F, Representative images of retinal vibratome slices from wild-type (E) and Amigo1 KO (F) mice showing the outer plexiform layer stained for calbindin, a horizontal cell marker, and Bassoon, a presynaptic ribbon-anchoring protein.
Figure 8.
Figure 8.
Electroretinographic responses are preserved in Amigo1 KO mice. A, Representative ERG responses of dark-adapted wild-type (left) and Amigo1 KO (right) mice to flashes of increasing intensity (top, 2.4 × 10⁻⁴ cdS/m2; middle, 0.025 cdS/m2; bottom, 0.98 cdS/m2). B, Population data (mean ± SEM) of dark-adapted a-wave amplitudes (wild type, n = 6 mice; Amigo1 KO, n = 5 mice; p = 0.83, bootstrapping) and b-wave amplitudes (p = 0.94, bootstrapping). C, Representative ERG responses of light-adapted wild-type (left) and Amigo1 KO (right) mice to flashes of increasing intensity (top, 2.5 cdS/m2; middle, 26 cdS/m2; bottom, 470 cdS/m2). D, Population data (mean ± SEM) of the light-adapted b-wave amplitudes (wild type, n = 5 mice; Amigo1 KO, n = 5 mice; p = 0.68, bootstrapping). ns indicates p ≥ 0.05.
Figure 9.
Figure 9.
Electroretinographic responses are preserved in Amigo1 Amigo2 double knockout mice. A, Representative ERG responses of dark-adapted wild-type (left) and Amigo1 Amigo2 DKO (right) mice to flashes of increasing intensity (top, 2.4 × 10⁻⁴ cdS/m2; middle, 0.025 cdS/m2; bottom, 0.98 cdS/m2). B, Population data (mean ± SEM) of dark-adapted a-wave amplitudes (wild type, n = 3 mice; DKO, n = 3 mice; p = 0.26, bootstrapping) and b-wave amplitudes (p = 0.56, bootstrapping). C, Representative ERG responses of light-adapted wild-type (left) and DKO (right) mice to flashes of increasing intensity (top, 2.5 cdS/m2; middle, 26 cdS/m2; bottom, 470 cdS/m2). D, Population data (mean ± SEM) of the light-adapted b-wave amplitudes (wild type, n = 3 mice; DKO, n = 3 mice; p = 0.55, bootstrapping). ns indicates p ≥ 0.05.
Figure 10.
Figure 10.
Homeostasis of dim-light visual processing in Amigo1 KO retinas. A, Temporal receptive fields of all ON ganglion cells recorded in wild-type (A1, left, n = 129 cells, n = 3 mice) and Amigo1 KO (A1, right, n = 122 cells, n = 4 mice) retinas, grouped by mice, sorted by time to peak, and their averages (A2, ± SEM). B, Spatial receptive fields of all ON ganglion cells recorded in wild-type (B1, left) and Amigo1 KO (B1, right) retinas, grouped by mice, sorted by size, and their averages (B2, ± SEM). C, Static nonlinearities (or effective-contrast-response functions) of all ON ganglion cells recorded in wild-type (C1, left) and Amigo1 KO (C1, right) retinas, grouped by mice, sorted by threshold, and their averages (C2, ± SEM). D–I, Cumulative probability distributions of the time to peak (D, wild type vs Amigo 1KO, p = 0.89, bootstrapping) and biphasic index (E, p = 0.14, bootstrapping) of temporal receptive fields, size of spatial receptive fields (F, p = 0.22, bootstrapping), and the nonlinearity (G, p = 0.14, bootstrapping), gain (H, p = 0.44, bootstrapping), and threshold (I, p = 0.15, bootstrapping) of the effective-contrast-response functions. J, Temporal receptive fields of all OFF ganglion cells recorded in wild-type (J1, left, n = 87 cells, n = 3 mice) and Amigo1 KO (J1, right, n = 162 cells, n = 4 mice) retinas, grouped by mice, sorted by time to peak, and their averages (J2, ± SEM). K, Spatial receptive fields of all OFF ganglion cells recorded in wild-type (K1, left) and Amigo1 KO (K1, right) retinas, grouped by mice, sorted by size, and their averages (K2, ± SEM). L, Static nonlinearities of all OFF ganglion cells recorded in wild-type (L1, left) and Amigo1 KO (L1, right) retinas, grouped by mice, sorted by threshold, and their averages (L2, ± SEM). M–R, Cumulative probability distributions of the time to peak (M, wild type vs Amigo 1KO, p = 0.57, bootstrapping) and biphasic index (N, p = 0.10, bootstrapping) of temporal receptive fields, size of spatial receptive fields (O, p = 0.25, bootstrapping), and the nonlinearity (P, p = 0.45, bootstrapping), gain (Q, p = 0.37, bootstrapping), and threshold (R, p = 0.37, bootstrapping) of the effective-contrast-response functions. ns indicates p ≥ 0.05.
Figure 11.
Figure 11.
Homeostasis of bright-light visual processing in Amigo1 KO retinas. A, Temporal receptive fields of all ON ganglion cells recorded in wild-type (A1, left, n = 120 cells, n = 3 mice) and Amigo1 KO (A1, right, n = 134 cells, n = 4 mice) retinas, grouped by mice, sorted by time to peak, and their averages (A2, ± SEM). B, Spatial receptive fields of all ON ganglion cells recorded in wild-type (B1, left) and Amigo1 KO (B1, right) retinas, grouped by mice, sorted by size, and their averages (B2, ± SEM). C, Static nonlinearities (or effective-contrast-response functions) of all ON ganglion cells recorded in wild-type (C1, left) and Amigo1 KO (C1, right) retinas, grouped by mice, sorted by threshold, and their averages (C2, ± SEM). D–I, Cumulative probability distributions of the time to peak (D, wild type vs Amigo 1KO, p = 0.76, bootstrapping) and biphasic index (E, p = 0.35, bootstrapping) of temporal receptive fields, size of spatial receptive fields (F, p = 0.66, bootstrapping), and the nonlinearity (G, p = 0.73, bootstrapping), gain (H, p = 0.68, bootstrapping), and threshold (I, p = 0.38, bootstrapping) of the effective-contrast-response functions. J, Temporal receptive fields of all OFF ganglion cells recorded in wild-type (J1, left, n = 154 cells, n = 3 mice) and Amigo1 KO (J1, right, n = 184 cells, n = 4 mice) retinas, grouped by mice, sorted by time to peak, and their averages (J2, ± SEM). K, Spatial receptive fields of all OFF ganglion cells recorded in wild-type (K1, left) and Amigo1 KO (K1, right) retinas, grouped by mice, sorted by size, and their averages (K2, ± SEM). L, Static nonlinearities of all OFF ganglion cells recorded in wild-type (L1, left) and Amigo1 KO (L1, right) retinas, grouped by mice, sorted by threshold, and their averages (L2, ± SEM). M–R, Cumulative probability distributions of the time to peak (M, wild type vs Amigo 1KO, p = 0.64, bootstrapping) and biphasic index (N, p = 0.56, bootstrapping) of temporal receptive fields, size of spatial receptive fields (O, p = 0.12, bootstrapping), and the nonlinearity (P, p = 0.33, bootstrapping), gain (Q, p = 0.31, bootstrapping), and threshold (R, p = 0.82, bootstrapping) of the effective-contrast-response functions. ns indicates p ≥ 0.05.

Similar articles

Cited by

References

    1. Brown KM, Gillette TA, Ascoli GA (2008) Quantifying neuronal size: summing up trees and splitting the branch difference. Semin Cell Dev Biol 19:485–493. 10.1016/j.semcdb.2008.08.005 - DOI - PMC - PubMed
    1. Care RA, Anastassov IA, Kastner DB, Kuo Y-M, Della Santina L, Dunn FA (2020) Mature retina compensates functionally for partial loss of rod photoreceptors. Cell Rep 31:107730. 10.1016/j.celrep.2020.107730 - DOI - PMC - PubMed
    1. Chapot CA, Behrens C, Rogerson LE, Baden T, Pop S, Berens P, Euler T, Schubert T (2017) Local signals in mouse horizontal cell dendrites. Curr Biol 27:3603–3615.e5. 10.1016/j.cub.2017.10.050 - DOI - PubMed
    1. Chattopadhyaya B, Di Cristo G, Higashiyama H, Knott GW, Kuhlman SJ, Welker E, Huang ZJ (2004) Experience and activity-dependent maturation of perisomatic GABAergic innervation in primary visual cortex during a postnatal critical period. J Neurosci 24:9598–9611. 10.1523/JNEUROSCI.1851-04.2004 - DOI - PMC - PubMed
    1. Chichilnisky EJ (2001) A simple white noise analysis of neuronal light responses. Network 12:199–213. - PubMed

Publication types

LinkOut - more resources