. 2022 Feb 15;5(5):e202101114.
doi: 10.26508/lsa.202101114. Print 2022 May.

Angioplasty induces epigenomic remodeling in injured arteries

Affiliations

Angioplasty induces epigenomic remodeling in injured arteries

Mengxue Zhang et al. Life Sci Alliance. .

Abstract

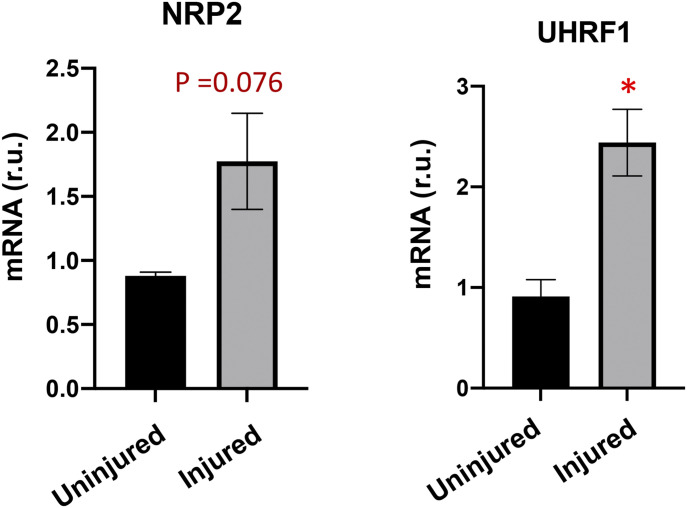
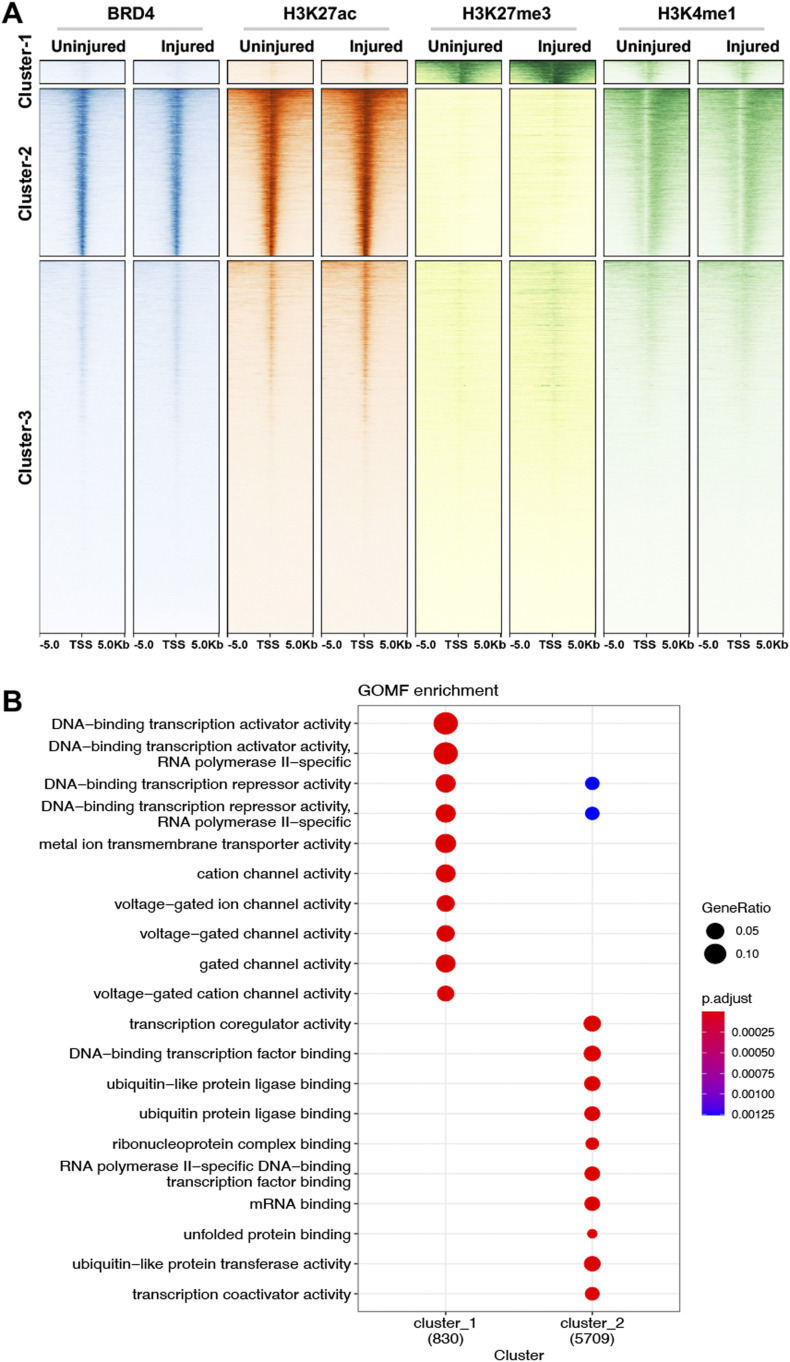
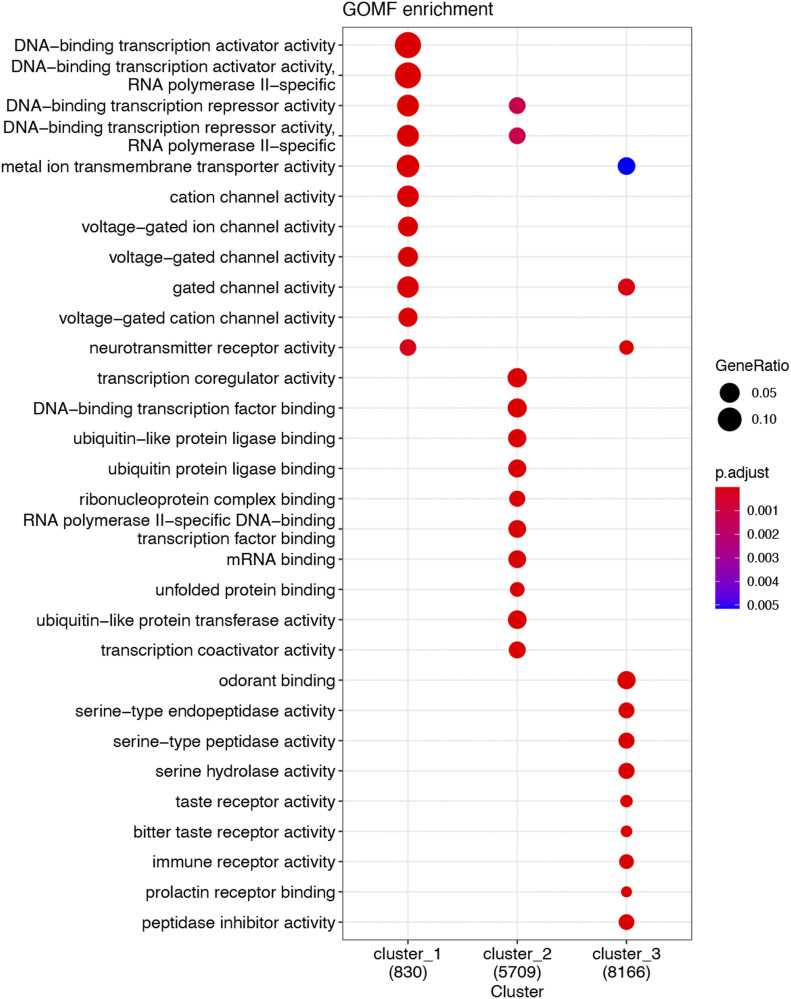
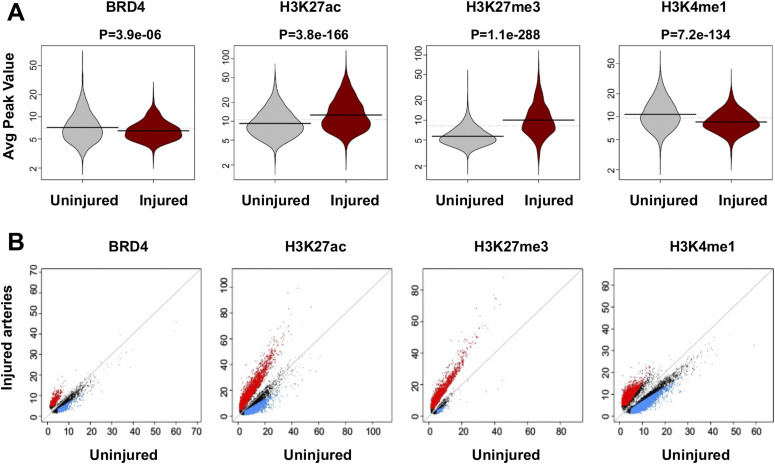
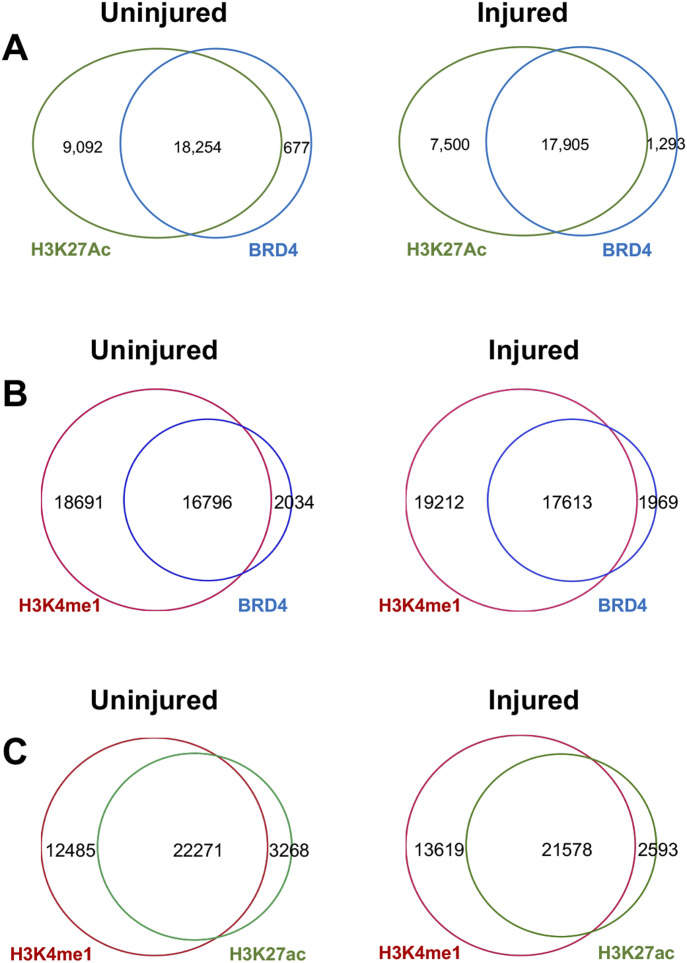
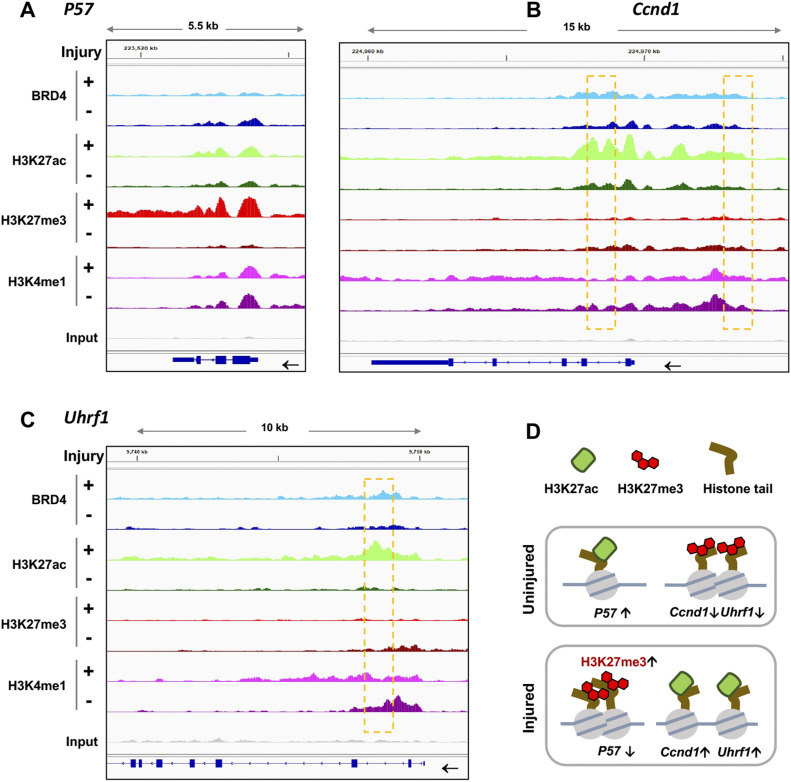
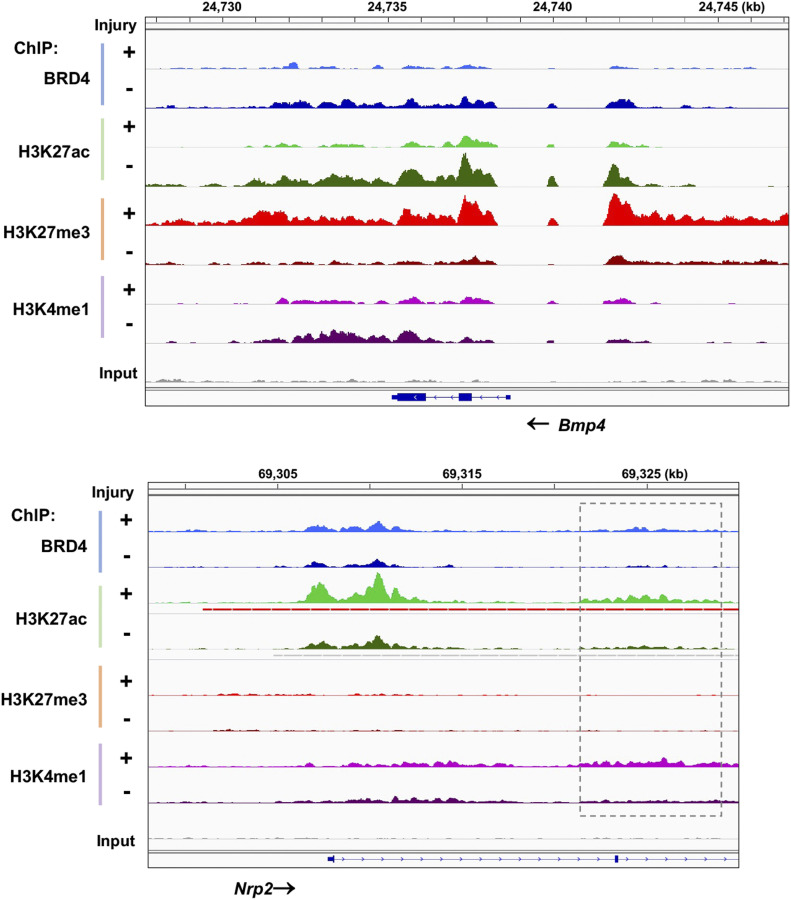
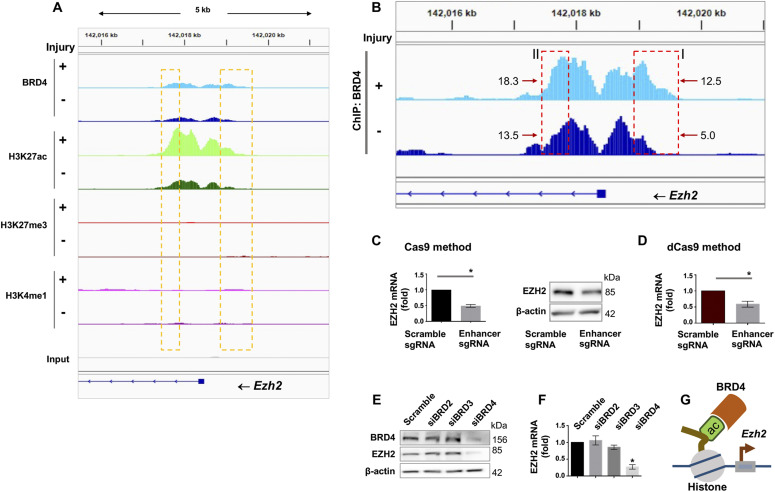
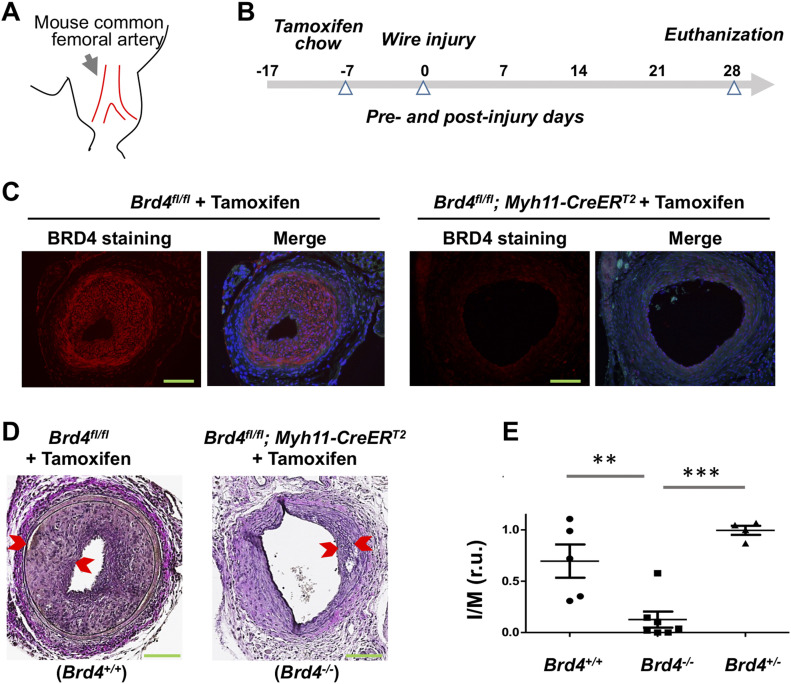
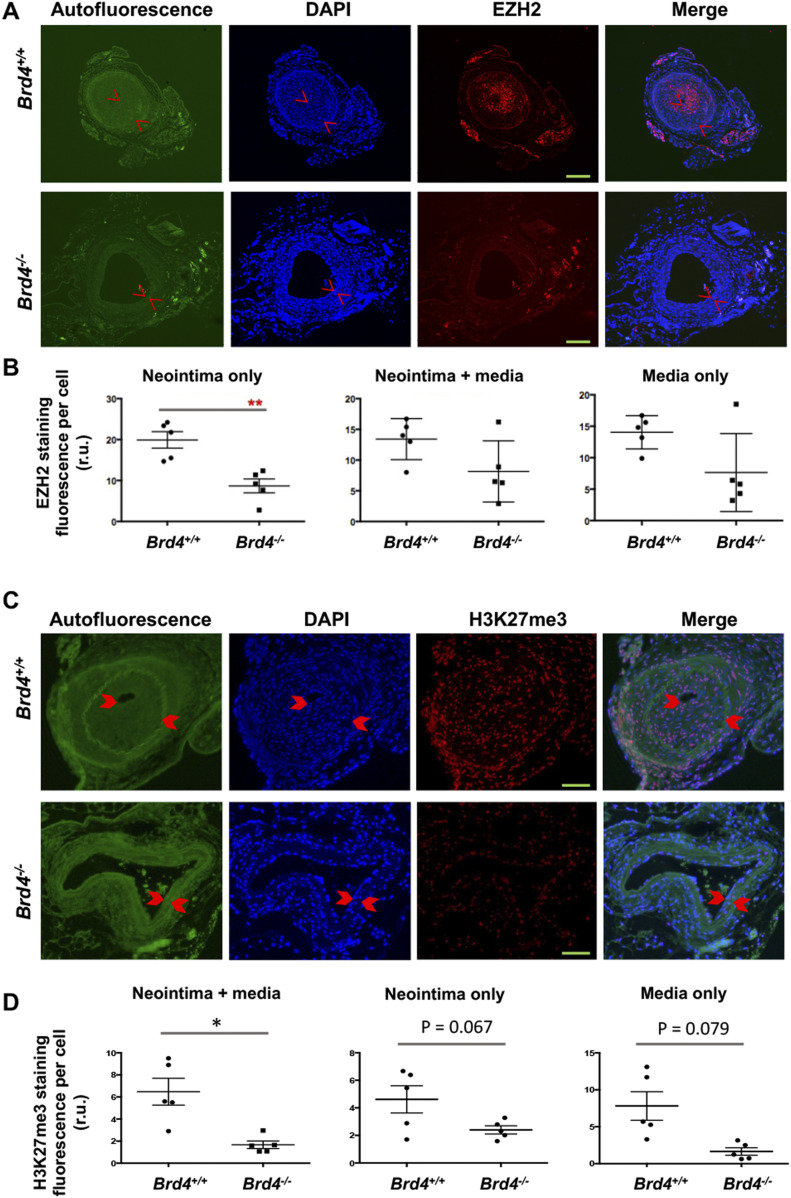
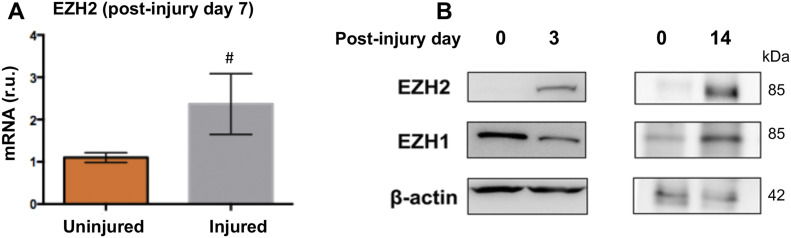
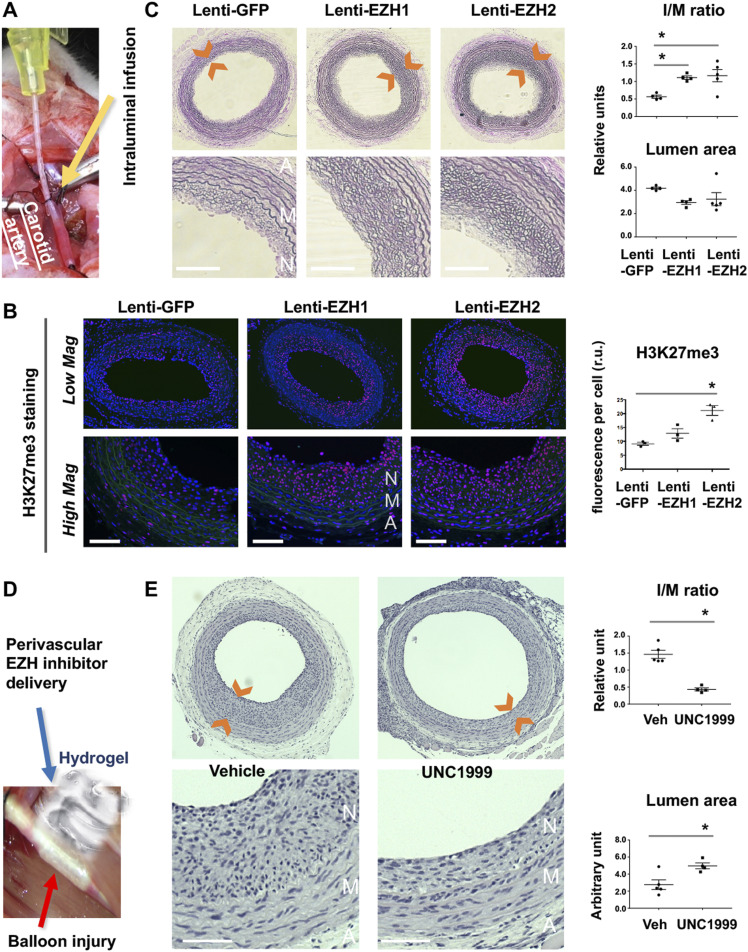
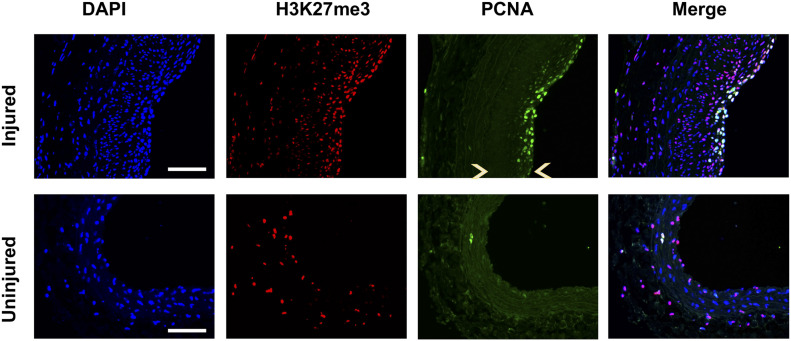
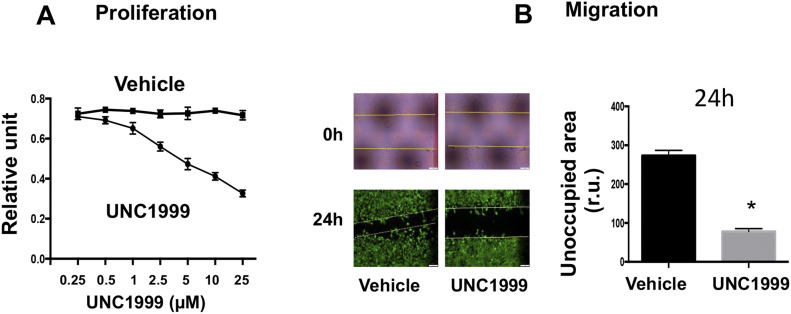
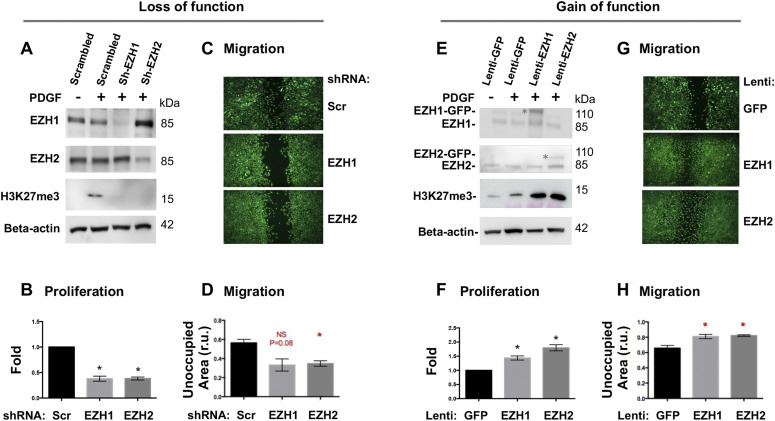
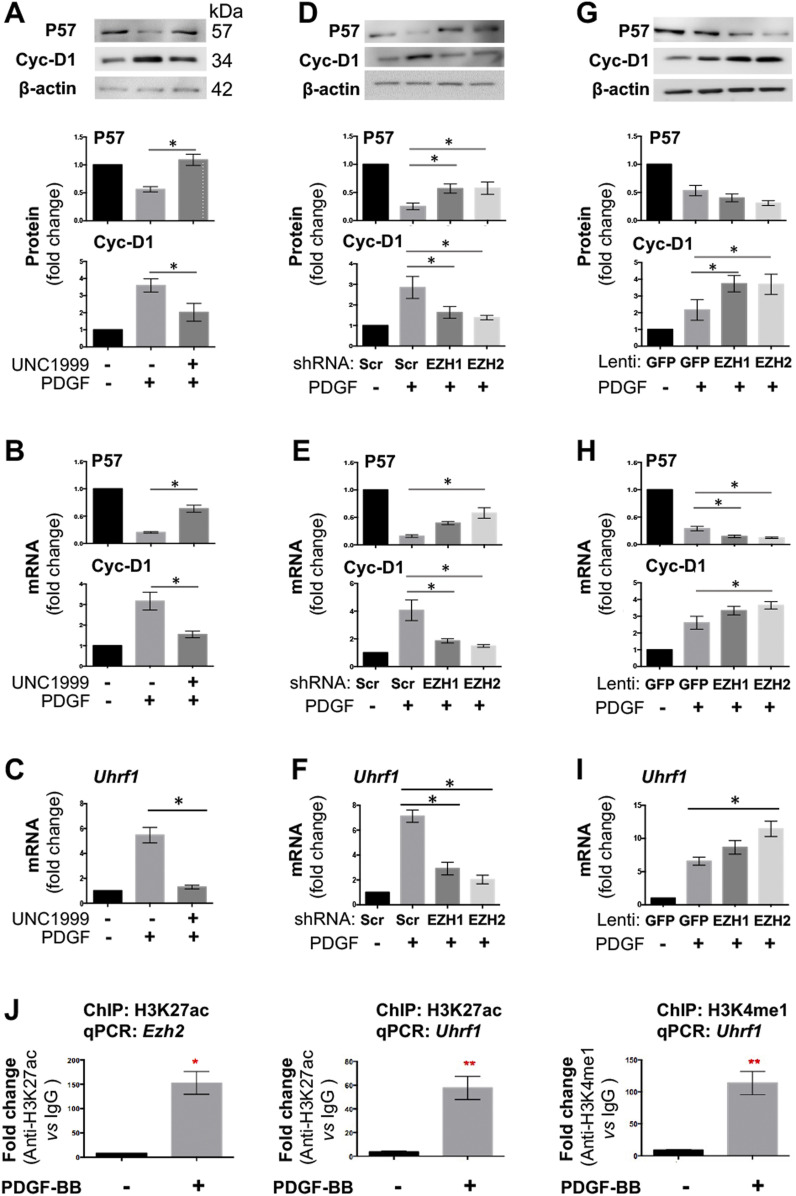
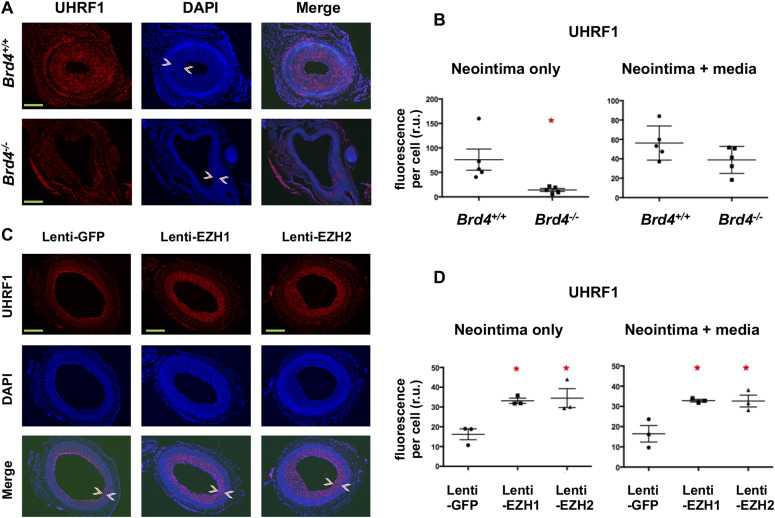
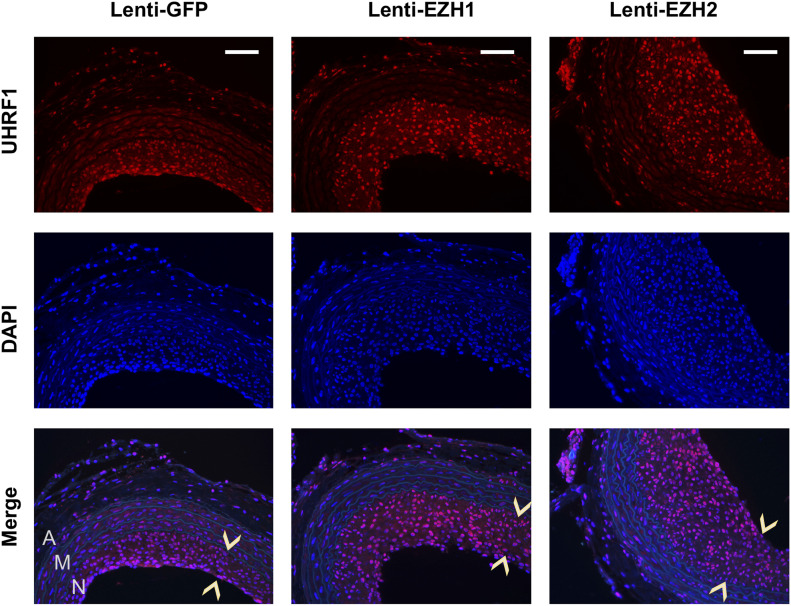
Neointimal hyperplasia/proliferation (IH) is the primary etiology of vascular stenosis. Epigenomic studies concerning IH have been largely confined to in vitro models, and IH-underlying epigenetic mechanisms remain poorly understood. This study integrates information from in vivo epigenomic mapping, conditional knockout, gene transfer and pharmacology in rodent models of IH. The data from injured (IH-prone) rat arteries revealed a surge of genome-wide occupancy by histone-3 lysine-27 trimethylation (H3K27me3), a gene-repression mark. This was unexpected in the traditional view of prevailing post-injury gene activation rather than repression. Further analysis illustrated a shift of H3K27me3 enrichment to anti-proliferative genes, from pro-proliferative genes where gene-activation mark H3K27ac(acetylation) accumulated instead. H3K27ac and its reader BRD4 (bromodomain protein) co-enriched at Ezh2; conditional BRD4 knockout in injured mouse arteries reduced H3K27me3 and its writer EZH2, which positively regulated another pro-IH chromatin modulator UHRF1. Thus, results uncover injury-induced loci-specific H3K27me3 redistribution in the epigenomic landscape entailing BRD4→EZH2→UHRF1 hierarchical regulations. Given that these players are pharmaceutical targets, further research may help improve treatments of IH.


Conflict of interest statement

The authors declare that they have no conflict of interest.

Figures

Figure S1.
Figure S1.. Angioplasty induces expression of pro-IH markers in balloon-injured rat carotid arteries.
The samples are equivalents of those used for ChIPseq in Fig 1. NRP2 and UHRF1 are pro-IH markers established in previous reports using the same model of rat common carotid artery balloon angioplasty. qRT-PCR data were normalized using the ΔΔCT-log2 approach. Quantification: Mean ± SD; n = 3 repeats; unpaired t test, *P < 0.05. r.u., relative unit.
Figure 1.
Figure 1.. Injury-induced genome-wide changes of ChIPseq reading in rat common carotid arteries.
Balloon-injured rat left common carotid arteries and contralateral arteries (uninjured sham control) were collected (each group pooled from 50 rats) at day 7 post angioplasty and snap-frozen for use in ChIPseq experiments. (A) ChIPseq heat map showing binding density of BRD4, H3K27ac, H3K27me3, or H3K4me1. ChIPseq signal anchors a 10 kb center region with 5 kb flanking on either side of the transcription start site. Hierarchical clustering highlights injury-induced increase of H3K27me3 ChIPseq signal (Cluster-1) and non-overlap between H3K27me3 and H3K27ac. (B) Functional enrichment of Clusters 1 and 2. Presented is dot plot of Top 10 molecular function (MF) gene ontology (GO) terms with color as adjusted P-value and size of dot as gene ratio. Enrichment analysis was performed by clusterProfiler.
Figure S2.
Figure S2.. Gene oncology (GO) analysis (including all three ChIPseq peak clusters).
GO enrichment was analyzed for molecular function (MF) terms, which were ranked by adjusted P-value (or Q value), a modified Fisher exact P-value. Gene ratio refers to the proportion of the selected genes versus the total genes belonging to the given term.
Figure 2.
Figure 2.. Comparison of ChIPseq peak coverage between injured and uninjured arteries.
(A) Bean plot showing genome-wide distribution of BRD4 or histone mark ChIPseq peak values. P-values from Wilcox test are presented above the plots. (B) Scatter plot showing injury-induced change in binding density (ChIPseq reads) of BRD4 or a histone mark. Red and blue indicates increase and decrease, respectively, with a twofold cutoff.
Figure S3.
Figure S3.. Overlap of ChIPseq peaks.
(A) Venn diagrams showing overlap of BRD4 and H3K27ac peaks. (B) Venn diagrams showing overlap of BRD4 and H3K4me1 peaks. (C) Venn diagrams showing overlap of H3K27ac and H3K4me1 peaks. Rat carotid artery balloon angioplasty, sample collection, ChIPseq, and data analysis were performed as described for Fig 1. Diagrams in (A) were used in our recent publication (PMID 33768129). Note: Whereas BRD4 and H3K27ac are both associated with active enhancers, H3K4me1 can be found with active, inactive, and also poised enhancers.
Figure 3.
Figure 3.. Injury-induced H3K27me3 enrichment at anti-proliferative gene P57 and BRD4/H3K27ac enrichment at pro-proliferative gene Ccnd1.
ChIPseq was performed as described for Fig 1. Integrative genomics viewer (IGV) tracks show comparison of normalized ChIPseq peaks between injured arteries (+, light color) and uninjured sham-control arteries (−, dark color). Boxes highlight the regions where the binding of H3K27ac and BRD4 increased after arterial injury. Non-specific input confirms low background noise. (A, B, C) IGV profiles of ChIPseq peaks illustrating loci-specific binding density of chromatin marks. (D) Schematic proposition of H3K27me3 and H3K27ac redistribution between anti-proliferative (e.g., P57) and pro-proliferative genes (e.g., Uhrf1 and Ccnd1), based on the artery tissue ChIPseq analysis. Note: The cartoon does not represent the true genomic locations of Uhrf1 and Ccnd1.
Figure S4.
Figure S4.. IGV profiles of ChIPseq peaks at Bmp4 and Nrp2.
Shown are ChIPseq peaks (or binding density) in injured arteries (+, light color) and uninjured sham control arteries (−, dark color). BMP4 represents an anti-proliferative factor; NRP2 represents a pro-proliferative factor. Nonspecific input indicates low background noise. Box indicates an intronic enhancer region.
Figure 4.
Figure 4.. Regulation of EZH2 expression by BRD4 in smooth muscle cells (SMCs) in vitro.
(A, B) BRD4 ChIPseq peaks at Ezh2 (B is the zoom-in version of A). Boxes highlight one enhancer region at the distal end of Ezh2 promoter and another within an intron. Genomic coordinates of Box-I: chr4 142018866-142019623; Box-II: chr4 142017383-142017905. Mean coverage of ChIPseq peaks (indicative of BRD4 binding dencity) within each box is labeled, with an arrow pointing to the box. Note the H3K4me1 signal is low relative to H3K27ac of the same scale. (C) Effect of Cas9-mediated enhancer deletion (genome editing) on EZH2 expression in rat primary aortic SMCs. sg, small guide RNA. The pair of sgRNAs flank an Ezh2 intronic region, that is, +1,161 bp to +218 bp from the transcription start site. Quantification: Mean ± SEM; n = 3 independent experiments; paired t test, *P < 0.05. (D) Disruption of EZH2 expression through a non-genome-editing, dead Cas9 (dCas9)-facilitated approach. Rat primary aortic SMCs were used. The same sgRNAs (as that in C) were used. Quantification: Mean ± SEM; n = 3 independent experiments; paired t test, *P < 0.05. (E, F) Effect of BRD4 silencing on EZH2 expression. BRD2, BRD3, or BRD4 was silenced with their specific siRNAs (validated in our recent reports) (Wang et al, 2015; Zhang et al, 2019). Cultured rat aortic SMCs were starved for 6 h before transfection with the siRNA for BRD2, 3, or 4 overnight. The cells recovered (without transfection reagents) for 24 and 48 h before RNA and protein extraction, respectively. EZH2 protein and mRNA were measured with Western blot and qRT-PCR (normalized by ΔΔCT-log2) assays. Quantification: Mean ± SEM; n = 3 independent experiments; one-way ANOVA with Bonferroni test, *P < 0.05 compared with the scrambled-sequence siRNA control. (G) Schematic depicting BRD4 and its co-localization with H3K27ac at Ezh2 that promote Ezh2 transcription. Source data are available for this figure.
Figure S5.
Figure S5.. Negative control of enhancer deletion via genome-editing CRISPR.
Genome-editing CRISPR was performed as described for Fig 4C except that the sgRNAs targeted an upstream region ∼50 kb away from the Ezh2 transcription start site. n.s., not significant.
Figure 5.
Figure 5.. Smooth muscle cell-specific BRD4 KO reduces IH in wire-injured mouse femoral arteries.
(A) Cartoon of mouse common femoral artery where wire injury was made to induce IH. (B) Diagram indicating the time line for tamoxifen feeding, wire injury, and tissue collection. (C) Immunofluorescence confirming tamoxifen-induced BRD4 KO in mouse arteries. Scale bar: 50 μm. (D) Comparison of IH between WT (Brd4fl/fl) and smooth muscle cell-specific BRD4 KO (Brd4fl/fl; Myh11-CreERT2) mice. Neointima thickness is demarcated by arrow heads. IH is normalized as intima/media area (I/M) ratio. Scale bar: 50 μm. (E) Quantification: Mean ± SEM; n = 4–7 mice, as indicated by the data points in scatter plots. Statistics: one-way ANOVA with Bonferroni test; **P < 0.01, ***P < 0.001; r.u., relative unit.
Figure 6.
Figure 6.. Reduced EZH2 and H3K27me3 in mouse arteries of smooth muscle cell-specific BRD4 KO.
Tamoxifen-induced BRD4 KO and wire injury were performed as described for Fig 5. (A, B, C, D) Immunofluorescence shows comparison of EZH2 (A, B) or its catalytic product H3K27me3 (C, D) between WT and BRD4 conditional KO mice. Neointima is demarcated by arrow heads. Fluorescence intensity was normalized to cell number (DAPI-stained nuclei). Scale bar: 50 μm. Quantification: Mean ± SEM; n = 5 mice as indicated by the data points in scatter plots. Statistics: nonparametric Mann–Whitney test following Shapiro–Wilk normality determination, *P < 0.05, **P < 0.01; r.u., relative unit.
Figure S6.
Figure S6.. Angioplasty-induced EZH2 up-regulation in rat carotid arteries.
(A, B) The samples are equivalents of those used for ChIPseq in Fig 1. qRT-PCR data were normalized using the ΔΔCT-log2 approach. Quantification: Mean ± SD; n = 3 repeats; unpaired t test, P = 0.15. r.u., relative unit. Source data are available for this figure.
Figure 7.
Figure 7.. Effect of EZH1 or EZH2 gain- or loss-of-function on IH in balloon-injured rat carotid arteries.
(A) Picture illustrating intraluminal infusion of lentivirus to express a gene in the balloon-injured rat carotid artery wall. A cannula (yellow device) connected to a syringe was used to inject lentivirus to the carotid artery lumen for infusion into the injured artery wall. (B) Gain of function. EZH overexpression (EZH1 or EZH2 each in fusion with GFP) in the injured rat carotid artery wall was accomplished via intraluminal infusion of lentivirus. Arteries were collected at post-injury day 14 for histology. Immunostained cross sections indicate increase of H3K27me3 in EZH-overexpressing arteries versus Lenti-GFP controls, predominantly in the neointima layer. A, adventitia. M, media. N, neointima. Scale bar: 50 μm. Quantification: Mean ± SEM; n = 3 rats; one-way ANOVA with Bonferroni test, *P < 0.05. No significance between Lenti-EZH1 and Lenti-GFP. (C) EZH gain-of-function exacerbates IH (measured as I/M ratio). Neointima is demarcated between arrow heads. Scale bar: 50 μm. Quantification: Mean ± SEM; n = 4–5 rats; one-way ANOVA with Bonferroni test, *P < 0.05. (D) Picture depicting perivascular application of pan-EZH inhibitor UNC1999 dispersed in a thermosensitive hydrogel. (E) EZH loss of function (inhibition) mitigates IH. Arteries were collected at post-injury day 14. Scale bar: 50 μm. Quantification: Mean ± SEM; n = 4–5 rats; unpaired t test, *P < 0.05.
Figure S7.
Figure S7.. Overlap of proliferating cell nuclear antigen (PCNA) with H3K27me3 in the neointima.
Rat common carotid arteries were balloon-injured and collected on day 14 after injury. Cross sections were immunostained for H3k27me3 or PCNA. Immunofluorescence shows PCNA colocalization with H3K27me3 in DAPI-stained nuclei. Neointima is indicated between arrow heads. Scale bar: 50 μm.
Figure S8.
Figure S8.. pan-EZH inhibitor mitigates smooth muscle cell proliferation and migration.
MOVAS cells were cultured, starved for 6 h, pretreated with vehicle (DMSO) or the pan-EZH1/2 inhibitor UNC1999 for 2 h, and then stimulated with PDGF-BB (final 20 ng/ml). (A, B) For proliferation (A) and migration (B, 5 μM UNC1999) assays, cells were harvested at 72 h or imaged at 24 h after PDGF-BB stimulation, respectively. For the scratch assay, the calcein dye was added at the end of 24 h PDGF treatment to illuminate the cells. The yellow lines on the 0 h picture demarcate the original scratched cell-free gap.
Figure 8.
Figure 8.. Effect of EZH1 or EZH2 gain- or loss-of-function on smooth muscle cell proliferation and migration.
(A, B, C, D) Loss of function. Silencing efficiency is indicated by Western blots (A). For proliferation (B) and migration (C, D) assays, cells were harvested at 72 h or imaged at 24 h after PDGF-BB stimulation, respectively. Scr, scrambled. NS, not significant. (E, F, G, H) Gain of function. EZH1 or EZH2 overexpression is shown in Western blots (E). * marks the recombinant protein in fusion with GFP; the lower band is endogenous protein. For proliferation (F) and migration (G, H) assays, cells were harvested at 72 h or imaged at 24 h after PDGF-BB stimulation, respectively. Quantification: Mean ± SEM; n = 3 independent experiments. Statistics: one-way ANOVA with Bonferroni test, *P < 0.05. Source data are available for this figure.
Figure 9.
Figure 9.. Effect of EZH1 or EZH2 gain- or loss-of-function on target gene expression.
MOVAS cells were pretreated with the pan-EZH1/2 inhibitor UNC1999 (5 μM) for 2 h, or transduced with lentivirus to silence or overexpress EZH1 or EZH2. Starved cells were stimulated with PDGF-BB (final 20 ng/ml) for 24 or 48 h before harvest for qRT-PCR or Western blot assay, respectively. Quantification: Mean ± SEM; n = 3 independent experiments. Statistics: one-way ANOVA with Bonferroni test, *P < 0.05, **P < 0.01. (A, B, C) Effect of pan-EZH1/2 inhibition on the expression of P57, cyclin-D1, and UHRF1. (D, E, F) Effect of EZH1 or EZH2 silencing on the expression of P57, cyclin-D1, and UHRF1. (G, H, I) Effect of increasing EZH1 or EZH2 on the expression of P57, cyclin-D1, and UHRF1. (J) ChIP-qPCR indicating H3K27ac or H3K4me1 binding at Ezh2 or Uhrf1. qPCR data were normalized to IgG control. Source data are available for this figure.
Figure 10.
Figure 10.. Immunofluorescent detection of UHRF1 on artery cross sections.
(A, B) Decrease in UHRF1 due to tamoxifen-induced BRD4 KO in wire-injured mouse femoral arteries. Neointima is demarcated between arrow heads. Scale bar: 50 μm. Fluorescence intensity was normalized to cell number. Quantification: Mean ± SEM; n = 5 mice. Statistics: nonparametric Mann–Whitney test following Shapiro–Wilk normality determination, *P < 0.05; r.u., relative unit. (C, D) Increase of UHRF1 after EZH1 or EZH2 overexpression in angioplasty-injured rat carotid arteries. Neointima is demarcated between arrow heads. Scale bar: 50 μm. Fluorescence intensity was normalized to cell number. Quantification: Mean ± SEM; n = 3 rats. Statistics: nonparametric Mann–Whitney test following Shapiro–Wilk normality determination, *P < 0.05 compared with GFP control; r.u., relative unit.
Figure S9.
Figure S9.. UHRF1 immunofluorescence localized in the nuclei of neointima cells.
The pictures are high-mag versions of that presented in Fig 10C. Neointima is indicated between arrow heads. A, adventitia. M, media. N, neointima. Scale bar: 50 μm.

Similar articles

Cited by

References

    1. Ai S, Yu X, Li Y, Peng Y, Li C, Yue Y, Tao G, Li C, Pu WT, He A (2017) Divergent requirements for ezh1 in heart development versus regeneration. Circ Res 121: 106–112. 10.1161/CIRCRESAHA.117.311212 - DOI - PMC - PubMed
    1. Anders L, Guenther MG, Qi J, Fan ZP, Marineau JJ, Rahl PB, Loven J, Sigova AA, Smith WB, Lee TI, et al. (2014) Genome-wide localization of small molecules. Nat Biotechnol 32: 92–96. 10.1038/nbt.2776 - DOI - PMC - PubMed
    1. Babbio F, Pistore C, Curti L, Castiglioni I, Kunderfranco P, Brino L, Oudet P, Seiler R, Thalman GN, Roggero E, et al. (2012) The sra protein uhrf1 promotes epigenetic crosstalks and is involved in prostate cancer progression. Oncogene 31: 4878–4887. 10.1038/onc.2011.641 - DOI - PubMed
    1. Borck PC, Guo LW, Plutzky J (2020) Bet epigenetic reader proteins in cardiovascular transcriptional programs. Circ Res 126: 1190–1208. 10.1161/CIRCRESAHA.120.315929 - DOI - PMC - PubMed
    1. Bradner JE, Hnisz D, Young RA (2017) Transcriptional addiction in cancer. Cell 168: 629–643. 10.1016/j.cell.2016.12.013 - DOI - PMC - PubMed

Publication types