. 2022 Feb 22;119(8):e2122293119.
doi: 10.1073/pnas.2122293119.

Epistatic genetic interactions govern morphogenesis during sexual reproduction and infection in a global human fungal pathogen

Affiliations

Epistatic genetic interactions govern morphogenesis during sexual reproduction and infection in a global human fungal pathogen

Sheng Sun et al. Proc Natl Acad Sci U S A. .

Erratum in

Abstract

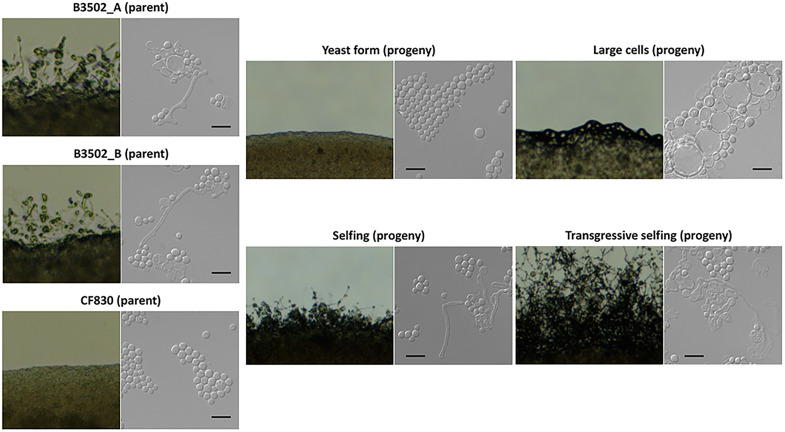
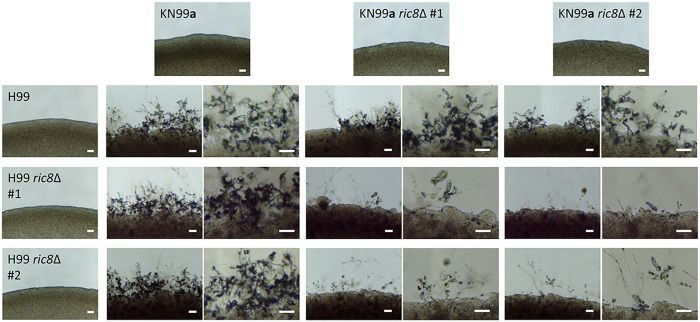
Cellular development is orchestrated by evolutionarily conserved signaling pathways, which are often pleiotropic and involve intra- and interpathway epistatic interactions that form intricate, complex regulatory networks. Cryptococcus species are a group of closely related human fungal pathogens that grow as yeasts yet transition to hyphae during sexual reproduction. Additionally, during infection they can form large, polyploid titan cells that evade immunity and develop drug resistance. Multiple known signaling pathways regulate cellular development, yet how these are coordinated and interact with genetic variation is less well understood. Here, we conducted quantitative trait locus (QTL) analyses of a mapping population generated by sexual reproduction of two parents, only one of which is unisexually fertile. We observed transgressive segregation of the unisexual phenotype among progeny, as well as a large-cell phenotype under mating-inducing conditions. These large-cell progeny were found to produce titan cells both in vitro and in infected animals. Two major QTLs and corresponding quantitative trait genes (QTGs) were identified: RIC8 (encoding a guanine-exchange factor) and CNC06490 (encoding a putative Rho-GTPase activator), both involved in G protein signaling. The two QTGs interact epistatically with each other and with the mating-type locus in phenotypic determination. These findings provide insights into the complex genetics of morphogenesis during unisexual reproduction and pathogenic titan cell formation and illustrate how QTL analysis can be applied to identify epistasis between genes. This study shows that phenotypic outcomes are influenced by the genetic background upon which mutations arise, implicating dynamic, complex genotype-to-phenotype landscapes in fungal pathogens and beyond.

Keywords: Cryptococcus; QTL; cell development; genetic variation; pathogenicity.


Conflict of interest statement

The authors declare no competing interest.

Figures

Fig. 1.
Fig. 1.
B3502 strains undergoing unisexual reproduction harbor a nonsense mutation in the RIC8 gene. (A) Under mating-inducing conditions, only B3502_A and B3502_B undergo unisexual reproduction, while B3502_C and B3502_D do not. (Scale bars, 40 μm.) (B) The RIC8G1958T nonsense mutation is only present in strains capable of selfing, including B3502_A, B3502_B, as well as XL280a and XL280α that were derived from crosses involving B3502_B. Minor alleles are highlighted in grey. (C) Genealogy of strains related to B3502. Blue and orange arrows trace the origin and inheritance of the QTGs influencing the phenotypes under mating condition among the B3502 stocks and the progeny from crosses B3502_A × CF830 and B3502_B × CF830.
Fig. 2.
Fig. 2.
Colony and cellular morphologies under mating conditions of progeny recovered from B3502 crosses. Images of solo cultures on MS solid medium under mating condition (Left) and cells under microscope (Right) are shown for the three parental strains (B3502_A, B3502_B, and CF830) and four progeny representing four different phenotypes under mating conditions. (Scale bars, 10 μm.)
Fig. 3.
Fig. 3.
Large-cell progeny produce titan cells in vitro and in vivo. (A) Large cells are produced by the large-cell progeny under in vitro titan-cell-inducing conditions. For each strain, the images on the left and right are taken using 20× and 40× objectives, respectively. Strain H99 usv101Δ is known to produce titan cells and is included as positive control. (Scale bars, 10 μm.) (B) Under in vitro titan-cell-inducing conditions, the large-cell progeny produced cells with diameters >10 μm at higher frequencies. (Inset) Frequencies of cells with diameters >15 μm using an adjusted y axis. More than 1,000 cells from each strain were analyzed using Cellometer and independent measurements of cell sizes of each strain using ImageJ are presented in SI Appendix, Fig. S4. (C) FACS analysis showed that large-cell progeny produced cells with elevated ploidy under in vitro titan-cell-inducing conditions. The x and y axes show DNA content levels and cell counts, respectively. (D) Large-cell progeny produced enlarged cells in vivo. The top and bottom panels are histopathology images of mouse lungs dissected 8 and 21 d after inoculation, respectively. For large-cell progeny, the images on the left are at the same scale as those of the other strains (Scale bar, 50 μm), while the images on the right are taken at higher magnification (Scale bar, 20 μm). The black arrowheads highlight enlarged cells observed in the lungs inoculated with large-cell progeny; the red arrowhead highlights the thickened capsule surrounding the enlarged cell.
Fig. 4.
Fig. 4.
QTL analyses identify two QTGs associated with selfing and large-cell phenotypes. (A) Manhattan plot displaying the genome-wide strength in association (measured with a mutual information statistic [I (Gn; S), y axis] between genetic variants (x axis) and the selfing-cellular phenotypes. Colors separate chromosomes, and the position of the MAT locus is indicated by a red horizontal bar and text. Above the QTL on Chromosomes 3 and 14 are gene models for the QTGs, CNC06490 and RIC8, displaying the position and predicted effects of the identified QTN within each gene (left and right, respectively). (B) A phenotype-by-genotype plot depicting the cellular phenotypes (y axis) of the F1 progeny as a function of the parental RIC8 allele (x axis) colored by the allele inherited at CNC06490. Dots and triangles denote the presence of the MATα or MATa allele for each progeny, respectively. (C) Information gain null distribution (gray) and observed informational gain statistic (red) testing for a three-way, epistatic interaction between the QTN (RIC8G1958T and CNC06490T2203C) and the MAT locus.
Fig. 5.
Fig. 5.
Deletion of RIC8 leads to attenuated bisexual mating in C. neoformans. Images of mating cocultures at lower (Left) and higher (Right) magnifications are shown for the wild-type control cross between H99 and KN99a as well as reciprocal unilateral crosses and bilateral crosses of two ric8Δ deletion strains each in the H99 and KN99a congenic backgrounds. The images in the top row and on the far left are solo cultures of the parental strains at lower magnifications. While all four unilateral crosses showed mating efficiencies that are comparable to the wild-type control cross, the four ric8Δ deletion bilateral crosses showed dramatically less robust mating, manifested as reduced hyphal growth and fewer basidia and basidiospores. (Scale bars, 40 μm.)

Similar articles

Cited by

References

    1. Granek J. A., Kayıkçı Ö., Magwene P. M., Pleiotropic signaling pathways orchestrate yeast development. Curr. Opin. Microbiol. 14, 676–681 (2011). - PMC - PubMed
    1. Kim D.-U., et al. , Analysis of a genome-wide set of gene deletions in the fission yeast Schizosaccharomyces pombe. Nat. Biotechnol. 28, 617–623 (2010). - PMC - PubMed
    1. Blomen V. A., et al. , Gene essentiality and synthetic lethality in haploid human cells. Science 350, 1092–1096 (2015). - PubMed
    1. Boutros M., et al. ; Heidelberg Fly Array Consortium, Genome-wide RNAi analysis of growth and viability in Drosophila cells. Science 303, 832–835 (2004). - PubMed
    1. Hart T., et al. , High-resolution CRISPR screens reveal fitness genes and genotype-specific cancer liabilities. Cell 163, 1515–1526 (2015). - PubMed

Substances

LinkOut - more resources